Alsatian vs Russian Disability Age 65 to 74
COMPARE
Alsatian
Russian
Disability Age 65 to 74
Disability Age 65 to 74 Comparison
Alsatians
Russians
22.8%
DISABILITY AGE 65 TO 74
83.7/ 100
METRIC RATING
146th/ 347
METRIC RANK
21.2%
DISABILITY AGE 65 TO 74
99.8/ 100
METRIC RATING
38th/ 347
METRIC RANK
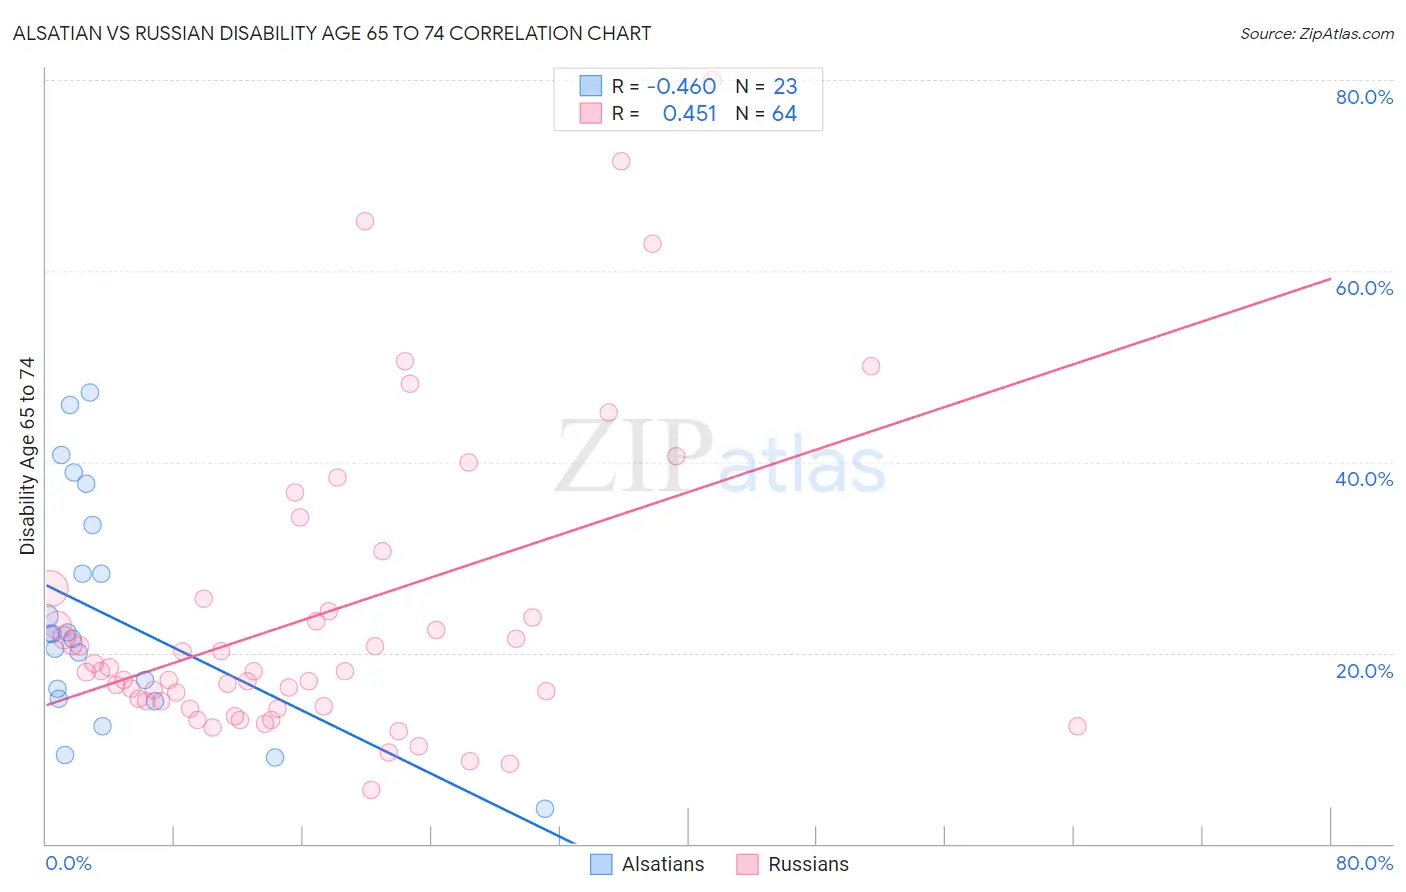
Alsatian vs Russian Disability Age 65 to 74 Correlation Chart
The statistical analysis conducted on geographies consisting of 82,675,825 people shows a moderate negative correlation between the proportion of Alsatians and percentage of population with a disability between the ages 65 and 75 in the United States with a correlation coefficient (R) of -0.460 and weighted average of 22.8%. Similarly, the statistical analysis conducted on geographies consisting of 510,598,178 people shows a moderate positive correlation between the proportion of Russians and percentage of population with a disability between the ages 65 and 75 in the United States with a correlation coefficient (R) of 0.451 and weighted average of 21.2%, a difference of 7.7%.
Disability Age 65 to 74 Correlation Summary
| Measurement | Alsatian | Russian |
| Minimum | 3.7% | 5.7% |
| Maximum | 47.3% | 80.0% |
| Range | 43.7% | 74.3% |
| Mean | 23.9% | 23.9% |
| Median | 22.0% | 18.1% |
| Interquartile 25% (IQ1) | 15.2% | 14.7% |
| Interquartile 75% (IQ3) | 33.3% | 25.0% |
| Interquartile Range (IQR) | 18.2% | 10.4% |
| Standard Deviation (Sample) | 12.0% | 15.8% |
| Standard Deviation (Population) | 11.7% | 15.7% |
Similar Demographics by Disability Age 65 to 74
Demographics Similar to Alsatians by Disability Age 65 to 74
In terms of disability age 65 to 74, the demographic groups most similar to Alsatians are Immigrants from Uganda (22.8%, a difference of 0.030%), Danish (22.8%, a difference of 0.070%), Immigrants from Uzbekistan (22.8%, a difference of 0.070%), Arab (22.8%, a difference of 0.12%), and Immigrants from Ethiopia (22.7%, a difference of 0.18%).
| Demographics | Rating | Rank | Disability Age 65 to 74 |
| Immigrants | Syria | 85.8 /100 | #139 | Excellent 22.7% |
| Ugandans | 85.4 /100 | #140 | Excellent 22.7% |
| Belgians | 85.3 /100 | #141 | Excellent 22.7% |
| Immigrants | Ethiopia | 85.3 /100 | #142 | Excellent 22.7% |
| Arabs | 84.8 /100 | #143 | Excellent 22.8% |
| Danes | 84.4 /100 | #144 | Excellent 22.8% |
| Immigrants | Uganda | 84.0 /100 | #145 | Excellent 22.8% |
| Alsatians | 83.7 /100 | #146 | Excellent 22.8% |
| Immigrants | Uzbekistan | 83.1 /100 | #147 | Excellent 22.8% |
| New Zealanders | 79.9 /100 | #148 | Good 22.9% |
| Swiss | 79.7 /100 | #149 | Good 22.9% |
| Canadians | 77.7 /100 | #150 | Good 22.9% |
| Immigrants | Morocco | 77.6 /100 | #151 | Good 22.9% |
| Finns | 76.5 /100 | #152 | Good 22.9% |
| Slavs | 75.2 /100 | #153 | Good 23.0% |
Demographics Similar to Russians by Disability Age 65 to 74
In terms of disability age 65 to 74, the demographic groups most similar to Russians are Israeli (21.2%, a difference of 0.0%), Immigrants from Switzerland (21.1%, a difference of 0.11%), Argentinean (21.2%, a difference of 0.18%), Bulgarian (21.1%, a difference of 0.30%), and Latvian (21.2%, a difference of 0.35%).
| Demographics | Rating | Rank | Disability Age 65 to 74 |
| Immigrants | Northern Europe | 99.9 /100 | #31 | Exceptional 21.0% |
| Turks | 99.9 /100 | #32 | Exceptional 21.0% |
| Immigrants | Argentina | 99.9 /100 | #33 | Exceptional 21.1% |
| Immigrants | Sri Lanka | 99.9 /100 | #34 | Exceptional 21.1% |
| Bulgarians | 99.9 /100 | #35 | Exceptional 21.1% |
| Immigrants | Switzerland | 99.8 /100 | #36 | Exceptional 21.1% |
| Israelis | 99.8 /100 | #37 | Exceptional 21.2% |
| Russians | 99.8 /100 | #38 | Exceptional 21.2% |
| Argentineans | 99.8 /100 | #39 | Exceptional 21.2% |
| Latvians | 99.8 /100 | #40 | Exceptional 21.2% |
| Immigrants | Austria | 99.8 /100 | #41 | Exceptional 21.2% |
| Macedonians | 99.7 /100 | #42 | Exceptional 21.3% |
| Immigrants | Croatia | 99.7 /100 | #43 | Exceptional 21.3% |
| Estonians | 99.7 /100 | #44 | Exceptional 21.4% |
| Asians | 99.7 /100 | #45 | Exceptional 21.4% |