Alaskan Athabascan vs Immigrants from North Macedonia Kindergarten

COMPARE

Alaskan Athabascan
Race
Ancestry
AfghanAfricanAlaska NativeAlaskan AthabascanAlbanianAleutAlsatianAmericanApacheArabArapahoArgentineanArmenianAssyrian/Chaldean/SyriacAustralianAustrianBahamianBangladeshiBarbadianBasqueBelgianBelizeanBermudanBhutaneseBlackfeetBolivianBrazilianBritishBritish West IndianBulgarianBurmeseCajunCambodianCanadianCape VerdeanCarpatho RusynCelticCentral AmericanCentral American IndianCherokeeCheyenneChickasawChileanChineseChippewaChoctawColombianColvilleComancheCosta RicanCreeCreekCroatianCrowCubanCypriotCzechCzechoslovakianDanishDelawareDominicanDutchDutch West IndianEastern EuropeanEcuadorianEgyptianEnglishEstonianEthiopianEuropeanFijianFilipinoFinnishFrenchFrench American IndianFrench CanadianGermanGerman RussianGhanaianGreekGuamanian/ChamorroGuatemalanGuyaneseHaitianHmongHonduranHopiHoumaHungarianIcelanderIndian (Asian)IndonesianInupiatIranianIraqiIrishIroquoisIsraeliItalianJamaicanJapaneseJordanianKenyanKiowaKoreanLaotianLatvianLebaneseLiberianLithuanianLumbeeLuxembourgerMacedonianMalaysianMalteseMarshalleseMenomineeMexicanMexican American IndianMongolianMoroccanNative HawaiianNavajoNepaleseNew ZealanderNicaraguanNigerianNorthern EuropeanNorwegianOkinawanOsageOttawaPaiutePakistaniPalestinianPanamanianParaguayanPennsylvania GermanPeruvianPimaPolishPortuguesePotawatomiPuebloPuerto RicanPuget Sound SalishRomanianRussianSalvadoranSamoanScandinavianScotch-IrishScottishSeminoleSenegaleseSerbianShoshoneSierra LeoneanSiouxSlavicSlovakSloveneSomaliSouth AfricanSouth AmericanSouth American IndianSoviet UnionSpaniardSpanishSpanish AmericanSpanish American IndianSri LankanSubsaharan AfricanSudaneseSwedishSwissSyrianTaiwaneseThaiTlingit-HaidaTohono O'OdhamTonganTrinidadian and TobagonianTsimshianTurkishU.S. Virgin IslanderUgandanUkrainianUruguayanUteVenezuelanVietnameseWelshWest IndianYakamaYaquiYugoslavianYumanYup'ikZimbabwean
Immigration
NonimmigrantsImmigrantsAfghanistanAfricaAlbaniaArgentinaArmeniaAsiaAustraliaAustriaBahamasBangladeshBarbadosBelarusBelgiumBelizeBoliviaBosnia and HerzegovinaBrazilBulgariaBurma/MyanmarCabo VerdeCambodiaCameroonCanadaCaribbeanCentral AmericaChileChinaColombiaCongoCosta RicaCroatiaCubaCzechoslovakiaDenmarkDominicaDominican RepublicEastern AfricaEastern AsiaEastern EuropeEcuadorEgyptEl SalvadorEnglandEritreaEthiopiaEuropeFijiFranceGermanyGhanaGreeceGrenadaGuatemalaGuyanaHaitiHondurasHong KongHungaryIndiaIndonesiaIranIraqIrelandIsraelItalyJamaicaJapanJordanKazakhstanKenyaKoreaKuwaitLaosLatin AmericaLatviaLebanonLiberiaLithuaniaMalaysiaMexicoMicronesiaMiddle AfricaMoldovaMoroccoNepalNetherlandsNicaraguaNigeriaNorth AmericaNorthern AfricaNorthern EuropeNorwayOceaniaPakistanPanamaPeruPhilippinesPolandPortugalRomaniaRussiaSaudi ArabiaScotlandSenegalSerbiaSierra LeoneSingaporeSomaliaSouth AfricaSouth AmericaSouth Central AsiaSouth Eastern AsiaSouthern EuropeSpainSri LankaSt. Vincent and the GrenadinesSudanSwedenSwitzerlandSyriaTaiwanThailandTrinidad and TobagoTurkeyUgandaUkraineUruguayUzbekistanVenezuelaVietnamWest IndiesWestern AfricaWestern AsiaWestern EuropeYemenZaireZimbabweAzores
Immigrants from North Macedonia
Race
Ancestry
AfghanAfricanAlaska NativeAlbanianAleutAlsatianAmericanApacheArabArapahoArgentineanArmenianAssyrian/Chaldean/SyriacAustralianAustrianBahamianBangladeshiBarbadianBasqueBelgianBelizeanBermudanBhutaneseBlackfeetBolivianBrazilianBritishBritish West IndianBulgarianBurmeseCajunCambodianCanadianCape VerdeanCarpatho RusynCelticCentral AmericanCentral American IndianCherokeeCheyenneChickasawChileanChineseChippewaChoctawColombianColvilleComancheCosta RicanCreeCreekCroatianCrowCubanCypriotCzechCzechoslovakianDanishDelawareDominicanDutchDutch West IndianEastern EuropeanEcuadorianEgyptianEnglishEstonianEthiopianEuropeanFijianFilipinoFinnishFrenchFrench American IndianFrench CanadianGermanGerman RussianGhanaianGreekGuamanian/ChamorroGuatemalanGuyaneseHaitianHmongHonduranHopiHoumaHungarianIcelanderIndian (Asian)IndonesianInupiatIranianIraqiIrishIroquoisIsraeliItalianJamaicanJapaneseJordanianKenyanKiowaKoreanLaotianLatvianLebaneseLiberianLithuanianLumbeeLuxembourgerMacedonianMalaysianMalteseMarshalleseMenomineeMexicanMexican American IndianMongolianMoroccanNative HawaiianNavajoNepaleseNew ZealanderNicaraguanNigerianNorthern EuropeanNorwegianOkinawanOsageOttawaPaiutePakistaniPalestinianPanamanianParaguayanPennsylvania GermanPeruvianPimaPolishPortuguesePotawatomiPuebloPuerto RicanPuget Sound SalishRomanianRussianSalvadoranSamoanScandinavianScotch-IrishScottishSeminoleSenegaleseSerbianShoshoneSierra LeoneanSiouxSlavicSlovakSloveneSomaliSouth AfricanSouth AmericanSouth American IndianSoviet UnionSpaniardSpanishSpanish AmericanSpanish American IndianSri LankanSubsaharan AfricanSudaneseSwedishSwissSyrianTaiwaneseThaiTlingit-HaidaTohono O'OdhamTonganTrinidadian and TobagonianTsimshianTurkishU.S. Virgin IslanderUgandanUkrainianUruguayanUteVenezuelanVietnameseWelshWest IndianYakamaYaquiYugoslavianYumanYup'ikZimbabwean
Immigration
NonimmigrantsImmigrantsAfghanistanAfricaAlbaniaArgentinaArmeniaAsiaAustraliaAustriaBahamasBangladeshBarbadosBelarusBelgiumBelizeBoliviaBosnia and HerzegovinaBrazilBulgariaBurma/MyanmarCabo VerdeCambodiaCameroonCanadaCaribbeanCentral AmericaChileChinaColombiaCongoCosta RicaCroatiaCubaCzechoslovakiaDenmarkDominicaDominican RepublicEastern AfricaEastern AsiaEastern EuropeEcuadorEgyptEl SalvadorEnglandEritreaEthiopiaEuropeFijiFranceGermanyGhanaGreeceGrenadaGuatemalaGuyanaHaitiHondurasHong KongHungaryIndiaIndonesiaIranIraqIrelandIsraelItalyJamaicaJapanJordanKazakhstanKenyaKoreaKuwaitLaosLatin AmericaLatviaLebanonLiberiaLithuaniaMalaysiaMexicoMicronesiaMiddle AfricaMoldovaMoroccoNepalNetherlandsNicaraguaNigeriaNorth AmericaNorth MacedoniaNorthern AfricaNorthern EuropeNorwayOceaniaPakistanPanamaPeruPhilippinesPolandPortugalRomaniaRussiaSaudi ArabiaScotlandSenegalSerbiaSierra LeoneSingaporeSomaliaSouth AfricaSouth AmericaSouth Central AsiaSouth Eastern AsiaSouthern EuropeSpainSri LankaSt. Vincent and the GrenadinesSudanSwedenSwitzerlandSyriaTaiwanThailandTrinidad and TobagoTurkeyUgandaUkraineUruguayUzbekistanVenezuelaVietnamWest IndiesWestern AfricaWestern AsiaWestern EuropeYemenZaireZimbabweAzores
Kindergarten
Income
Poverty
Unemployment
Labor Participation
Family Structure
Vehicle Availability
Education Level
Disability

Kindergarten Comparison

Alaskan Athabascans

Immigrants from North Macedonia

Exceptional
Good
98.8%
KINDERGARTEN
100.0/ 100
METRIC RATING
6th/ 347
METRIC RANK
98.0%
KINDERGARTEN
66.4/ 100
METRIC RATING
157th/ 347
METRIC RANK

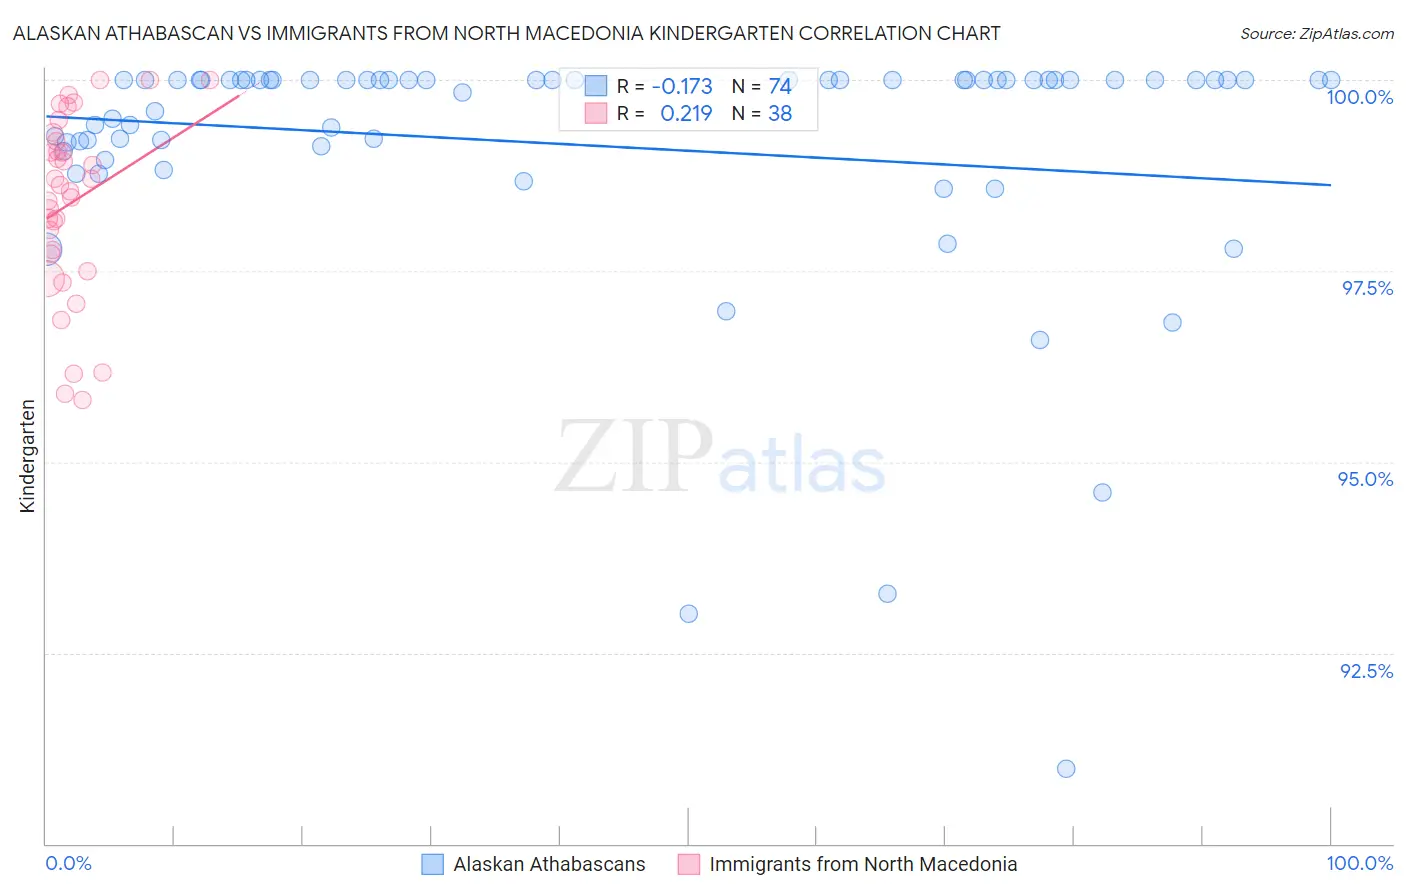
Alaskan Athabascan vs Immigrants from North Macedonia Kindergarten Correlation Chart

The statistical analysis conducted on geographies consisting of 45,820,365 people shows a poor negative correlation between the proportion of Alaskan Athabascans and percentage of population with at least kindergarten education in the United States with a correlation coefficient (R) of -0.173 and weighted average of 98.8%. Similarly, the statistical analysis conducted on geographies consisting of 74,317,186 people shows a weak positive correlation between the proportion of Immigrants from North Macedonia and percentage of population with at least kindergarten education in the United States with a correlation coefficient (R) of 0.219 and weighted average of 98.0%, a difference of 0.80%.
Alaskan Athabascan vs Immigrants from North Macedonia Kindergarten

Kindergarten Correlation Summary

MeasurementAlaskan AthabascanImmigrants from North Macedonia
Minimum91.0%95.8%
Maximum100.0%100.0%
Range9.0%4.2%
Mean99.1%98.4%
Median100.0%98.6%
Interquartile 25% (IQ1)99.1%97.7%
Interquartile 75% (IQ3)100.0%99.2%
Interquartile Range (IQR)0.87%1.5%
Standard Deviation (Sample)1.7%1.2%
Standard Deviation (Population)1.7%1.2%

Similar Demographics by Kindergarten

Demographics Similar to Alaskan Athabascans by Kindergarten

In terms of kindergarten, the demographic groups most similar to Alaskan Athabascans are Alaska Native (98.7%, a difference of 0.040%), Norwegian (98.7%, a difference of 0.060%), Tsimshian (98.8%, a difference of 0.070%), Tlingit-Haida (98.7%, a difference of 0.080%), and Slovak (98.7%, a difference of 0.080%).
DemographicsRating | RankKindergarten
Crow
100.0
/100
|
#1
Exceptional
99.7%
Yup'ik
100.0
/100
|
#2
Exceptional
99.2%
Inupiat
100.0
/100
|
#3
Exceptional
98.9%
Welsh
100.0
/100
|
#4
Exceptional
98.9%
Tsimshian
100.0
/100
|
#5
Exceptional
98.8%
Alaskan Athabascans
100.0
/100
|
#6
Exceptional
98.8%
Alaska Natives
100.0
/100
|
#7
Exceptional
98.7%
Norwegians
100.0
/100
|
#8
Exceptional
98.7%
Tlingit-Haida
100.0
/100
|
#9
Exceptional
98.7%
Slovaks
100.0
/100
|
#10
Exceptional
98.7%
Germans
100.0
/100
|
#11
Exceptional
98.7%
Slovenes
100.0
/100
|
#12
Exceptional
98.7%
Carpatho Rusyns
100.0
/100
|
#13
Exceptional
98.7%
English
100.0
/100
|
#14
Exceptional
98.7%
Swedes
100.0
/100
|
#15
Exceptional
98.7%

Demographics Similar to Immigrants from North Macedonia by Kindergarten

In terms of kindergarten, the demographic groups most similar to Immigrants from North Macedonia are Immigrants from South Central Asia (98.0%, a difference of 0.0%), Dutch West Indian (98.0%, a difference of 0.010%), Immigrants from Moldova (98.0%, a difference of 0.010%), Immigrants from Iran (98.0%, a difference of 0.010%), and Comanche (98.0%, a difference of 0.010%).
DemographicsRating | RankKindergarten
Jordanians
72.8
/100
|
#150
Good
98.0%
Soviet Union
70.8
/100
|
#151
Good
98.0%
Dutch West Indians
70.1
/100
|
#152
Good
98.0%
Immigrants | Moldova
69.1
/100
|
#153
Good
98.0%
Immigrants | Iran
68.8
/100
|
#154
Good
98.0%
Comanche
68.3
/100
|
#155
Good
98.0%
Immigrants | South Central Asia
66.6
/100
|
#156
Good
98.0%
Immigrants | North Macedonia
66.4
/100
|
#157
Good
98.0%
Venezuelans
64.7
/100
|
#158
Good
98.0%
French American Indians
63.7
/100
|
#159
Good
98.0%
Immigrants | Russia
59.0
/100
|
#160
Average
98.0%
Immigrants | Eastern Europe
59.0
/100
|
#161
Average
98.0%
Immigrants | Italy
58.9
/100
|
#162
Average
98.0%
Spanish Americans
57.8
/100
|
#163
Average
98.0%
Immigrants | Micronesia
57.7
/100
|
#164
Average
98.0%