Alaskan Athabascan vs Immigrants from North Macedonia Unemployment Among Youth under 25 years
COMPARE
Alaskan Athabascan
Immigrants from North Macedonia
Unemployment Among Youth under 25 years
Unemployment Among Youth under 25 years Comparison
Alaskan Athabascans
Immigrants from North Macedonia
12.2%
UNEMPLOYMENT AMONG YOUTH UNDER 25 YEARS
0.6/ 100
METRIC RATING
244th/ 347
METRIC RANK
10.7%
UNEMPLOYMENT AMONG YOUTH UNDER 25 YEARS
100.0/ 100
METRIC RATING
25th/ 347
METRIC RANK
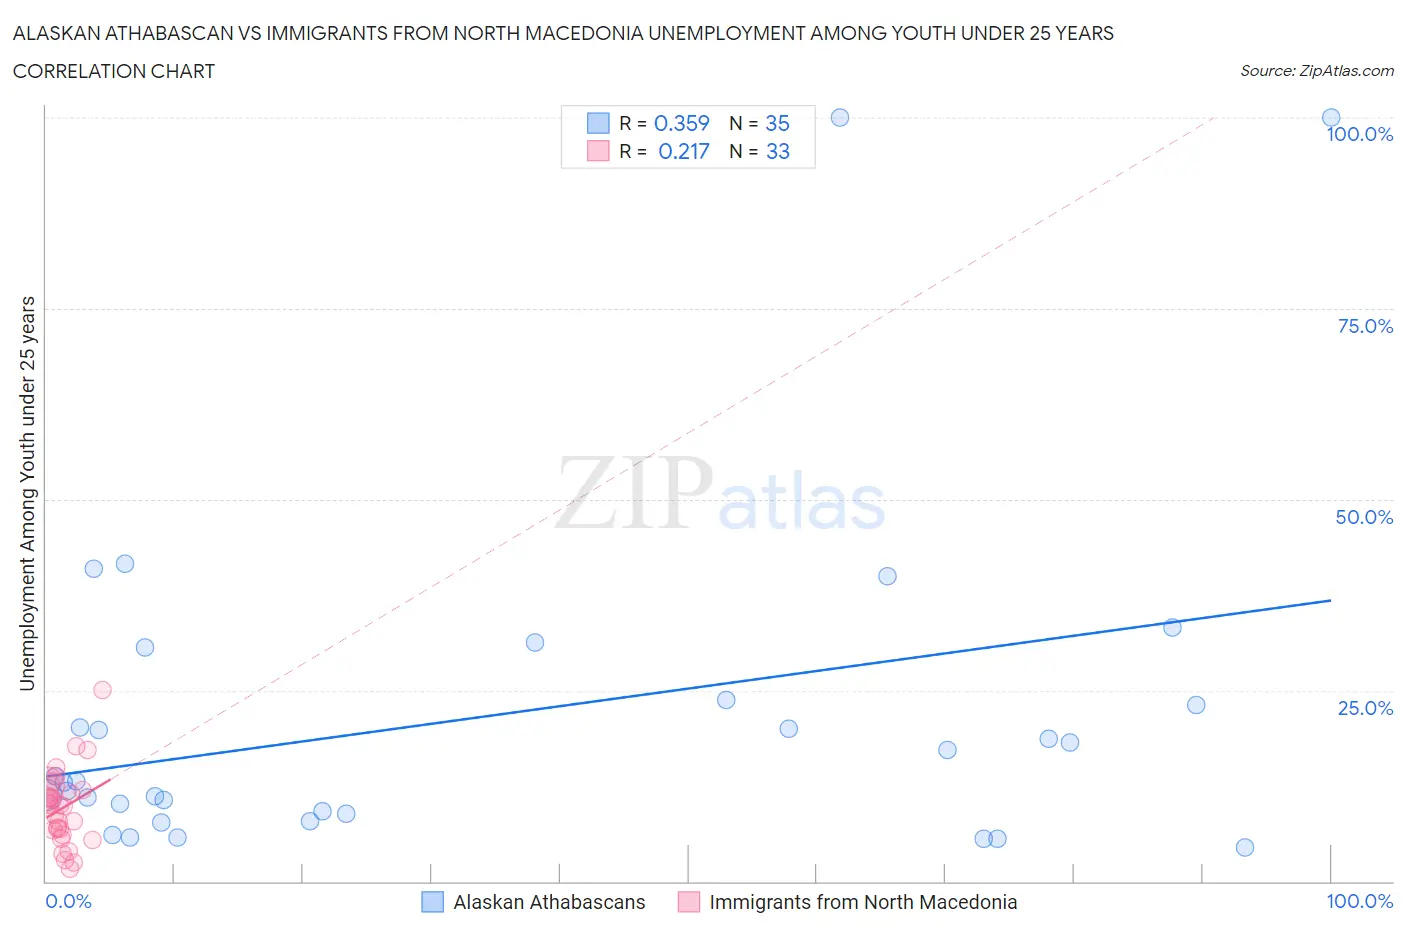
Alaskan Athabascan vs Immigrants from North Macedonia Unemployment Among Youth under 25 years Correlation Chart
The statistical analysis conducted on geographies consisting of 45,575,744 people shows a mild positive correlation between the proportion of Alaskan Athabascans and unemployment rate among youth under the age of 25 in the United States with a correlation coefficient (R) of 0.359 and weighted average of 12.2%. Similarly, the statistical analysis conducted on geographies consisting of 74,088,499 people shows a weak positive correlation between the proportion of Immigrants from North Macedonia and unemployment rate among youth under the age of 25 in the United States with a correlation coefficient (R) of 0.217 and weighted average of 10.7%, a difference of 14.5%.
Unemployment Among Youth under 25 years Correlation Summary
| Measurement | Alaskan Athabascan | Immigrants from North Macedonia |
| Minimum | 4.5% | 1.6% |
| Maximum | 100.0% | 25.1% |
| Range | 95.5% | 23.5% |
| Mean | 21.4% | 9.6% |
| Median | 13.1% | 10.0% |
| Interquartile 25% (IQ1) | 8.8% | 6.4% |
| Interquartile 75% (IQ3) | 23.8% | 12.3% |
| Interquartile Range (IQR) | 15.0% | 5.9% |
| Standard Deviation (Sample) | 22.3% | 4.9% |
| Standard Deviation (Population) | 22.0% | 4.8% |
Similar Demographics by Unemployment Among Youth under 25 years
Demographics Similar to Alaskan Athabascans by Unemployment Among Youth under 25 years
In terms of unemployment among youth under 25 years, the demographic groups most similar to Alaskan Athabascans are Immigrants from the Azores (12.2%, a difference of 0.0%), Spanish American (12.2%, a difference of 0.010%), Immigrants from Honduras (12.2%, a difference of 0.010%), Immigrants from Greece (12.2%, a difference of 0.12%), and Central American (12.2%, a difference of 0.14%).
| Demographics | Rating | Rank | Unemployment Among Youth under 25 years |
| Native Hawaiians | 1.3 /100 | #237 | Tragic 12.1% |
| Albanians | 1.2 /100 | #238 | Tragic 12.1% |
| Immigrants | Africa | 1.1 /100 | #239 | Tragic 12.1% |
| Dutch West Indians | 1.1 /100 | #240 | Tragic 12.1% |
| Immigrants | Albania | 1.1 /100 | #241 | Tragic 12.1% |
| Immigrants | Western Asia | 0.8 /100 | #242 | Tragic 12.2% |
| Immigrants | Azores | 0.6 /100 | #243 | Tragic 12.2% |
| Alaskan Athabascans | 0.6 /100 | #244 | Tragic 12.2% |
| Spanish Americans | 0.6 /100 | #245 | Tragic 12.2% |
| Immigrants | Honduras | 0.6 /100 | #246 | Tragic 12.2% |
| Immigrants | Greece | 0.6 /100 | #247 | Tragic 12.2% |
| Central Americans | 0.6 /100 | #248 | Tragic 12.2% |
| Soviet Union | 0.6 /100 | #249 | Tragic 12.2% |
| Delaware | 0.4 /100 | #250 | Tragic 12.3% |
| Mexican American Indians | 0.4 /100 | #251 | Tragic 12.3% |
Demographics Similar to Immigrants from North Macedonia by Unemployment Among Youth under 25 years
In terms of unemployment among youth under 25 years, the demographic groups most similar to Immigrants from North Macedonia are Finnish (10.7%, a difference of 0.0%), Immigrants from India (10.7%, a difference of 0.10%), Yugoslavian (10.7%, a difference of 0.11%), Somali (10.7%, a difference of 0.15%), and Immigrants from Bosnia and Herzegovina (10.6%, a difference of 0.24%).
| Demographics | Rating | Rank | Unemployment Among Youth under 25 years |
| Swiss | 100.0 /100 | #18 | Exceptional 10.6% |
| Immigrants | Burma/Myanmar | 100.0 /100 | #19 | Exceptional 10.6% |
| Dutch | 100.0 /100 | #20 | Exceptional 10.6% |
| Pennsylvania Germans | 100.0 /100 | #21 | Exceptional 10.6% |
| Belgians | 100.0 /100 | #22 | Exceptional 10.6% |
| Immigrants | Bosnia and Herzegovina | 100.0 /100 | #23 | Exceptional 10.6% |
| Finns | 100.0 /100 | #24 | Exceptional 10.7% |
| Immigrants | North Macedonia | 100.0 /100 | #25 | Exceptional 10.7% |
| Immigrants | India | 100.0 /100 | #26 | Exceptional 10.7% |
| Yugoslavians | 100.0 /100 | #27 | Exceptional 10.7% |
| Somalis | 100.0 /100 | #28 | Exceptional 10.7% |
| Chinese | 99.9 /100 | #29 | Exceptional 10.7% |
| Osage | 99.9 /100 | #30 | Exceptional 10.7% |
| Slovenes | 99.9 /100 | #31 | Exceptional 10.7% |
| Taiwanese | 99.9 /100 | #32 | Exceptional 10.8% |