Alaska Native vs Malaysian Disability
COMPARE
Alaska Native
Malaysian
Disability
Disability Comparison
Alaska Natives
Malaysians
13.2%
DISABILITY
0.0/ 100
METRIC RATING
298th/ 347
METRIC RANK
12.2%
DISABILITY
2.5/ 100
METRIC RATING
231st/ 347
METRIC RANK
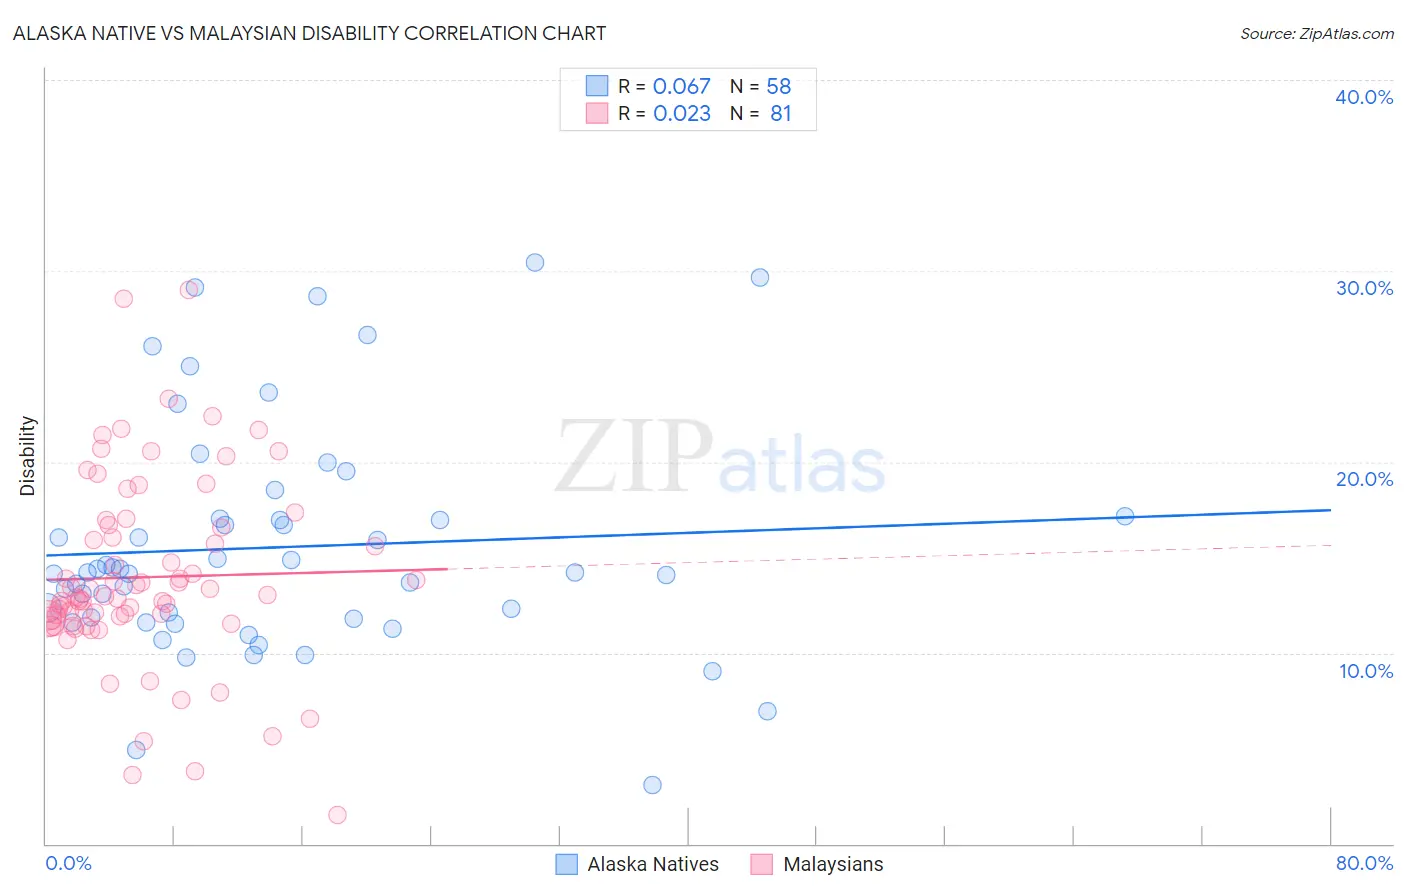
Alaska Native vs Malaysian Disability Correlation Chart
The statistical analysis conducted on geographies consisting of 76,775,228 people shows a slight positive correlation between the proportion of Alaska Natives and percentage of population with a disability in the United States with a correlation coefficient (R) of 0.067 and weighted average of 13.2%. Similarly, the statistical analysis conducted on geographies consisting of 226,067,054 people shows no correlation between the proportion of Malaysians and percentage of population with a disability in the United States with a correlation coefficient (R) of 0.023 and weighted average of 12.2%, a difference of 8.2%.
Disability Correlation Summary
| Measurement | Alaska Native | Malaysian |
| Minimum | 3.1% | 1.5% |
| Maximum | 30.4% | 29.0% |
| Range | 27.4% | 27.5% |
| Mean | 15.5% | 14.0% |
| Median | 14.2% | 12.9% |
| Interquartile 25% (IQ1) | 11.8% | 11.8% |
| Interquartile 75% (IQ3) | 17.0% | 16.6% |
| Interquartile Range (IQR) | 5.2% | 4.9% |
| Standard Deviation (Sample) | 6.0% | 5.0% |
| Standard Deviation (Population) | 5.9% | 4.9% |
Similar Demographics by Disability
Demographics Similar to Alaska Natives by Disability
In terms of disability, the demographic groups most similar to Alaska Natives are Hopi (13.2%, a difference of 0.010%), French (13.2%, a difference of 0.020%), Central American Indian (13.2%, a difference of 0.070%), Pennsylvania German (13.2%, a difference of 0.070%), and Nonimmigrants (13.2%, a difference of 0.11%).
| Demographics | Rating | Rank | Disability |
| Yaqui | 0.0 /100 | #291 | Tragic 13.1% |
| Aleuts | 0.0 /100 | #292 | Tragic 13.1% |
| Marshallese | 0.0 /100 | #293 | Tragic 13.1% |
| Celtics | 0.0 /100 | #294 | Tragic 13.1% |
| Immigrants | Nonimmigrants | 0.0 /100 | #295 | Tragic 13.2% |
| Central American Indians | 0.0 /100 | #296 | Tragic 13.2% |
| Hopi | 0.0 /100 | #297 | Tragic 13.2% |
| Alaska Natives | 0.0 /100 | #298 | Tragic 13.2% |
| French | 0.0 /100 | #299 | Tragic 13.2% |
| Pennsylvania Germans | 0.0 /100 | #300 | Tragic 13.2% |
| Immigrants | Micronesia | 0.0 /100 | #301 | Tragic 13.2% |
| Arapaho | 0.0 /100 | #302 | Tragic 13.2% |
| Scotch-Irish | 0.0 /100 | #303 | Tragic 13.3% |
| Yakama | 0.0 /100 | #304 | Tragic 13.4% |
| French Canadians | 0.0 /100 | #305 | Tragic 13.4% |
Demographics Similar to Malaysians by Disability
In terms of disability, the demographic groups most similar to Malaysians are Italian (12.2%, a difference of 0.010%), Samoan (12.2%, a difference of 0.030%), Bahamian (12.2%, a difference of 0.10%), Inupiat (12.2%, a difference of 0.11%), and West Indian (12.2%, a difference of 0.13%).
| Demographics | Rating | Rank | Disability |
| Mexicans | 3.7 /100 | #224 | Tragic 12.1% |
| Senegalese | 3.5 /100 | #225 | Tragic 12.1% |
| Jamaicans | 3.3 /100 | #226 | Tragic 12.1% |
| Alsatians | 3.3 /100 | #227 | Tragic 12.1% |
| West Indians | 2.9 /100 | #228 | Tragic 12.2% |
| Inupiat | 2.8 /100 | #229 | Tragic 12.2% |
| Samoans | 2.6 /100 | #230 | Tragic 12.2% |
| Malaysians | 2.5 /100 | #231 | Tragic 12.2% |
| Italians | 2.5 /100 | #232 | Tragic 12.2% |
| Bahamians | 2.3 /100 | #233 | Tragic 12.2% |
| Japanese | 2.3 /100 | #234 | Tragic 12.2% |
| Yup'ik | 2.2 /100 | #235 | Tragic 12.2% |
| Chinese | 2.0 /100 | #236 | Tragic 12.2% |
| Immigrants | Congo | 1.9 /100 | #237 | Tragic 12.2% |
| Norwegians | 1.9 /100 | #238 | Tragic 12.2% |