Alaska Native vs German Disability
COMPARE
Alaska Native
German
Disability
Disability Comparison
Alaska Natives
Germans
13.2%
DISABILITY
0.0/ 100
METRIC RATING
298th/ 347
METRIC RANK
12.8%
DISABILITY
0.0/ 100
METRIC RATING
278th/ 347
METRIC RANK
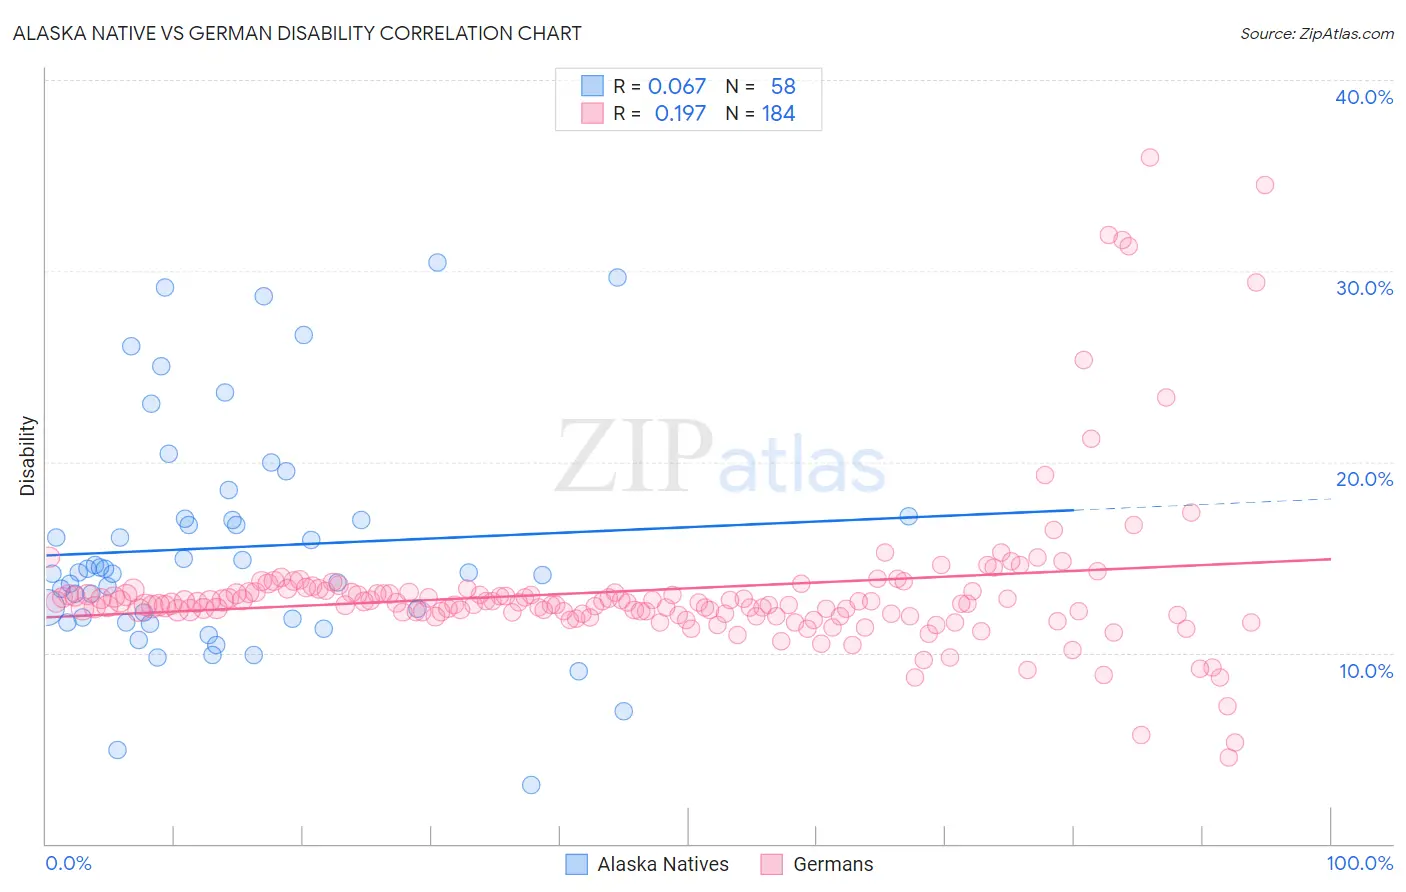
Alaska Native vs German Disability Correlation Chart
The statistical analysis conducted on geographies consisting of 76,775,228 people shows a slight positive correlation between the proportion of Alaska Natives and percentage of population with a disability in the United States with a correlation coefficient (R) of 0.067 and weighted average of 13.2%. Similarly, the statistical analysis conducted on geographies consisting of 581,054,962 people shows a poor positive correlation between the proportion of Germans and percentage of population with a disability in the United States with a correlation coefficient (R) of 0.197 and weighted average of 12.8%, a difference of 2.7%.
Disability Correlation Summary
| Measurement | Alaska Native | German |
| Minimum | 3.1% | 4.5% |
| Maximum | 30.4% | 35.9% |
| Range | 27.4% | 31.4% |
| Mean | 15.5% | 13.3% |
| Median | 14.2% | 12.6% |
| Interquartile 25% (IQ1) | 11.8% | 12.0% |
| Interquartile 75% (IQ3) | 17.0% | 13.2% |
| Interquartile Range (IQR) | 5.2% | 1.2% |
| Standard Deviation (Sample) | 6.0% | 4.2% |
| Standard Deviation (Population) | 5.9% | 4.2% |
Demographics Similar to Alaska Natives and Germans by Disability
In terms of disability, the demographic groups most similar to Alaska Natives are Hopi (13.2%, a difference of 0.010%), Central American Indian (13.2%, a difference of 0.070%), Nonimmigrants (13.2%, a difference of 0.11%), Celtic (13.1%, a difference of 0.23%), and Aleut (13.1%, a difference of 0.53%). Similarly, the demographic groups most similar to Germans are Fijian (12.8%, a difference of 0.090%), Spanish (12.8%, a difference of 0.15%), Immigrants from Portugal (12.9%, a difference of 0.29%), Scottish (12.9%, a difference of 0.43%), and Irish (12.9%, a difference of 0.45%).
| Demographics | Rating | Rank | Disability |
| Germans | 0.0 /100 | #278 | Tragic 12.8% |
| Fijians | 0.0 /100 | #279 | Tragic 12.8% |
| Spanish | 0.0 /100 | #280 | Tragic 12.8% |
| Immigrants | Portugal | 0.0 /100 | #281 | Tragic 12.9% |
| Scottish | 0.0 /100 | #282 | Tragic 12.9% |
| Irish | 0.0 /100 | #283 | Tragic 12.9% |
| Welsh | 0.0 /100 | #284 | Tragic 12.9% |
| Crow | 0.0 /100 | #285 | Tragic 12.9% |
| English | 0.0 /100 | #286 | Tragic 13.0% |
| Africans | 0.0 /100 | #287 | Tragic 13.0% |
| Whites/Caucasians | 0.0 /100 | #288 | Tragic 13.0% |
| Slovaks | 0.0 /100 | #289 | Tragic 13.0% |
| Cheyenne | 0.0 /100 | #290 | Tragic 13.0% |
| Yaqui | 0.0 /100 | #291 | Tragic 13.1% |
| Aleuts | 0.0 /100 | #292 | Tragic 13.1% |
| Marshallese | 0.0 /100 | #293 | Tragic 13.1% |
| Celtics | 0.0 /100 | #294 | Tragic 13.1% |
| Immigrants | Nonimmigrants | 0.0 /100 | #295 | Tragic 13.2% |
| Central American Indians | 0.0 /100 | #296 | Tragic 13.2% |
| Hopi | 0.0 /100 | #297 | Tragic 13.2% |
| Alaska Natives | 0.0 /100 | #298 | Tragic 13.2% |