Alaska Native vs Malaysian Median Household Income
COMPARE
Alaska Native
Malaysian
Median Household Income
Median Household Income Comparison
Alaska Natives
Malaysians
$79,509
MEDIAN HOUSEHOLD INCOME
2.7/ 100
METRIC RATING
239th/ 347
METRIC RANK
$81,064
MEDIAN HOUSEHOLD INCOME
7.0/ 100
METRIC RATING
224th/ 347
METRIC RANK
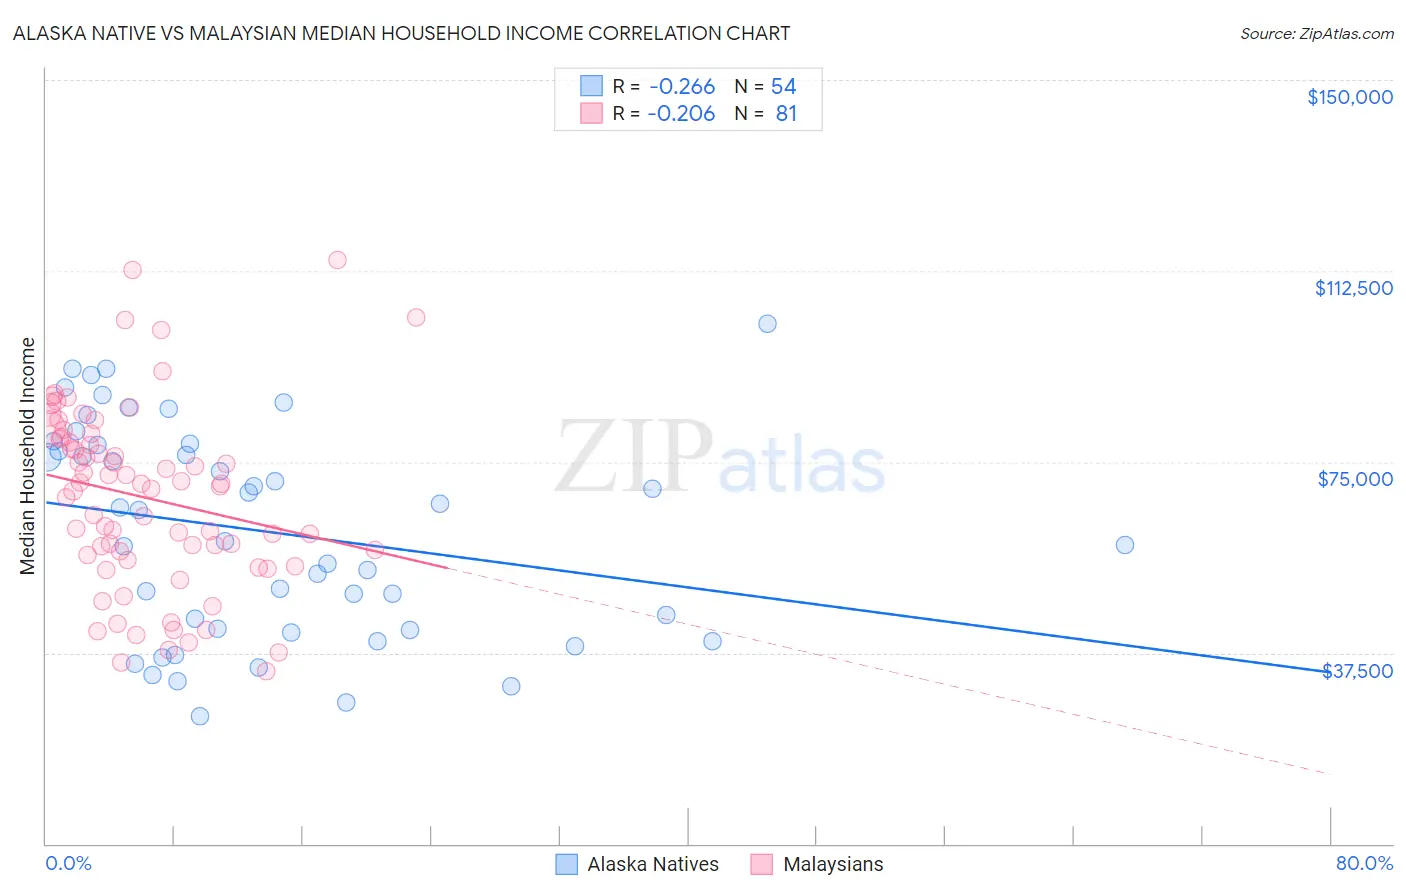
Alaska Native vs Malaysian Median Household Income Correlation Chart
The statistical analysis conducted on geographies consisting of 76,748,502 people shows a weak negative correlation between the proportion of Alaska Natives and median household income in the United States with a correlation coefficient (R) of -0.266 and weighted average of $79,509. Similarly, the statistical analysis conducted on geographies consisting of 225,962,750 people shows a weak negative correlation between the proportion of Malaysians and median household income in the United States with a correlation coefficient (R) of -0.206 and weighted average of $81,064, a difference of 2.0%.
Median Household Income Correlation Summary
| Measurement | Alaska Native | Malaysian |
| Minimum | $25,000 | $33,804 |
| Maximum | $102,083 | $114,680 |
| Range | $77,083 | $80,876 |
| Mean | $61,313 | $68,008 |
| Median | $62,466 | $70,094 |
| Interquartile 25% (IQ1) | $41,964 | $56,150 |
| Interquartile 75% (IQ3) | $78,336 | $79,730 |
| Interquartile Range (IQR) | $36,372 | $23,581 |
| Standard Deviation (Sample) | $20,803 | $17,902 |
| Standard Deviation (Population) | $20,609 | $17,791 |
Demographics Similar to Alaska Natives and Malaysians by Median Household Income
In terms of median household income, the demographic groups most similar to Alaska Natives are Immigrants from Western Africa ($79,490, a difference of 0.020%), Nonimmigrants ($79,429, a difference of 0.10%), Barbadian ($79,664, a difference of 0.20%), Nicaraguan ($79,737, a difference of 0.29%), and Immigrants from Bosnia and Herzegovina ($79,888, a difference of 0.48%). Similarly, the demographic groups most similar to Malaysians are Scotch-Irish ($80,972, a difference of 0.11%), Immigrants from El Salvador ($81,213, a difference of 0.18%), Immigrants from Nigeria ($81,236, a difference of 0.21%), Immigrants from Panama ($80,873, a difference of 0.24%), and Guyanese ($80,734, a difference of 0.41%).
| Demographics | Rating | Rank | Median Household Income |
| Immigrants | Ghana | 9.0 /100 | #221 | Tragic $81,489 |
| Immigrants | Nigeria | 7.7 /100 | #222 | Tragic $81,236 |
| Immigrants | El Salvador | 7.6 /100 | #223 | Tragic $81,213 |
| Malaysians | 7.0 /100 | #224 | Tragic $81,064 |
| Scotch-Irish | 6.6 /100 | #225 | Tragic $80,972 |
| Immigrants | Panama | 6.2 /100 | #226 | Tragic $80,873 |
| Guyanese | 5.7 /100 | #227 | Tragic $80,734 |
| Immigrants | Bangladesh | 5.7 /100 | #228 | Tragic $80,722 |
| Delaware | 5.0 /100 | #229 | Tragic $80,527 |
| Bermudans | 4.7 /100 | #230 | Tragic $80,406 |
| Trinidadians and Tobagonians | 4.7 /100 | #231 | Tragic $80,402 |
| Immigrants | Trinidad and Tobago | 4.6 /100 | #232 | Tragic $80,373 |
| Immigrants | Azores | 4.5 /100 | #233 | Tragic $80,357 |
| Immigrants | Ecuador | 4.5 /100 | #234 | Tragic $80,341 |
| Immigrants | Guyana | 4.5 /100 | #235 | Tragic $80,324 |
| Immigrants | Bosnia and Herzegovina | 3.4 /100 | #236 | Tragic $79,888 |
| Nicaraguans | 3.1 /100 | #237 | Tragic $79,737 |
| Barbadians | 3.0 /100 | #238 | Tragic $79,664 |
| Alaska Natives | 2.7 /100 | #239 | Tragic $79,509 |
| Immigrants | Western Africa | 2.7 /100 | #240 | Tragic $79,490 |
| Immigrants | Nonimmigrants | 2.6 /100 | #241 | Tragic $79,429 |