Alaska Native vs Native/Alaskan Disability
COMPARE
Alaska Native
Native/Alaskan
Disability
Disability Comparison
Alaska Natives
Natives/Alaskans
13.2%
DISABILITY
0.0/ 100
METRIC RATING
298th/ 347
METRIC RANK
14.2%
DISABILITY
0.0/ 100
METRIC RATING
325th/ 347
METRIC RANK
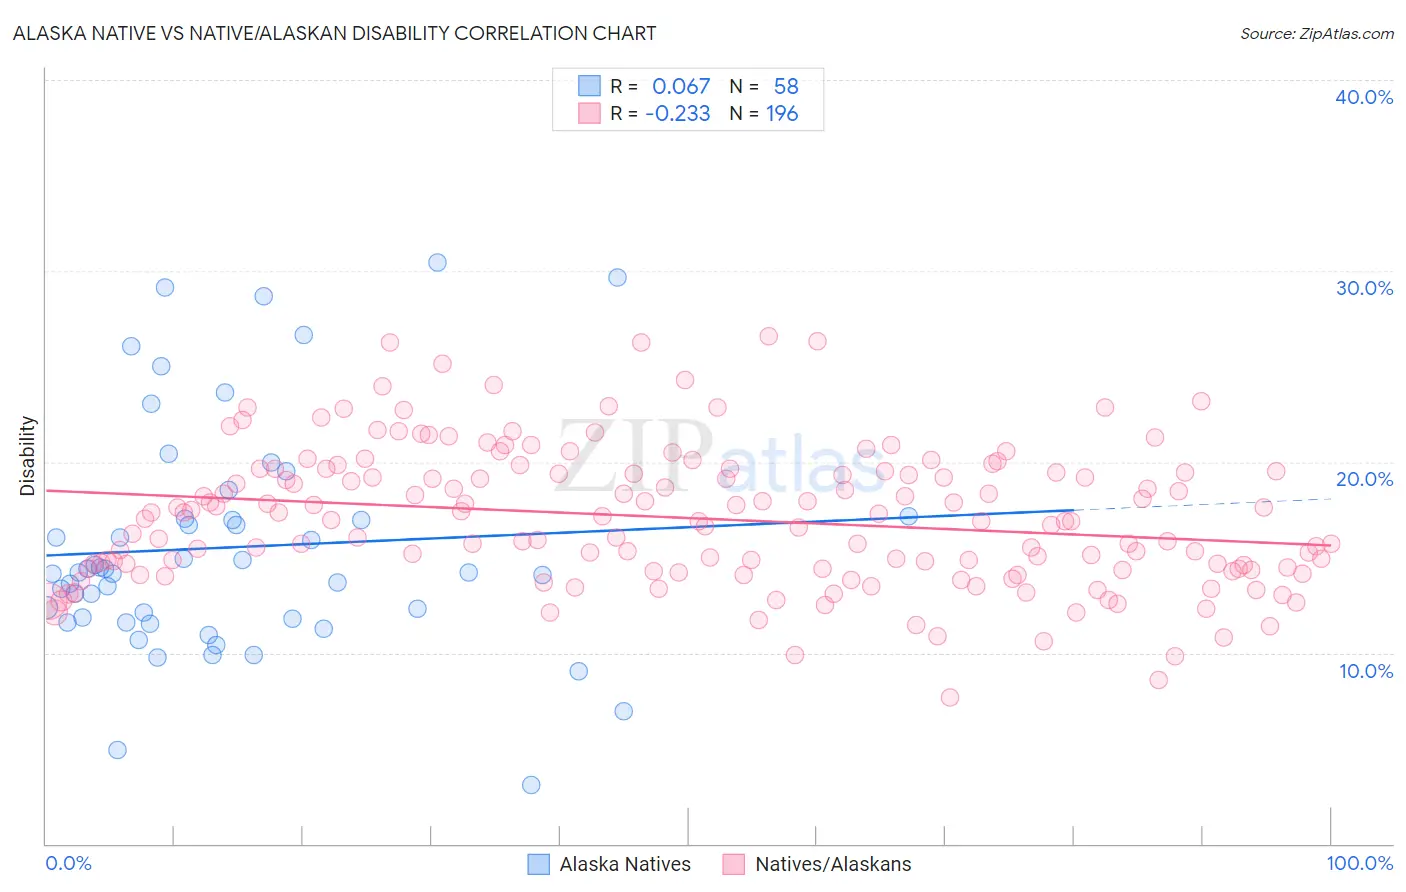
Alaska Native vs Native/Alaskan Disability Correlation Chart
The statistical analysis conducted on geographies consisting of 76,775,228 people shows a slight positive correlation between the proportion of Alaska Natives and percentage of population with a disability in the United States with a correlation coefficient (R) of 0.067 and weighted average of 13.2%. Similarly, the statistical analysis conducted on geographies consisting of 512,916,136 people shows a weak negative correlation between the proportion of Natives/Alaskans and percentage of population with a disability in the United States with a correlation coefficient (R) of -0.233 and weighted average of 14.2%, a difference of 7.5%.
Disability Correlation Summary
| Measurement | Alaska Native | Native/Alaskan |
| Minimum | 3.1% | 7.6% |
| Maximum | 30.4% | 26.5% |
| Range | 27.4% | 18.9% |
| Mean | 15.5% | 17.1% |
| Median | 14.2% | 16.9% |
| Interquartile 25% (IQ1) | 11.8% | 14.4% |
| Interquartile 75% (IQ3) | 17.0% | 19.5% |
| Interquartile Range (IQR) | 5.2% | 5.1% |
| Standard Deviation (Sample) | 6.0% | 3.6% |
| Standard Deviation (Population) | 5.9% | 3.6% |
Similar Demographics by Disability
Demographics Similar to Alaska Natives by Disability
In terms of disability, the demographic groups most similar to Alaska Natives are Hopi (13.2%, a difference of 0.010%), French (13.2%, a difference of 0.020%), Central American Indian (13.2%, a difference of 0.070%), Pennsylvania German (13.2%, a difference of 0.070%), and Nonimmigrants (13.2%, a difference of 0.11%).
| Demographics | Rating | Rank | Disability |
| Yaqui | 0.0 /100 | #291 | Tragic 13.1% |
| Aleuts | 0.0 /100 | #292 | Tragic 13.1% |
| Marshallese | 0.0 /100 | #293 | Tragic 13.1% |
| Celtics | 0.0 /100 | #294 | Tragic 13.1% |
| Immigrants | Nonimmigrants | 0.0 /100 | #295 | Tragic 13.2% |
| Central American Indians | 0.0 /100 | #296 | Tragic 13.2% |
| Hopi | 0.0 /100 | #297 | Tragic 13.2% |
| Alaska Natives | 0.0 /100 | #298 | Tragic 13.2% |
| French | 0.0 /100 | #299 | Tragic 13.2% |
| Pennsylvania Germans | 0.0 /100 | #300 | Tragic 13.2% |
| Immigrants | Micronesia | 0.0 /100 | #301 | Tragic 13.2% |
| Arapaho | 0.0 /100 | #302 | Tragic 13.2% |
| Scotch-Irish | 0.0 /100 | #303 | Tragic 13.3% |
| Yakama | 0.0 /100 | #304 | Tragic 13.4% |
| French Canadians | 0.0 /100 | #305 | Tragic 13.4% |
Demographics Similar to Natives/Alaskans by Disability
In terms of disability, the demographic groups most similar to Natives/Alaskans are Osage (14.2%, a difference of 0.030%), Chippewa (14.1%, a difference of 0.050%), Ottawa (14.2%, a difference of 0.060%), Immigrants from the Azores (14.2%, a difference of 0.060%), and Potawatomi (14.2%, a difference of 0.17%).
| Demographics | Rating | Rank | Disability |
| Menominee | 0.0 /100 | #318 | Tragic 13.8% |
| Iroquois | 0.0 /100 | #319 | Tragic 13.8% |
| Apache | 0.0 /100 | #320 | Tragic 13.9% |
| Paiute | 0.0 /100 | #321 | Tragic 13.9% |
| Americans | 0.0 /100 | #322 | Tragic 13.9% |
| Comanche | 0.0 /100 | #323 | Tragic 14.1% |
| Chippewa | 0.0 /100 | #324 | Tragic 14.1% |
| Natives/Alaskans | 0.0 /100 | #325 | Tragic 14.2% |
| Osage | 0.0 /100 | #326 | Tragic 14.2% |
| Ottawa | 0.0 /100 | #327 | Tragic 14.2% |
| Immigrants | Azores | 0.0 /100 | #328 | Tragic 14.2% |
| Potawatomi | 0.0 /100 | #329 | Tragic 14.2% |
| Navajo | 0.0 /100 | #330 | Tragic 14.3% |
| Alaskan Athabascans | 0.0 /100 | #331 | Tragic 14.4% |
| Pueblo | 0.0 /100 | #332 | Tragic 14.4% |