Maltese vs Malaysian Disability
COMPARE
Maltese
Malaysian
Disability
Disability Comparison
Maltese
Malaysians
11.7%
DISABILITY
50.6/ 100
METRIC RATING
173rd/ 347
METRIC RANK
12.2%
DISABILITY
2.5/ 100
METRIC RATING
231st/ 347
METRIC RANK
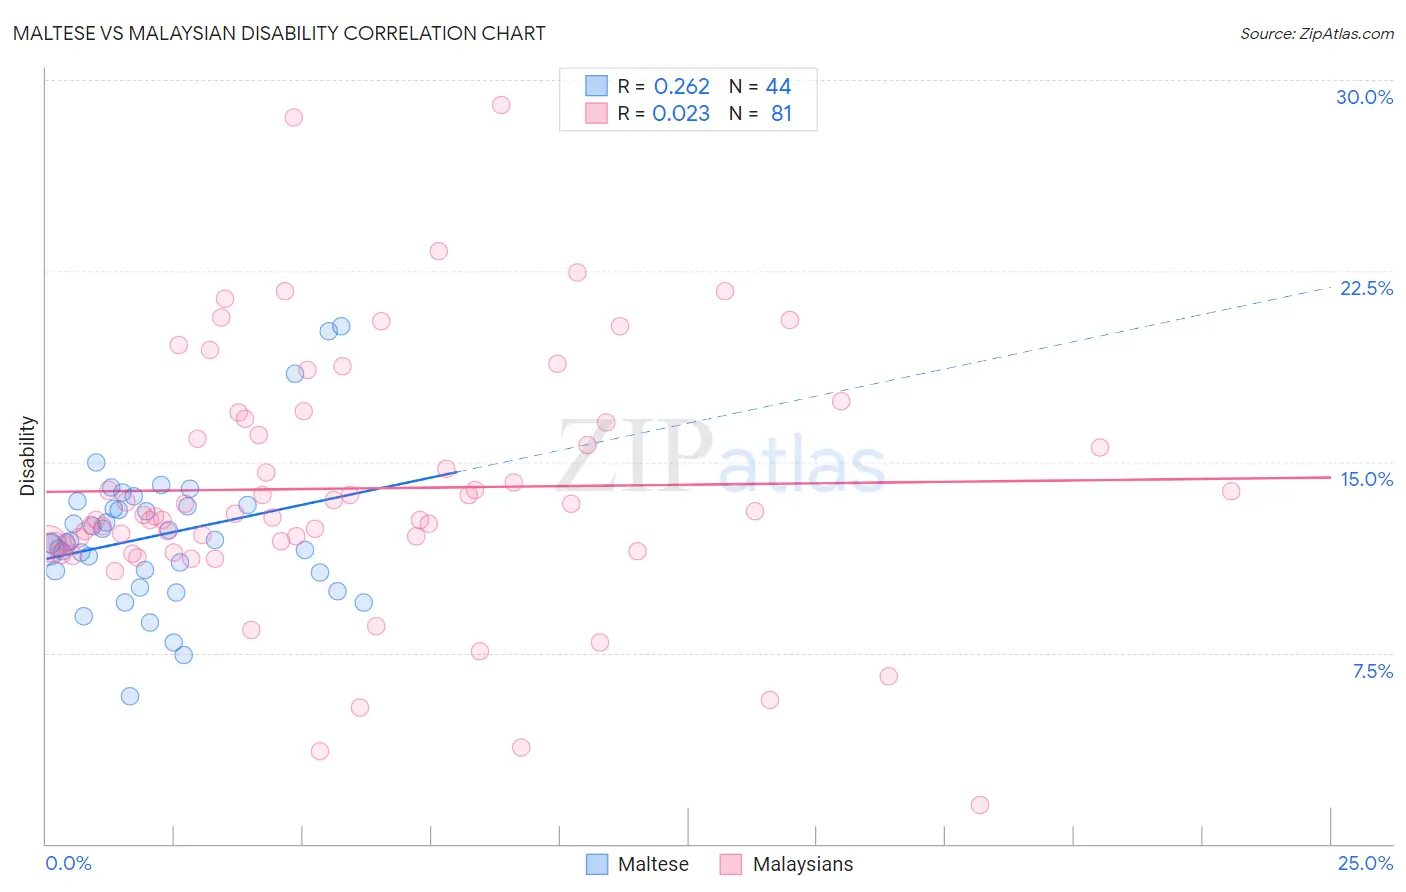
Maltese vs Malaysian Disability Correlation Chart
The statistical analysis conducted on geographies consisting of 126,476,999 people shows a weak positive correlation between the proportion of Maltese and percentage of population with a disability in the United States with a correlation coefficient (R) of 0.262 and weighted average of 11.7%. Similarly, the statistical analysis conducted on geographies consisting of 226,067,054 people shows no correlation between the proportion of Malaysians and percentage of population with a disability in the United States with a correlation coefficient (R) of 0.023 and weighted average of 12.2%, a difference of 4.1%.
Disability Correlation Summary
| Measurement | Maltese | Malaysian |
| Minimum | 5.8% | 1.5% |
| Maximum | 20.3% | 29.0% |
| Range | 14.5% | 27.5% |
| Mean | 12.1% | 14.0% |
| Median | 11.8% | 12.9% |
| Interquartile 25% (IQ1) | 10.7% | 11.8% |
| Interquartile 75% (IQ3) | 13.3% | 16.6% |
| Interquartile Range (IQR) | 2.6% | 4.9% |
| Standard Deviation (Sample) | 2.8% | 5.0% |
| Standard Deviation (Population) | 2.8% | 4.9% |
Similar Demographics by Disability
Demographics Similar to Maltese by Disability
In terms of disability, the demographic groups most similar to Maltese are Albanian (11.7%, a difference of 0.030%), Trinidadian and Tobagonian (11.7%, a difference of 0.090%), Haitian (11.7%, a difference of 0.090%), Immigrants from Albania (11.7%, a difference of 0.10%), and Immigrants from Southern Europe (11.7%, a difference of 0.10%).
| Demographics | Rating | Rank | Disability |
| Pakistanis | 54.7 /100 | #166 | Average 11.7% |
| Estonians | 54.4 /100 | #167 | Average 11.7% |
| Immigrants | Latin America | 54.1 /100 | #168 | Average 11.7% |
| Immigrants | Austria | 53.4 /100 | #169 | Average 11.7% |
| Immigrants | Albania | 52.8 /100 | #170 | Average 11.7% |
| Immigrants | Southern Europe | 52.8 /100 | #171 | Average 11.7% |
| Trinidadians and Tobagonians | 52.7 /100 | #172 | Average 11.7% |
| Maltese | 50.6 /100 | #173 | Average 11.7% |
| Albanians | 50.0 /100 | #174 | Average 11.7% |
| Haitians | 48.6 /100 | #175 | Average 11.7% |
| Immigrants | Western Africa | 47.5 /100 | #176 | Average 11.7% |
| Immigrants | Central America | 46.6 /100 | #177 | Average 11.7% |
| Greeks | 46.2 /100 | #178 | Average 11.7% |
| Immigrants | Armenia | 41.9 /100 | #179 | Average 11.7% |
| Immigrants | Honduras | 37.8 /100 | #180 | Fair 11.8% |
Demographics Similar to Malaysians by Disability
In terms of disability, the demographic groups most similar to Malaysians are Italian (12.2%, a difference of 0.010%), Samoan (12.2%, a difference of 0.030%), Bahamian (12.2%, a difference of 0.10%), Inupiat (12.2%, a difference of 0.11%), and West Indian (12.2%, a difference of 0.13%).
| Demographics | Rating | Rank | Disability |
| Mexicans | 3.7 /100 | #224 | Tragic 12.1% |
| Senegalese | 3.5 /100 | #225 | Tragic 12.1% |
| Jamaicans | 3.3 /100 | #226 | Tragic 12.1% |
| Alsatians | 3.3 /100 | #227 | Tragic 12.1% |
| West Indians | 2.9 /100 | #228 | Tragic 12.2% |
| Inupiat | 2.8 /100 | #229 | Tragic 12.2% |
| Samoans | 2.6 /100 | #230 | Tragic 12.2% |
| Malaysians | 2.5 /100 | #231 | Tragic 12.2% |
| Italians | 2.5 /100 | #232 | Tragic 12.2% |
| Bahamians | 2.3 /100 | #233 | Tragic 12.2% |
| Japanese | 2.3 /100 | #234 | Tragic 12.2% |
| Yup'ik | 2.2 /100 | #235 | Tragic 12.2% |
| Chinese | 2.0 /100 | #236 | Tragic 12.2% |
| Immigrants | Congo | 1.9 /100 | #237 | Tragic 12.2% |
| Norwegians | 1.9 /100 | #238 | Tragic 12.2% |