Immigrants from Laos vs Malaysian Disability
COMPARE
Immigrants from Laos
Malaysian
Disability
Disability Comparison
Immigrants from Laos
Malaysians
12.4%
DISABILITY
0.5/ 100
METRIC RATING
257th/ 347
METRIC RANK
12.2%
DISABILITY
2.5/ 100
METRIC RATING
231st/ 347
METRIC RANK
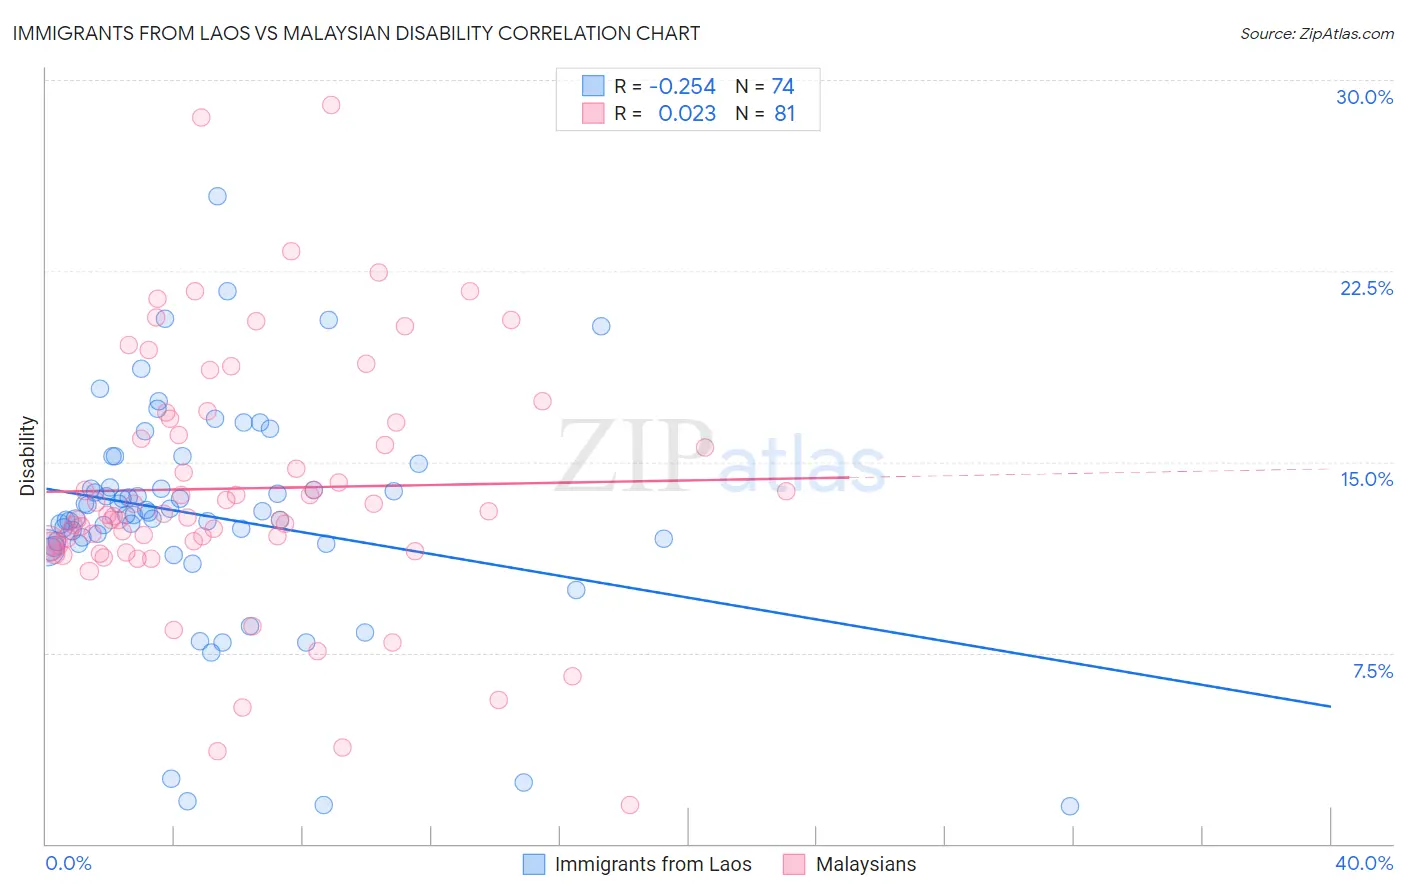
Immigrants from Laos vs Malaysian Disability Correlation Chart
The statistical analysis conducted on geographies consisting of 201,466,628 people shows a weak negative correlation between the proportion of Immigrants from Laos and percentage of population with a disability in the United States with a correlation coefficient (R) of -0.254 and weighted average of 12.4%. Similarly, the statistical analysis conducted on geographies consisting of 226,067,054 people shows no correlation between the proportion of Malaysians and percentage of population with a disability in the United States with a correlation coefficient (R) of 0.023 and weighted average of 12.2%, a difference of 1.7%.
Disability Correlation Summary
| Measurement | Immigrants from Laos | Malaysian |
| Minimum | 1.4% | 1.5% |
| Maximum | 25.4% | 29.0% |
| Range | 24.0% | 27.5% |
| Mean | 12.9% | 14.0% |
| Median | 13.0% | 12.9% |
| Interquartile 25% (IQ1) | 11.8% | 11.8% |
| Interquartile 75% (IQ3) | 14.0% | 16.6% |
| Interquartile Range (IQR) | 2.2% | 4.9% |
| Standard Deviation (Sample) | 4.3% | 5.0% |
| Standard Deviation (Population) | 4.3% | 4.9% |
Similar Demographics by Disability
Demographics Similar to Immigrants from Laos by Disability
In terms of disability, the demographic groups most similar to Immigrants from Laos are Immigrants from Dominica (12.4%, a difference of 0.090%), Slavic (12.4%, a difference of 0.14%), Slovene (12.4%, a difference of 0.16%), Canadian (12.4%, a difference of 0.20%), and Immigrants from Liberia (12.4%, a difference of 0.23%).
| Demographics | Rating | Rank | Disability |
| Sub-Saharan Africans | 1.4 /100 | #250 | Tragic 12.3% |
| Europeans | 1.4 /100 | #251 | Tragic 12.3% |
| Bermudans | 1.1 /100 | #252 | Tragic 12.3% |
| Belgians | 0.8 /100 | #253 | Tragic 12.3% |
| German Russians | 0.8 /100 | #254 | Tragic 12.3% |
| Slovenes | 0.6 /100 | #255 | Tragic 12.4% |
| Immigrants | Dominica | 0.6 /100 | #256 | Tragic 12.4% |
| Immigrants | Laos | 0.5 /100 | #257 | Tragic 12.4% |
| Slavs | 0.5 /100 | #258 | Tragic 12.4% |
| Canadians | 0.4 /100 | #259 | Tragic 12.4% |
| Immigrants | Liberia | 0.4 /100 | #260 | Tragic 12.4% |
| Scandinavians | 0.4 /100 | #261 | Tragic 12.4% |
| Native Hawaiians | 0.3 /100 | #262 | Tragic 12.5% |
| Hawaiians | 0.2 /100 | #263 | Tragic 12.5% |
| Immigrants | Germany | 0.2 /100 | #264 | Tragic 12.5% |
Demographics Similar to Malaysians by Disability
In terms of disability, the demographic groups most similar to Malaysians are Italian (12.2%, a difference of 0.010%), Samoan (12.2%, a difference of 0.030%), Bahamian (12.2%, a difference of 0.10%), Inupiat (12.2%, a difference of 0.11%), and West Indian (12.2%, a difference of 0.13%).
| Demographics | Rating | Rank | Disability |
| Mexicans | 3.7 /100 | #224 | Tragic 12.1% |
| Senegalese | 3.5 /100 | #225 | Tragic 12.1% |
| Jamaicans | 3.3 /100 | #226 | Tragic 12.1% |
| Alsatians | 3.3 /100 | #227 | Tragic 12.1% |
| West Indians | 2.9 /100 | #228 | Tragic 12.2% |
| Inupiat | 2.8 /100 | #229 | Tragic 12.2% |
| Samoans | 2.6 /100 | #230 | Tragic 12.2% |
| Malaysians | 2.5 /100 | #231 | Tragic 12.2% |
| Italians | 2.5 /100 | #232 | Tragic 12.2% |
| Bahamians | 2.3 /100 | #233 | Tragic 12.2% |
| Japanese | 2.3 /100 | #234 | Tragic 12.2% |
| Yup'ik | 2.2 /100 | #235 | Tragic 12.2% |
| Chinese | 2.0 /100 | #236 | Tragic 12.2% |
| Immigrants | Congo | 1.9 /100 | #237 | Tragic 12.2% |
| Norwegians | 1.9 /100 | #238 | Tragic 12.2% |