African vs Cape Verdean Disability Age 5 to 17
COMPARE
African
Cape Verdean
Disability Age 5 to 17
Disability Age 5 to 17 Comparison
Africans
Cape Verdeans
6.5%
DISABILITY AGE 5 TO 17
0.0/ 100
METRIC RATING
320th/ 347
METRIC RANK
7.0%
DISABILITY AGE 5 TO 17
0.0/ 100
METRIC RATING
341st/ 347
METRIC RANK
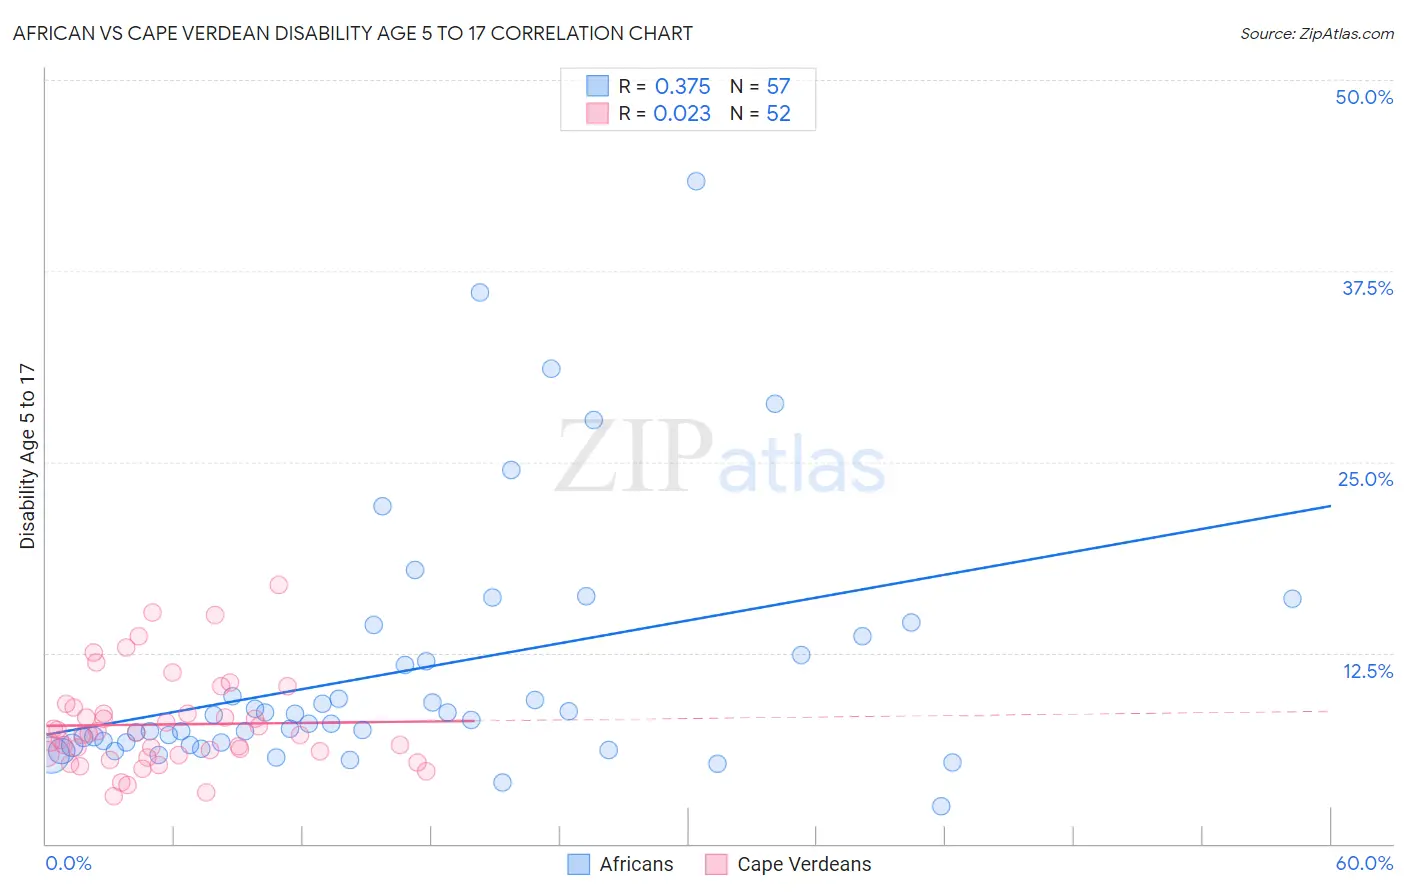
African vs Cape Verdean Disability Age 5 to 17 Correlation Chart
The statistical analysis conducted on geographies consisting of 465,699,763 people shows a mild positive correlation between the proportion of Africans and percentage of population with a disability between the ages 5 and 17 in the United States with a correlation coefficient (R) of 0.375 and weighted average of 6.5%. Similarly, the statistical analysis conducted on geographies consisting of 107,309,150 people shows no correlation between the proportion of Cape Verdeans and percentage of population with a disability between the ages 5 and 17 in the United States with a correlation coefficient (R) of 0.023 and weighted average of 7.0%, a difference of 7.3%.
Disability Age 5 to 17 Correlation Summary
| Measurement | African | Cape Verdean |
| Minimum | 2.5% | 3.1% |
| Maximum | 43.3% | 17.0% |
| Range | 40.9% | 13.8% |
| Mean | 11.3% | 7.8% |
| Median | 8.1% | 7.2% |
| Interquartile 25% (IQ1) | 6.5% | 5.8% |
| Interquartile 75% (IQ3) | 13.0% | 8.7% |
| Interquartile Range (IQR) | 6.5% | 2.9% |
| Standard Deviation (Sample) | 8.3% | 3.1% |
| Standard Deviation (Population) | 8.2% | 3.0% |
Similar Demographics by Disability Age 5 to 17
Demographics Similar to Africans by Disability Age 5 to 17
In terms of disability age 5 to 17, the demographic groups most similar to Africans are Delaware (6.5%, a difference of 0.19%), Tohono O'odham (6.5%, a difference of 0.35%), Slovak (6.5%, a difference of 0.36%), Osage (6.5%, a difference of 0.40%), and Dominican (6.5%, a difference of 0.48%).
| Demographics | Rating | Rank | Disability Age 5 to 17 |
| Apache | 0.0 /100 | #313 | Tragic 6.4% |
| French | 0.0 /100 | #314 | Tragic 6.4% |
| Immigrants | Portugal | 0.0 /100 | #315 | Tragic 6.4% |
| Immigrants | Dominican Republic | 0.0 /100 | #316 | Tragic 6.4% |
| Kiowa | 0.0 /100 | #317 | Tragic 6.4% |
| Comanche | 0.0 /100 | #318 | Tragic 6.4% |
| Delaware | 0.0 /100 | #319 | Tragic 6.5% |
| Africans | 0.0 /100 | #320 | Tragic 6.5% |
| Tohono O'odham | 0.0 /100 | #321 | Tragic 6.5% |
| Slovaks | 0.0 /100 | #322 | Tragic 6.5% |
| Osage | 0.0 /100 | #323 | Tragic 6.5% |
| Dominicans | 0.0 /100 | #324 | Tragic 6.5% |
| Americans | 0.0 /100 | #325 | Tragic 6.5% |
| Potawatomi | 0.0 /100 | #326 | Tragic 6.5% |
| French American Indians | 0.0 /100 | #327 | Tragic 6.6% |
Demographics Similar to Cape Verdeans by Disability Age 5 to 17
In terms of disability age 5 to 17, the demographic groups most similar to Cape Verdeans are Cherokee (6.9%, a difference of 0.54%), Choctaw (6.9%, a difference of 0.80%), Iroquois (6.9%, a difference of 1.1%), Creek (6.9%, a difference of 1.4%), and Chickasaw (6.8%, a difference of 1.8%).
| Demographics | Rating | Rank | Disability Age 5 to 17 |
| Blacks/African Americans | 0.0 /100 | #333 | Tragic 6.8% |
| Seminole | 0.0 /100 | #334 | Tragic 6.8% |
| Ottawa | 0.0 /100 | #335 | Tragic 6.8% |
| Chickasaw | 0.0 /100 | #336 | Tragic 6.8% |
| Creek | 0.0 /100 | #337 | Tragic 6.9% |
| Iroquois | 0.0 /100 | #338 | Tragic 6.9% |
| Choctaw | 0.0 /100 | #339 | Tragic 6.9% |
| Cherokee | 0.0 /100 | #340 | Tragic 6.9% |
| Cape Verdeans | 0.0 /100 | #341 | Tragic 7.0% |
| Chippewa | 0.0 /100 | #342 | Tragic 7.1% |
| Immigrants | Cabo Verde | 0.0 /100 | #343 | Tragic 7.1% |
| Cajuns | 0.0 /100 | #344 | Tragic 7.2% |
| Tsimshian | 0.0 /100 | #345 | Tragic 7.9% |
| Puerto Ricans | 0.0 /100 | #346 | Tragic 8.3% |
| Houma | 0.0 /100 | #347 | Tragic 9.1% |