African vs Immigrants from Peru Disability Age 5 to 17
COMPARE
African
Immigrants from Peru
Disability Age 5 to 17
Disability Age 5 to 17 Comparison
Africans
Immigrants from Peru
6.5%
DISABILITY AGE 5 TO 17
0.0/ 100
METRIC RATING
320th/ 347
METRIC RANK
5.3%
DISABILITY AGE 5 TO 17
99.1/ 100
METRIC RATING
93rd/ 347
METRIC RANK
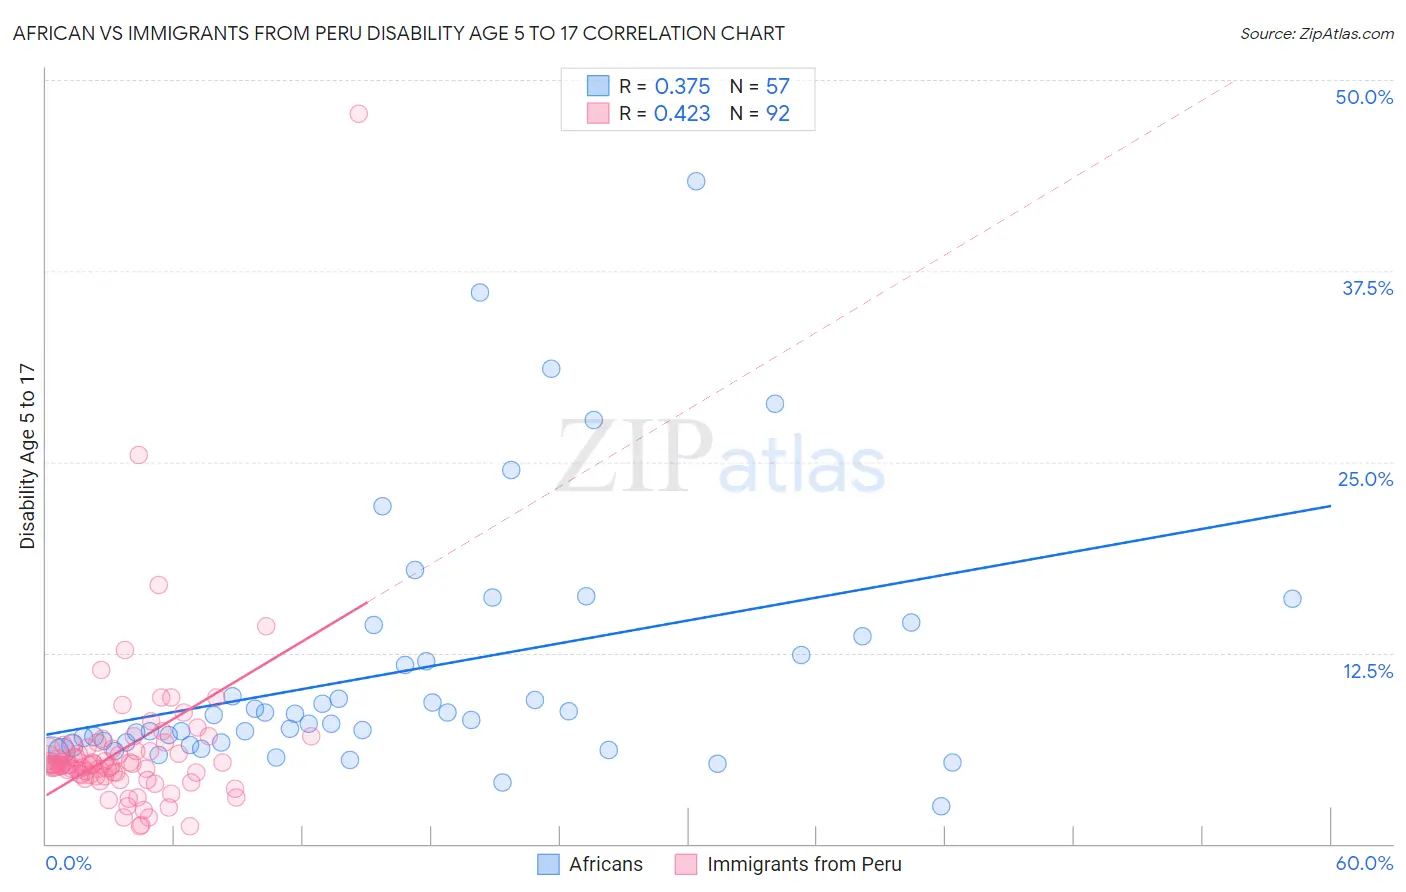
African vs Immigrants from Peru Disability Age 5 to 17 Correlation Chart
The statistical analysis conducted on geographies consisting of 465,699,763 people shows a mild positive correlation between the proportion of Africans and percentage of population with a disability between the ages 5 and 17 in the United States with a correlation coefficient (R) of 0.375 and weighted average of 6.5%. Similarly, the statistical analysis conducted on geographies consisting of 326,866,883 people shows a moderate positive correlation between the proportion of Immigrants from Peru and percentage of population with a disability between the ages 5 and 17 in the United States with a correlation coefficient (R) of 0.423 and weighted average of 5.3%, a difference of 23.2%.
Disability Age 5 to 17 Correlation Summary
| Measurement | African | Immigrants from Peru |
| Minimum | 2.5% | 1.2% |
| Maximum | 43.3% | 47.8% |
| Range | 40.9% | 46.7% |
| Mean | 11.3% | 6.2% |
| Median | 8.1% | 5.1% |
| Interquartile 25% (IQ1) | 6.5% | 4.5% |
| Interquartile 75% (IQ3) | 13.0% | 6.3% |
| Interquartile Range (IQR) | 6.5% | 1.8% |
| Standard Deviation (Sample) | 8.3% | 5.5% |
| Standard Deviation (Population) | 8.2% | 5.4% |
Similar Demographics by Disability Age 5 to 17
Demographics Similar to Africans by Disability Age 5 to 17
In terms of disability age 5 to 17, the demographic groups most similar to Africans are Delaware (6.5%, a difference of 0.19%), Tohono O'odham (6.5%, a difference of 0.35%), Slovak (6.5%, a difference of 0.36%), Osage (6.5%, a difference of 0.40%), and Dominican (6.5%, a difference of 0.48%).
| Demographics | Rating | Rank | Disability Age 5 to 17 |
| Apache | 0.0 /100 | #313 | Tragic 6.4% |
| French | 0.0 /100 | #314 | Tragic 6.4% |
| Immigrants | Portugal | 0.0 /100 | #315 | Tragic 6.4% |
| Immigrants | Dominican Republic | 0.0 /100 | #316 | Tragic 6.4% |
| Kiowa | 0.0 /100 | #317 | Tragic 6.4% |
| Comanche | 0.0 /100 | #318 | Tragic 6.4% |
| Delaware | 0.0 /100 | #319 | Tragic 6.5% |
| Africans | 0.0 /100 | #320 | Tragic 6.5% |
| Tohono O'odham | 0.0 /100 | #321 | Tragic 6.5% |
| Slovaks | 0.0 /100 | #322 | Tragic 6.5% |
| Osage | 0.0 /100 | #323 | Tragic 6.5% |
| Dominicans | 0.0 /100 | #324 | Tragic 6.5% |
| Americans | 0.0 /100 | #325 | Tragic 6.5% |
| Potawatomi | 0.0 /100 | #326 | Tragic 6.5% |
| French American Indians | 0.0 /100 | #327 | Tragic 6.6% |
Demographics Similar to Immigrants from Peru by Disability Age 5 to 17
In terms of disability age 5 to 17, the demographic groups most similar to Immigrants from Peru are Immigrants from Jordan (5.3%, a difference of 0.070%), Luxembourger (5.3%, a difference of 0.080%), Mongolian (5.3%, a difference of 0.090%), Immigrants from Grenada (5.3%, a difference of 0.090%), and Immigrants from El Salvador (5.3%, a difference of 0.25%).
| Demographics | Rating | Rank | Disability Age 5 to 17 |
| Immigrants | St. Vincent and the Grenadines | 99.4 /100 | #86 | Exceptional 5.2% |
| Eastern Europeans | 99.4 /100 | #87 | Exceptional 5.2% |
| Immigrants | Croatia | 99.4 /100 | #88 | Exceptional 5.2% |
| Immigrants | Spain | 99.4 /100 | #89 | Exceptional 5.2% |
| Immigrants | Kuwait | 99.4 /100 | #90 | Exceptional 5.3% |
| Mongolians | 99.2 /100 | #91 | Exceptional 5.3% |
| Luxembourgers | 99.2 /100 | #92 | Exceptional 5.3% |
| Immigrants | Peru | 99.1 /100 | #93 | Exceptional 5.3% |
| Immigrants | Jordan | 99.1 /100 | #94 | Exceptional 5.3% |
| Immigrants | Grenada | 99.1 /100 | #95 | Exceptional 5.3% |
| Immigrants | El Salvador | 99.0 /100 | #96 | Exceptional 5.3% |
| Immigrants | Europe | 99.0 /100 | #97 | Exceptional 5.3% |
| Immigrants | Austria | 98.9 /100 | #98 | Exceptional 5.3% |
| Cambodians | 98.8 /100 | #99 | Exceptional 5.3% |
| Nepalese | 98.7 /100 | #100 | Exceptional 5.3% |