Chinese vs Cape Verdean Disability Age 5 to 17
COMPARE
Chinese
Cape Verdean
Disability Age 5 to 17
Disability Age 5 to 17 Comparison
Chinese
Cape Verdeans
4.7%
DISABILITY AGE 5 TO 17
100.0/ 100
METRIC RATING
15th/ 347
METRIC RANK
7.0%
DISABILITY AGE 5 TO 17
0.0/ 100
METRIC RATING
341st/ 347
METRIC RANK
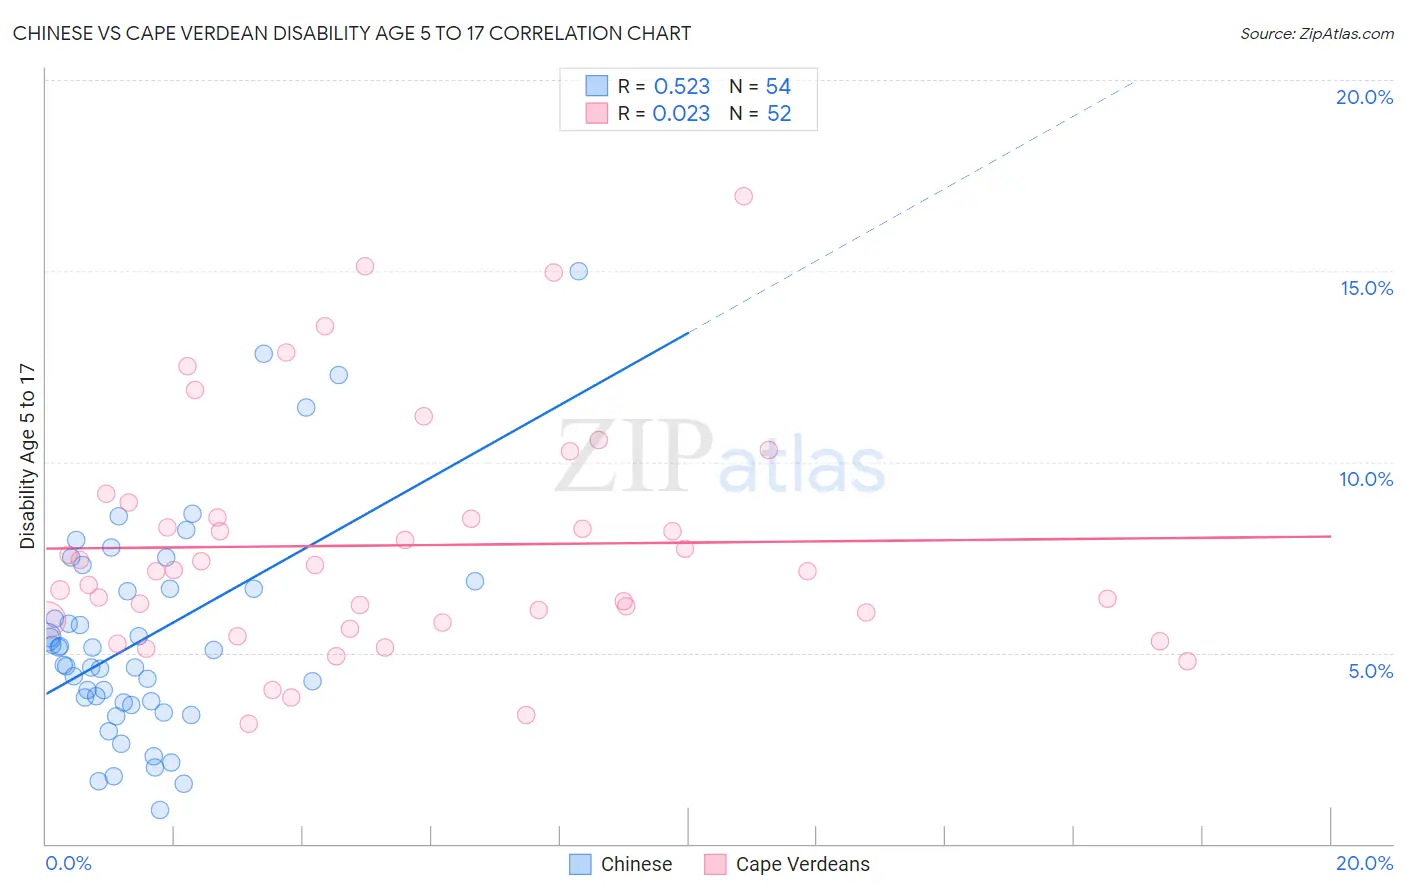
Chinese vs Cape Verdean Disability Age 5 to 17 Correlation Chart
The statistical analysis conducted on geographies consisting of 64,726,058 people shows a substantial positive correlation between the proportion of Chinese and percentage of population with a disability between the ages 5 and 17 in the United States with a correlation coefficient (R) of 0.523 and weighted average of 4.7%. Similarly, the statistical analysis conducted on geographies consisting of 107,309,150 people shows no correlation between the proportion of Cape Verdeans and percentage of population with a disability between the ages 5 and 17 in the United States with a correlation coefficient (R) of 0.023 and weighted average of 7.0%, a difference of 48.3%.
Disability Age 5 to 17 Correlation Summary
| Measurement | Chinese | Cape Verdean |
| Minimum | 0.88% | 3.1% |
| Maximum | 15.0% | 17.0% |
| Range | 14.1% | 13.8% |
| Mean | 5.4% | 7.8% |
| Median | 4.9% | 7.2% |
| Interquartile 25% (IQ1) | 3.7% | 5.8% |
| Interquartile 75% (IQ3) | 6.7% | 8.7% |
| Interquartile Range (IQR) | 3.0% | 2.9% |
| Standard Deviation (Sample) | 2.9% | 3.1% |
| Standard Deviation (Population) | 2.8% | 3.0% |
Similar Demographics by Disability Age 5 to 17
Demographics Similar to Chinese by Disability Age 5 to 17
In terms of disability age 5 to 17, the demographic groups most similar to Chinese are Immigrants from Korea (4.7%, a difference of 0.20%), Immigrants from Singapore (4.7%, a difference of 0.42%), Arapaho (4.7%, a difference of 0.88%), Immigrants from South Central Asia (4.7%, a difference of 0.90%), and Thai (4.7%, a difference of 0.91%).
| Demographics | Rating | Rank | Disability Age 5 to 17 |
| Indians (Asian) | 100.0 /100 | #8 | Exceptional 4.6% |
| Immigrants | Eastern Asia | 100.0 /100 | #9 | Exceptional 4.6% |
| Immigrants | India | 100.0 /100 | #10 | Exceptional 4.6% |
| Armenians | 100.0 /100 | #11 | Exceptional 4.6% |
| Iranians | 100.0 /100 | #12 | Exceptional 4.6% |
| Thais | 100.0 /100 | #13 | Exceptional 4.7% |
| Immigrants | Korea | 100.0 /100 | #14 | Exceptional 4.7% |
| Chinese | 100.0 /100 | #15 | Exceptional 4.7% |
| Immigrants | Singapore | 100.0 /100 | #16 | Exceptional 4.7% |
| Arapaho | 100.0 /100 | #17 | Exceptional 4.7% |
| Immigrants | South Central Asia | 100.0 /100 | #18 | Exceptional 4.7% |
| Immigrants | Uzbekistan | 100.0 /100 | #19 | Exceptional 4.8% |
| Burmese | 100.0 /100 | #20 | Exceptional 4.8% |
| Yup'ik | 100.0 /100 | #21 | Exceptional 4.8% |
| Asians | 100.0 /100 | #22 | Exceptional 4.8% |
Demographics Similar to Cape Verdeans by Disability Age 5 to 17
In terms of disability age 5 to 17, the demographic groups most similar to Cape Verdeans are Cherokee (6.9%, a difference of 0.54%), Choctaw (6.9%, a difference of 0.80%), Iroquois (6.9%, a difference of 1.1%), Creek (6.9%, a difference of 1.4%), and Chickasaw (6.8%, a difference of 1.8%).
| Demographics | Rating | Rank | Disability Age 5 to 17 |
| Blacks/African Americans | 0.0 /100 | #333 | Tragic 6.8% |
| Seminole | 0.0 /100 | #334 | Tragic 6.8% |
| Ottawa | 0.0 /100 | #335 | Tragic 6.8% |
| Chickasaw | 0.0 /100 | #336 | Tragic 6.8% |
| Creek | 0.0 /100 | #337 | Tragic 6.9% |
| Iroquois | 0.0 /100 | #338 | Tragic 6.9% |
| Choctaw | 0.0 /100 | #339 | Tragic 6.9% |
| Cherokee | 0.0 /100 | #340 | Tragic 6.9% |
| Cape Verdeans | 0.0 /100 | #341 | Tragic 7.0% |
| Chippewa | 0.0 /100 | #342 | Tragic 7.1% |
| Immigrants | Cabo Verde | 0.0 /100 | #343 | Tragic 7.1% |
| Cajuns | 0.0 /100 | #344 | Tragic 7.2% |
| Tsimshian | 0.0 /100 | #345 | Tragic 7.9% |
| Puerto Ricans | 0.0 /100 | #346 | Tragic 8.3% |
| Houma | 0.0 /100 | #347 | Tragic 9.1% |