African vs Austrian Disability Age 5 to 17
COMPARE
African
Austrian
Disability Age 5 to 17
Disability Age 5 to 17 Comparison
Africans
Austrians
6.5%
DISABILITY AGE 5 TO 17
0.0/ 100
METRIC RATING
320th/ 347
METRIC RANK
5.7%
DISABILITY AGE 5 TO 17
13.2/ 100
METRIC RATING
202nd/ 347
METRIC RANK
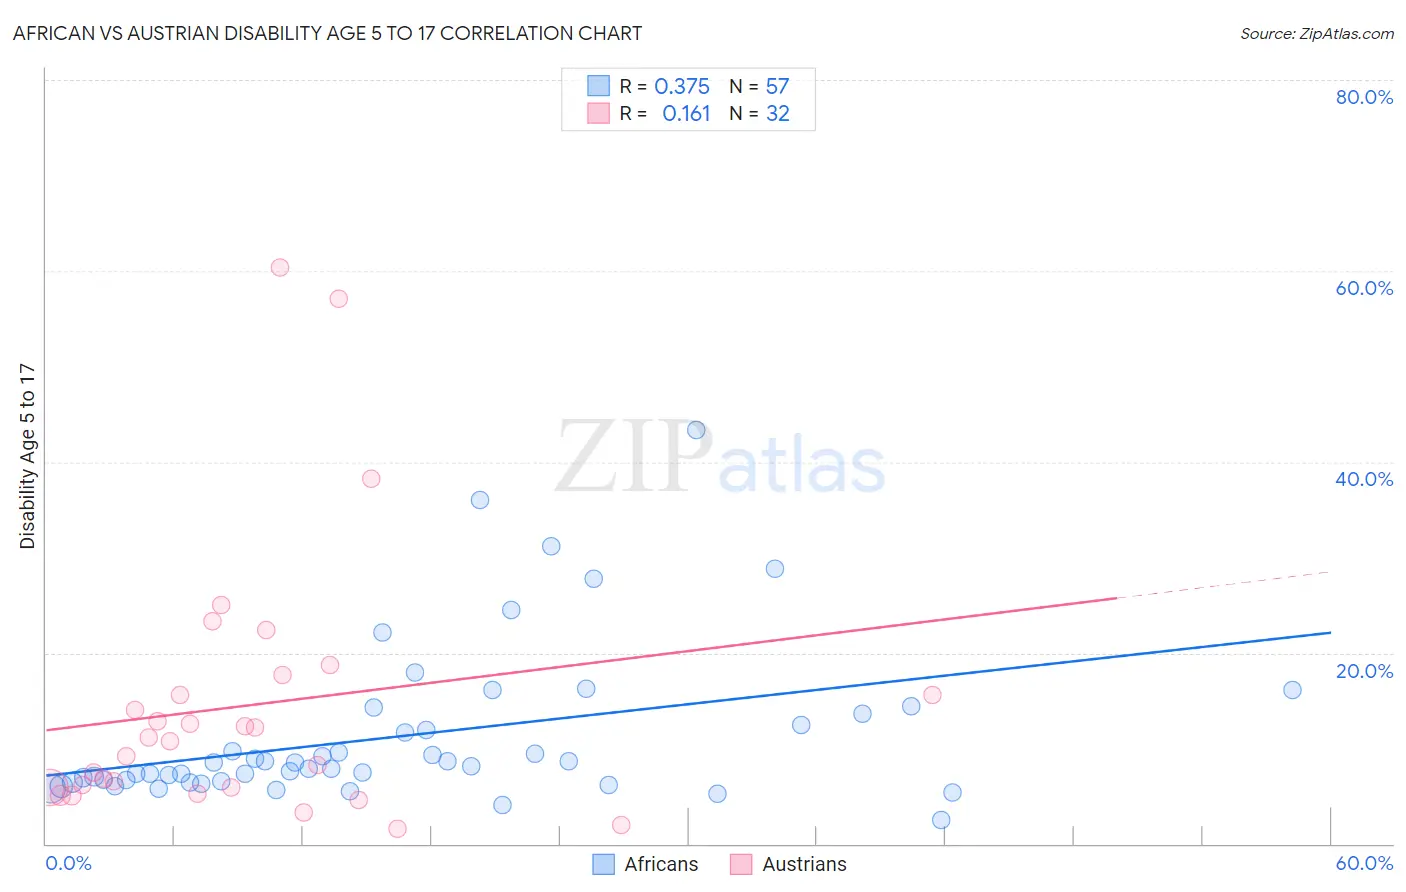
African vs Austrian Disability Age 5 to 17 Correlation Chart
The statistical analysis conducted on geographies consisting of 465,699,763 people shows a mild positive correlation between the proportion of Africans and percentage of population with a disability between the ages 5 and 17 in the United States with a correlation coefficient (R) of 0.375 and weighted average of 6.5%. Similarly, the statistical analysis conducted on geographies consisting of 446,287,500 people shows a poor positive correlation between the proportion of Austrians and percentage of population with a disability between the ages 5 and 17 in the United States with a correlation coefficient (R) of 0.161 and weighted average of 5.7%, a difference of 13.3%.
Disability Age 5 to 17 Correlation Summary
| Measurement | African | Austrian |
| Minimum | 2.5% | 1.5% |
| Maximum | 43.3% | 60.4% |
| Range | 40.9% | 58.9% |
| Mean | 11.3% | 14.5% |
| Median | 8.1% | 10.9% |
| Interquartile 25% (IQ1) | 6.5% | 5.9% |
| Interquartile 75% (IQ3) | 13.0% | 16.6% |
| Interquartile Range (IQR) | 6.5% | 10.8% |
| Standard Deviation (Sample) | 8.3% | 14.0% |
| Standard Deviation (Population) | 8.2% | 13.8% |
Similar Demographics by Disability Age 5 to 17
Demographics Similar to Africans by Disability Age 5 to 17
In terms of disability age 5 to 17, the demographic groups most similar to Africans are Delaware (6.5%, a difference of 0.19%), Tohono O'odham (6.5%, a difference of 0.35%), Slovak (6.5%, a difference of 0.36%), Osage (6.5%, a difference of 0.40%), and Dominican (6.5%, a difference of 0.48%).
| Demographics | Rating | Rank | Disability Age 5 to 17 |
| Apache | 0.0 /100 | #313 | Tragic 6.4% |
| French | 0.0 /100 | #314 | Tragic 6.4% |
| Immigrants | Portugal | 0.0 /100 | #315 | Tragic 6.4% |
| Immigrants | Dominican Republic | 0.0 /100 | #316 | Tragic 6.4% |
| Kiowa | 0.0 /100 | #317 | Tragic 6.4% |
| Comanche | 0.0 /100 | #318 | Tragic 6.4% |
| Delaware | 0.0 /100 | #319 | Tragic 6.5% |
| Africans | 0.0 /100 | #320 | Tragic 6.5% |
| Tohono O'odham | 0.0 /100 | #321 | Tragic 6.5% |
| Slovaks | 0.0 /100 | #322 | Tragic 6.5% |
| Osage | 0.0 /100 | #323 | Tragic 6.5% |
| Dominicans | 0.0 /100 | #324 | Tragic 6.5% |
| Americans | 0.0 /100 | #325 | Tragic 6.5% |
| Potawatomi | 0.0 /100 | #326 | Tragic 6.5% |
| French American Indians | 0.0 /100 | #327 | Tragic 6.6% |
Demographics Similar to Austrians by Disability Age 5 to 17
In terms of disability age 5 to 17, the demographic groups most similar to Austrians are Spanish American Indian (5.7%, a difference of 0.040%), Basque (5.7%, a difference of 0.050%), Icelander (5.7%, a difference of 0.14%), Northern European (5.7%, a difference of 0.20%), and Paiute (5.7%, a difference of 0.22%).
| Demographics | Rating | Rank | Disability Age 5 to 17 |
| Immigrants | Nigeria | 23.4 /100 | #195 | Fair 5.7% |
| Inupiat | 23.3 /100 | #196 | Fair 5.7% |
| Immigrants | North America | 23.1 /100 | #197 | Fair 5.7% |
| Norwegians | 20.9 /100 | #198 | Fair 5.7% |
| Northern Europeans | 15.2 /100 | #199 | Poor 5.7% |
| Icelanders | 14.6 /100 | #200 | Poor 5.7% |
| Basques | 13.7 /100 | #201 | Poor 5.7% |
| Austrians | 13.2 /100 | #202 | Poor 5.7% |
| Spanish American Indians | 12.8 /100 | #203 | Poor 5.7% |
| Paiute | 11.2 /100 | #204 | Poor 5.7% |
| Trinidadians and Tobagonians | 10.8 /100 | #205 | Poor 5.7% |
| Immigrants | Africa | 10.8 /100 | #206 | Poor 5.7% |
| Moroccans | 10.4 /100 | #207 | Poor 5.7% |
| Kenyans | 10.0 /100 | #208 | Poor 5.8% |
| Immigrants | Uganda | 9.7 /100 | #209 | Tragic 5.8% |