Arab vs Cape Verdean Disability Age 5 to 17
COMPARE
Arab
Cape Verdean
Disability Age 5 to 17
Disability Age 5 to 17 Comparison
Arabs
Cape Verdeans
5.4%
DISABILITY AGE 5 TO 17
92.9/ 100
METRIC RATING
131st/ 347
METRIC RANK
7.0%
DISABILITY AGE 5 TO 17
0.0/ 100
METRIC RATING
341st/ 347
METRIC RANK
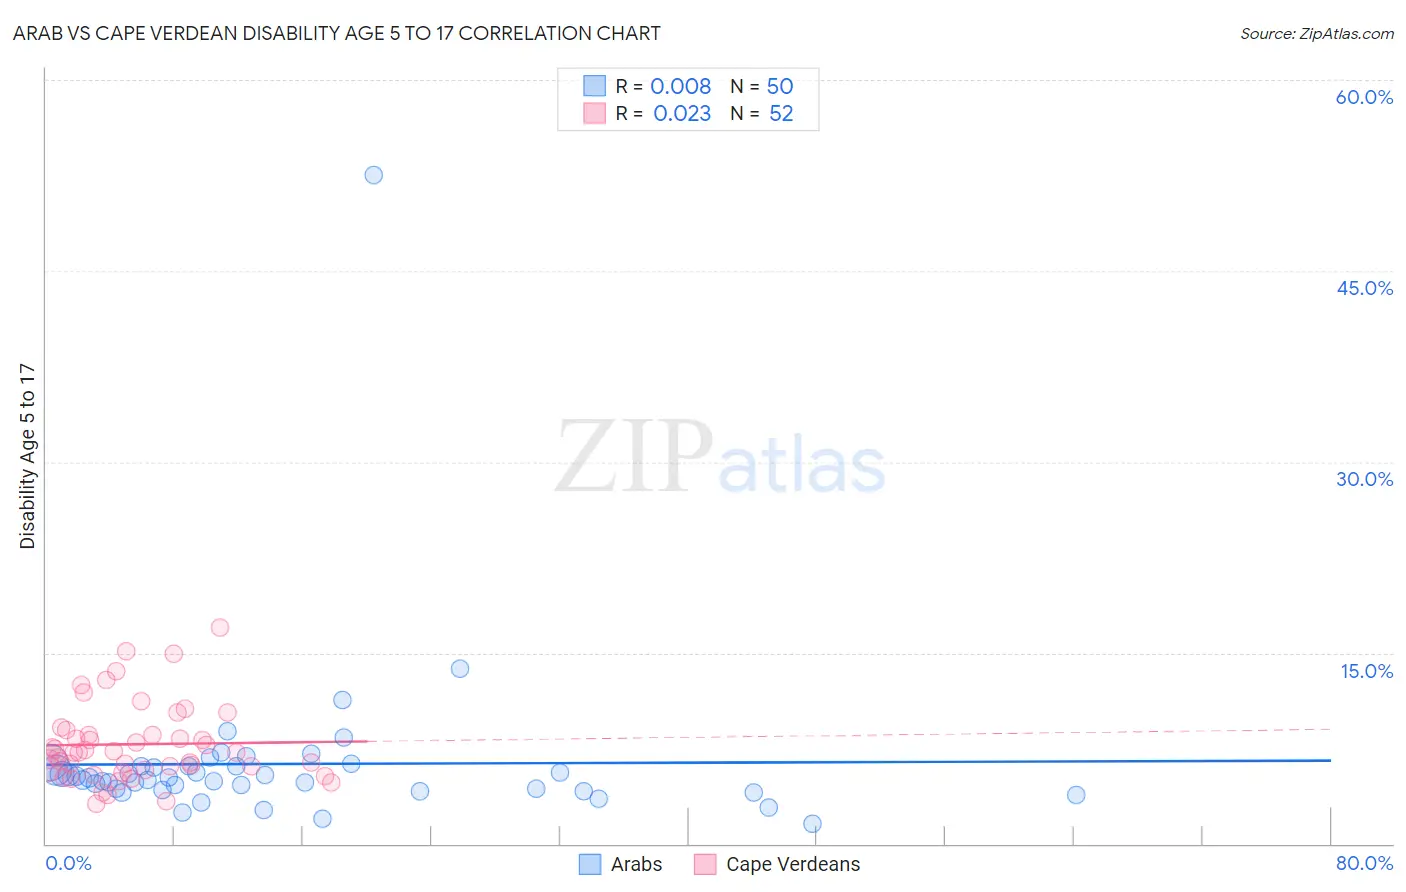
Arab vs Cape Verdean Disability Age 5 to 17 Correlation Chart
The statistical analysis conducted on geographies consisting of 481,041,182 people shows no correlation between the proportion of Arabs and percentage of population with a disability between the ages 5 and 17 in the United States with a correlation coefficient (R) of 0.008 and weighted average of 5.4%. Similarly, the statistical analysis conducted on geographies consisting of 107,309,150 people shows no correlation between the proportion of Cape Verdeans and percentage of population with a disability between the ages 5 and 17 in the United States with a correlation coefficient (R) of 0.023 and weighted average of 7.0%, a difference of 28.4%.
Disability Age 5 to 17 Correlation Summary
| Measurement | Arab | Cape Verdean |
| Minimum | 1.6% | 3.1% |
| Maximum | 52.5% | 17.0% |
| Range | 50.9% | 13.8% |
| Mean | 6.3% | 7.8% |
| Median | 5.1% | 7.2% |
| Interquartile 25% (IQ1) | 4.2% | 5.8% |
| Interquartile 75% (IQ3) | 6.1% | 8.7% |
| Interquartile Range (IQR) | 1.9% | 2.9% |
| Standard Deviation (Sample) | 7.0% | 3.1% |
| Standard Deviation (Population) | 6.9% | 3.0% |
Similar Demographics by Disability Age 5 to 17
Demographics Similar to Arabs by Disability Age 5 to 17
In terms of disability age 5 to 17, the demographic groups most similar to Arabs are Immigrants from Colombia (5.4%, a difference of 0.020%), Venezuelan (5.4%, a difference of 0.050%), Yuman (5.4%, a difference of 0.13%), Immigrants from Belize (5.4%, a difference of 0.22%), and Immigrants from Bulgaria (5.4%, a difference of 0.23%).
| Demographics | Rating | Rank | Disability Age 5 to 17 |
| Crow | 95.0 /100 | #124 | Exceptional 5.4% |
| Immigrants | Chile | 95.0 /100 | #125 | Exceptional 5.4% |
| New Zealanders | 95.0 /100 | #126 | Exceptional 5.4% |
| Latvians | 95.0 /100 | #127 | Exceptional 5.4% |
| Immigrants | Venezuela | 94.5 /100 | #128 | Exceptional 5.4% |
| Romanians | 94.1 /100 | #129 | Exceptional 5.4% |
| Immigrants | Bulgaria | 94.0 /100 | #130 | Exceptional 5.4% |
| Arabs | 92.9 /100 | #131 | Exceptional 5.4% |
| Immigrants | Colombia | 92.9 /100 | #132 | Exceptional 5.4% |
| Venezuelans | 92.7 /100 | #133 | Exceptional 5.4% |
| Yuman | 92.3 /100 | #134 | Exceptional 5.4% |
| Immigrants | Belize | 91.7 /100 | #135 | Exceptional 5.4% |
| Immigrants | Denmark | 91.4 /100 | #136 | Exceptional 5.4% |
| Navajo | 90.9 /100 | #137 | Exceptional 5.4% |
| Immigrants | Oceania | 90.8 /100 | #138 | Exceptional 5.4% |
Demographics Similar to Cape Verdeans by Disability Age 5 to 17
In terms of disability age 5 to 17, the demographic groups most similar to Cape Verdeans are Cherokee (6.9%, a difference of 0.54%), Choctaw (6.9%, a difference of 0.80%), Iroquois (6.9%, a difference of 1.1%), Creek (6.9%, a difference of 1.4%), and Chickasaw (6.8%, a difference of 1.8%).
| Demographics | Rating | Rank | Disability Age 5 to 17 |
| Blacks/African Americans | 0.0 /100 | #333 | Tragic 6.8% |
| Seminole | 0.0 /100 | #334 | Tragic 6.8% |
| Ottawa | 0.0 /100 | #335 | Tragic 6.8% |
| Chickasaw | 0.0 /100 | #336 | Tragic 6.8% |
| Creek | 0.0 /100 | #337 | Tragic 6.9% |
| Iroquois | 0.0 /100 | #338 | Tragic 6.9% |
| Choctaw | 0.0 /100 | #339 | Tragic 6.9% |
| Cherokee | 0.0 /100 | #340 | Tragic 6.9% |
| Cape Verdeans | 0.0 /100 | #341 | Tragic 7.0% |
| Chippewa | 0.0 /100 | #342 | Tragic 7.1% |
| Immigrants | Cabo Verde | 0.0 /100 | #343 | Tragic 7.1% |
| Cajuns | 0.0 /100 | #344 | Tragic 7.2% |
| Tsimshian | 0.0 /100 | #345 | Tragic 7.9% |
| Puerto Ricans | 0.0 /100 | #346 | Tragic 8.3% |
| Houma | 0.0 /100 | #347 | Tragic 9.1% |