Immigrants from Yemen vs Cape Verdean Disability Age 5 to 17
COMPARE
Immigrants from Yemen
Cape Verdean
Disability Age 5 to 17
Disability Age 5 to 17 Comparison
Immigrants from Yemen
Cape Verdeans
5.3%
DISABILITY AGE 5 TO 17
98.2/ 100
METRIC RATING
106th/ 347
METRIC RANK
7.0%
DISABILITY AGE 5 TO 17
0.0/ 100
METRIC RATING
341st/ 347
METRIC RANK
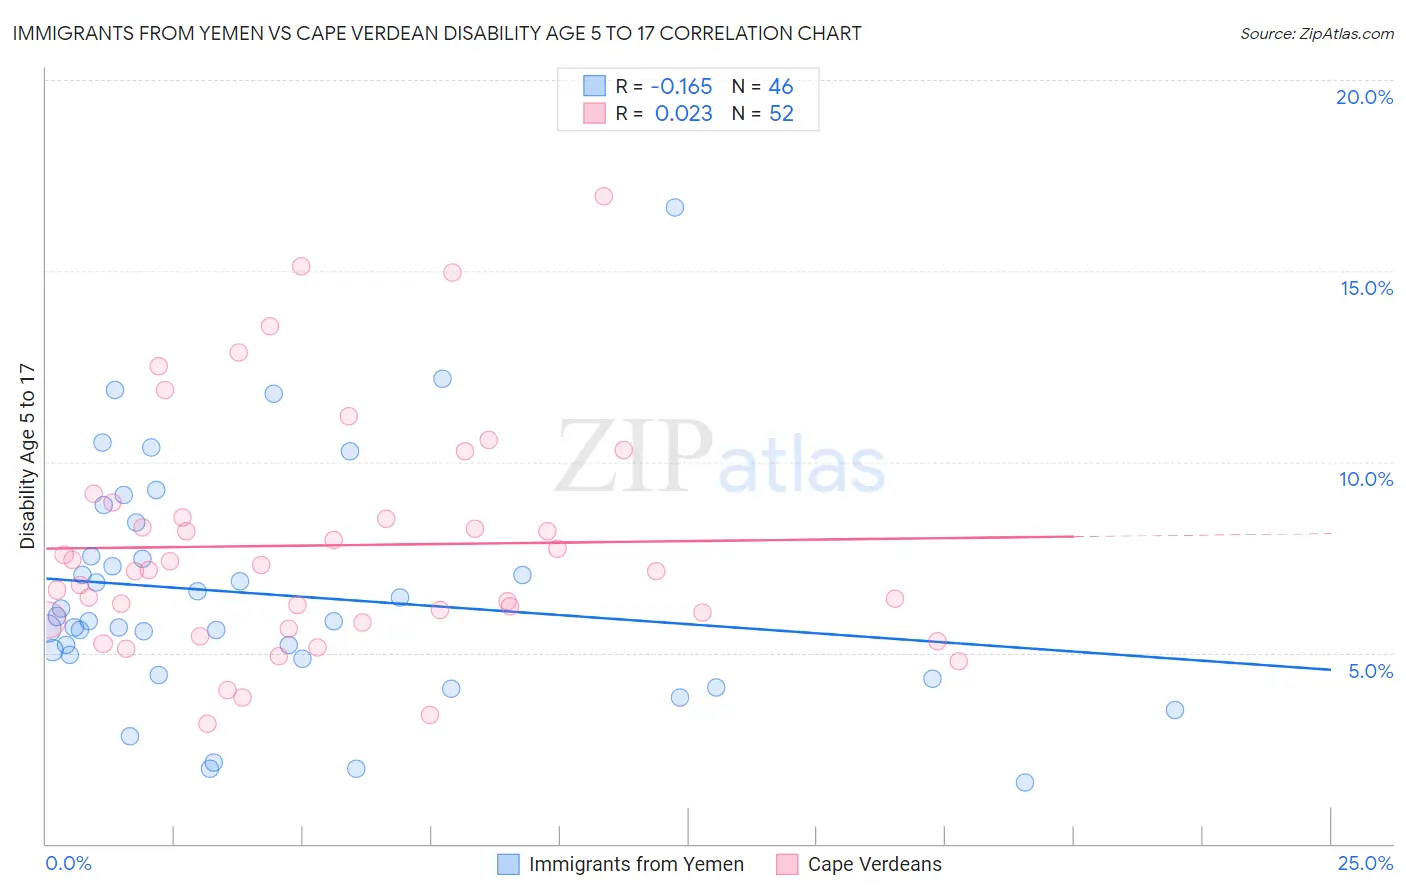
Immigrants from Yemen vs Cape Verdean Disability Age 5 to 17 Correlation Chart
The statistical analysis conducted on geographies consisting of 82,306,406 people shows a poor negative correlation between the proportion of Immigrants from Yemen and percentage of population with a disability between the ages 5 and 17 in the United States with a correlation coefficient (R) of -0.165 and weighted average of 5.3%. Similarly, the statistical analysis conducted on geographies consisting of 107,309,150 people shows no correlation between the proportion of Cape Verdeans and percentage of population with a disability between the ages 5 and 17 in the United States with a correlation coefficient (R) of 0.023 and weighted average of 7.0%, a difference of 30.8%.
Disability Age 5 to 17 Correlation Summary
| Measurement | Immigrants from Yemen | Cape Verdean |
| Minimum | 1.6% | 3.1% |
| Maximum | 16.7% | 17.0% |
| Range | 15.1% | 13.8% |
| Mean | 6.5% | 7.8% |
| Median | 5.8% | 7.2% |
| Interquartile 25% (IQ1) | 4.8% | 5.8% |
| Interquartile 75% (IQ3) | 7.5% | 8.7% |
| Interquartile Range (IQR) | 2.7% | 2.9% |
| Standard Deviation (Sample) | 3.0% | 3.1% |
| Standard Deviation (Population) | 3.0% | 3.0% |
Similar Demographics by Disability Age 5 to 17
Demographics Similar to Immigrants from Yemen by Disability Age 5 to 17
In terms of disability age 5 to 17, the demographic groups most similar to Immigrants from Yemen are Russian (5.3%, a difference of 0.030%), Immigrants from South Africa (5.3%, a difference of 0.070%), Immigrants from Northern Africa (5.3%, a difference of 0.11%), Immigrants from Italy (5.3%, a difference of 0.13%), and Immigrants from Eritrea (5.3%, a difference of 0.16%).
| Demographics | Rating | Rank | Disability Age 5 to 17 |
| Cambodians | 98.8 /100 | #99 | Exceptional 5.3% |
| Nepalese | 98.7 /100 | #100 | Exceptional 5.3% |
| Menominee | 98.7 /100 | #101 | Exceptional 5.3% |
| Nicaraguans | 98.6 /100 | #102 | Exceptional 5.3% |
| Salvadorans | 98.6 /100 | #103 | Exceptional 5.3% |
| Peruvians | 98.5 /100 | #104 | Exceptional 5.3% |
| Immigrants | Italy | 98.4 /100 | #105 | Exceptional 5.3% |
| Immigrants | Yemen | 98.2 /100 | #106 | Exceptional 5.3% |
| Russians | 98.2 /100 | #107 | Exceptional 5.3% |
| Immigrants | South Africa | 98.1 /100 | #108 | Exceptional 5.3% |
| Immigrants | Northern Africa | 98.1 /100 | #109 | Exceptional 5.3% |
| Immigrants | Eritrea | 98.0 /100 | #110 | Exceptional 5.3% |
| Ethiopians | 97.9 /100 | #111 | Exceptional 5.3% |
| Immigrants | Latvia | 97.9 /100 | #112 | Exceptional 5.3% |
| Aleuts | 97.8 /100 | #113 | Exceptional 5.3% |
Demographics Similar to Cape Verdeans by Disability Age 5 to 17
In terms of disability age 5 to 17, the demographic groups most similar to Cape Verdeans are Cherokee (6.9%, a difference of 0.54%), Choctaw (6.9%, a difference of 0.80%), Iroquois (6.9%, a difference of 1.1%), Creek (6.9%, a difference of 1.4%), and Chickasaw (6.8%, a difference of 1.8%).
| Demographics | Rating | Rank | Disability Age 5 to 17 |
| Blacks/African Americans | 0.0 /100 | #333 | Tragic 6.8% |
| Seminole | 0.0 /100 | #334 | Tragic 6.8% |
| Ottawa | 0.0 /100 | #335 | Tragic 6.8% |
| Chickasaw | 0.0 /100 | #336 | Tragic 6.8% |
| Creek | 0.0 /100 | #337 | Tragic 6.9% |
| Iroquois | 0.0 /100 | #338 | Tragic 6.9% |
| Choctaw | 0.0 /100 | #339 | Tragic 6.9% |
| Cherokee | 0.0 /100 | #340 | Tragic 6.9% |
| Cape Verdeans | 0.0 /100 | #341 | Tragic 7.0% |
| Chippewa | 0.0 /100 | #342 | Tragic 7.1% |
| Immigrants | Cabo Verde | 0.0 /100 | #343 | Tragic 7.1% |
| Cajuns | 0.0 /100 | #344 | Tragic 7.2% |
| Tsimshian | 0.0 /100 | #345 | Tragic 7.9% |
| Puerto Ricans | 0.0 /100 | #346 | Tragic 8.3% |
| Houma | 0.0 /100 | #347 | Tragic 9.1% |