African vs Nigerian Disability Age 5 to 17
COMPARE
African
Nigerian
Disability Age 5 to 17
Disability Age 5 to 17 Comparison
Africans
Nigerians
6.5%
DISABILITY AGE 5 TO 17
0.0/ 100
METRIC RATING
320th/ 347
METRIC RANK
5.8%
DISABILITY AGE 5 TO 17
7.5/ 100
METRIC RATING
216th/ 347
METRIC RANK
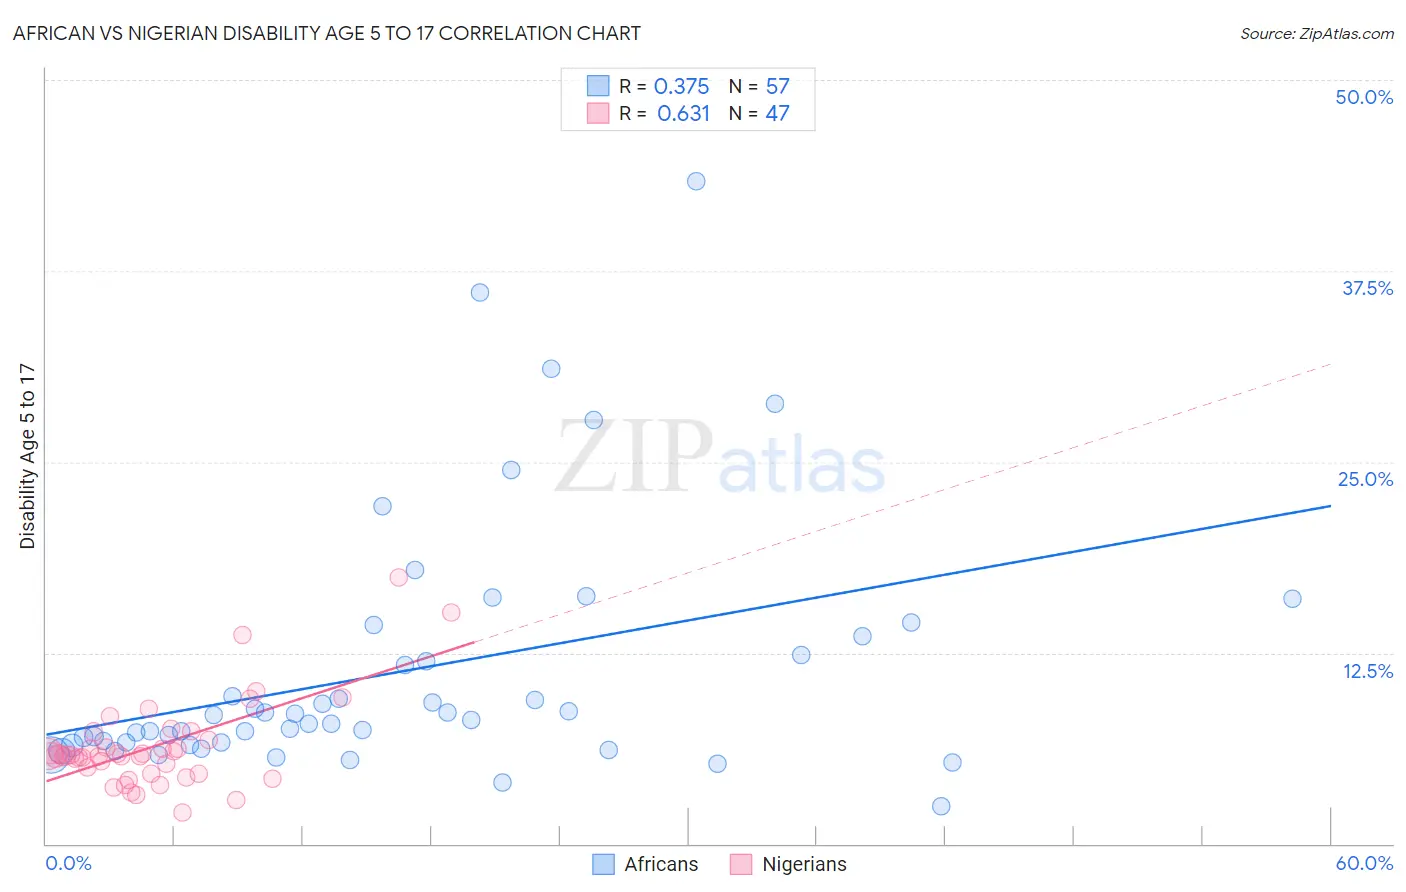
African vs Nigerian Disability Age 5 to 17 Correlation Chart
The statistical analysis conducted on geographies consisting of 465,699,763 people shows a mild positive correlation between the proportion of Africans and percentage of population with a disability between the ages 5 and 17 in the United States with a correlation coefficient (R) of 0.375 and weighted average of 6.5%. Similarly, the statistical analysis conducted on geographies consisting of 330,899,838 people shows a significant positive correlation between the proportion of Nigerians and percentage of population with a disability between the ages 5 and 17 in the United States with a correlation coefficient (R) of 0.631 and weighted average of 5.8%, a difference of 12.5%.
Disability Age 5 to 17 Correlation Summary
| Measurement | African | Nigerian |
| Minimum | 2.5% | 2.1% |
| Maximum | 43.3% | 17.5% |
| Range | 40.9% | 15.4% |
| Mean | 11.3% | 6.4% |
| Median | 8.1% | 5.8% |
| Interquartile 25% (IQ1) | 6.5% | 4.6% |
| Interquartile 75% (IQ3) | 13.0% | 6.8% |
| Interquartile Range (IQR) | 6.5% | 2.2% |
| Standard Deviation (Sample) | 8.3% | 2.9% |
| Standard Deviation (Population) | 8.2% | 2.9% |
Similar Demographics by Disability Age 5 to 17
Demographics Similar to Africans by Disability Age 5 to 17
In terms of disability age 5 to 17, the demographic groups most similar to Africans are Delaware (6.5%, a difference of 0.19%), Tohono O'odham (6.5%, a difference of 0.35%), Slovak (6.5%, a difference of 0.36%), Osage (6.5%, a difference of 0.40%), and Dominican (6.5%, a difference of 0.48%).
| Demographics | Rating | Rank | Disability Age 5 to 17 |
| Apache | 0.0 /100 | #313 | Tragic 6.4% |
| French | 0.0 /100 | #314 | Tragic 6.4% |
| Immigrants | Portugal | 0.0 /100 | #315 | Tragic 6.4% |
| Immigrants | Dominican Republic | 0.0 /100 | #316 | Tragic 6.4% |
| Kiowa | 0.0 /100 | #317 | Tragic 6.4% |
| Comanche | 0.0 /100 | #318 | Tragic 6.4% |
| Delaware | 0.0 /100 | #319 | Tragic 6.5% |
| Africans | 0.0 /100 | #320 | Tragic 6.5% |
| Tohono O'odham | 0.0 /100 | #321 | Tragic 6.5% |
| Slovaks | 0.0 /100 | #322 | Tragic 6.5% |
| Osage | 0.0 /100 | #323 | Tragic 6.5% |
| Dominicans | 0.0 /100 | #324 | Tragic 6.5% |
| Americans | 0.0 /100 | #325 | Tragic 6.5% |
| Potawatomi | 0.0 /100 | #326 | Tragic 6.5% |
| French American Indians | 0.0 /100 | #327 | Tragic 6.6% |
Demographics Similar to Nigerians by Disability Age 5 to 17
In terms of disability age 5 to 17, the demographic groups most similar to Nigerians are Czech (5.8%, a difference of 0.030%), Immigrants from Sierra Leone (5.8%, a difference of 0.080%), Swedish (5.8%, a difference of 0.090%), Sierra Leonean (5.8%, a difference of 0.090%), and Belgian (5.8%, a difference of 0.10%).
| Demographics | Rating | Rank | Disability Age 5 to 17 |
| Immigrants | Uganda | 9.7 /100 | #209 | Tragic 5.8% |
| Immigrants | Haiti | 9.5 /100 | #210 | Tragic 5.8% |
| Yugoslavians | 9.1 /100 | #211 | Tragic 5.8% |
| Immigrants | Panama | 8.7 /100 | #212 | Tragic 5.8% |
| Immigrants | Cameroon | 8.3 /100 | #213 | Tragic 5.8% |
| Immigrants | Morocco | 8.3 /100 | #214 | Tragic 5.8% |
| Swedes | 8.1 /100 | #215 | Tragic 5.8% |
| Nigerians | 7.5 /100 | #216 | Tragic 5.8% |
| Czechs | 7.4 /100 | #217 | Tragic 5.8% |
| Immigrants | Sierra Leone | 7.1 /100 | #218 | Tragic 5.8% |
| Sierra Leoneans | 7.0 /100 | #219 | Tragic 5.8% |
| Belgians | 6.9 /100 | #220 | Tragic 5.8% |
| Lithuanians | 6.7 /100 | #221 | Tragic 5.8% |
| Immigrants | Sudan | 6.7 /100 | #222 | Tragic 5.8% |
| Alsatians | 6.0 /100 | #223 | Tragic 5.8% |