Immigrants from Bahamas vs Austrian Disability Age 5 to 17
COMPARE
Immigrants from Bahamas
Austrian
Disability Age 5 to 17
Disability Age 5 to 17 Comparison
Immigrants from Bahamas
Austrians
6.2%
DISABILITY AGE 5 TO 17
0.0/ 100
METRIC RATING
297th/ 347
METRIC RANK
5.7%
DISABILITY AGE 5 TO 17
13.2/ 100
METRIC RATING
202nd/ 347
METRIC RANK
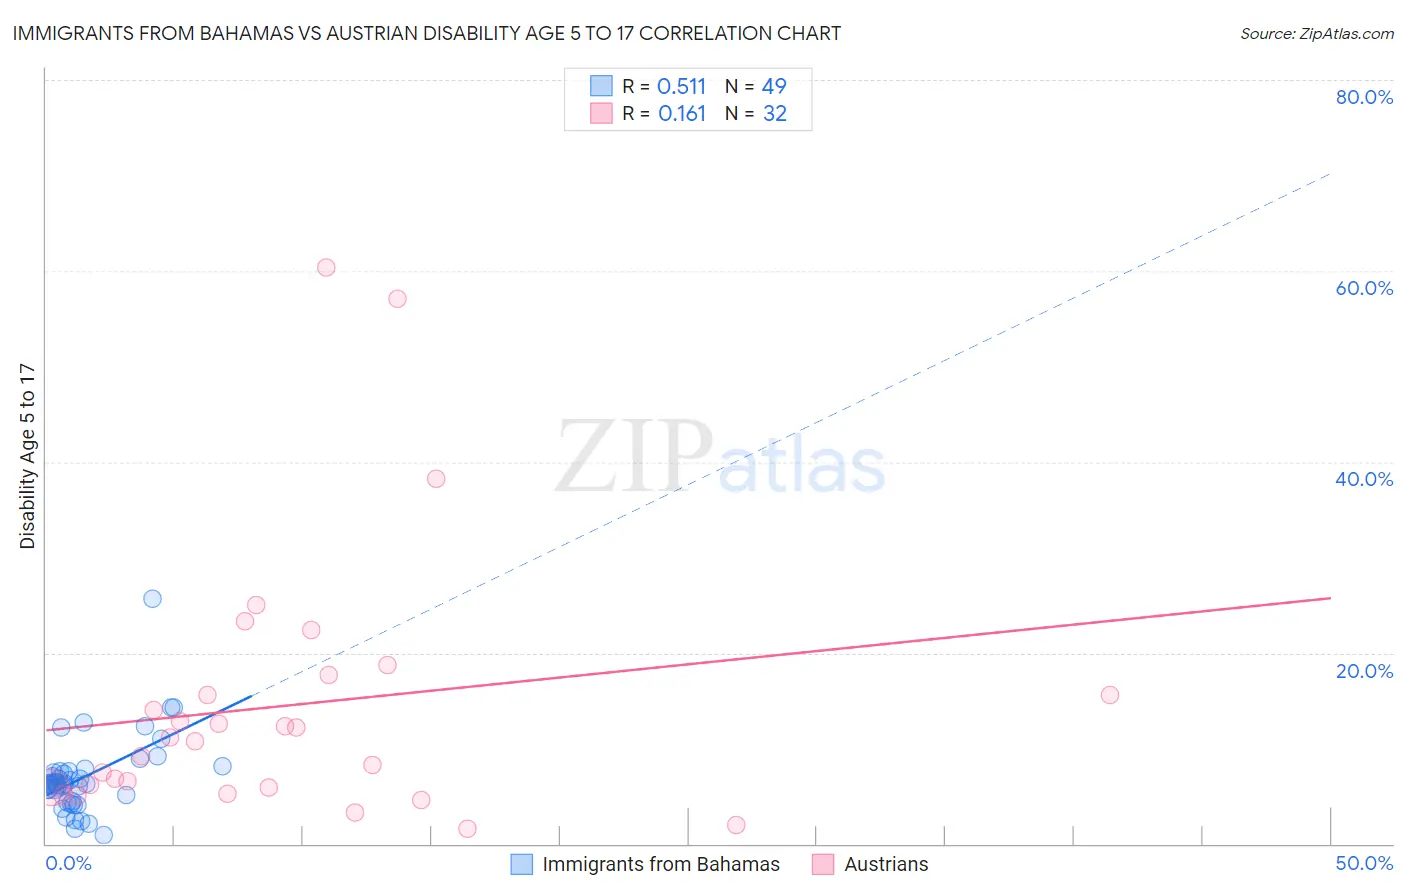
Immigrants from Bahamas vs Austrian Disability Age 5 to 17 Correlation Chart
The statistical analysis conducted on geographies consisting of 104,453,975 people shows a substantial positive correlation between the proportion of Immigrants from Bahamas and percentage of population with a disability between the ages 5 and 17 in the United States with a correlation coefficient (R) of 0.511 and weighted average of 6.2%. Similarly, the statistical analysis conducted on geographies consisting of 446,287,500 people shows a poor positive correlation between the proportion of Austrians and percentage of population with a disability between the ages 5 and 17 in the United States with a correlation coefficient (R) of 0.161 and weighted average of 5.7%, a difference of 8.9%.
Disability Age 5 to 17 Correlation Summary
| Measurement | Immigrants from Bahamas | Austrian |
| Minimum | 0.96% | 1.5% |
| Maximum | 25.7% | 60.4% |
| Range | 24.8% | 58.9% |
| Mean | 6.9% | 14.5% |
| Median | 6.3% | 10.9% |
| Interquartile 25% (IQ1) | 4.7% | 5.9% |
| Interquartile 75% (IQ3) | 7.5% | 16.6% |
| Interquartile Range (IQR) | 2.8% | 10.8% |
| Standard Deviation (Sample) | 4.0% | 14.0% |
| Standard Deviation (Population) | 4.0% | 13.8% |
Similar Demographics by Disability Age 5 to 17
Demographics Similar to Immigrants from Bahamas by Disability Age 5 to 17
In terms of disability age 5 to 17, the demographic groups most similar to Immigrants from Bahamas are Lumbee (6.2%, a difference of 0.070%), Spanish American (6.2%, a difference of 0.12%), Cree (6.2%, a difference of 0.15%), Welsh (6.3%, a difference of 0.22%), and Carpatho Rusyn (6.3%, a difference of 0.34%).
| Demographics | Rating | Rank | Disability Age 5 to 17 |
| Immigrants | Congo | 0.0 /100 | #290 | Tragic 6.2% |
| Whites/Caucasians | 0.0 /100 | #291 | Tragic 6.2% |
| Immigrants | Senegal | 0.0 /100 | #292 | Tragic 6.2% |
| Central American Indians | 0.0 /100 | #293 | Tragic 6.2% |
| Irish | 0.0 /100 | #294 | Tragic 6.2% |
| Cree | 0.0 /100 | #295 | Tragic 6.2% |
| Spanish Americans | 0.0 /100 | #296 | Tragic 6.2% |
| Immigrants | Bahamas | 0.0 /100 | #297 | Tragic 6.2% |
| Lumbee | 0.0 /100 | #298 | Tragic 6.2% |
| Welsh | 0.0 /100 | #299 | Tragic 6.3% |
| Carpatho Rusyns | 0.0 /100 | #300 | Tragic 6.3% |
| U.S. Virgin Islanders | 0.0 /100 | #301 | Tragic 6.3% |
| Celtics | 0.0 /100 | #302 | Tragic 6.3% |
| Yakama | 0.0 /100 | #303 | Tragic 6.3% |
| Senegalese | 0.0 /100 | #304 | Tragic 6.3% |
Demographics Similar to Austrians by Disability Age 5 to 17
In terms of disability age 5 to 17, the demographic groups most similar to Austrians are Spanish American Indian (5.7%, a difference of 0.040%), Basque (5.7%, a difference of 0.050%), Icelander (5.7%, a difference of 0.14%), Northern European (5.7%, a difference of 0.20%), and Paiute (5.7%, a difference of 0.22%).
| Demographics | Rating | Rank | Disability Age 5 to 17 |
| Immigrants | Nigeria | 23.4 /100 | #195 | Fair 5.7% |
| Inupiat | 23.3 /100 | #196 | Fair 5.7% |
| Immigrants | North America | 23.1 /100 | #197 | Fair 5.7% |
| Norwegians | 20.9 /100 | #198 | Fair 5.7% |
| Northern Europeans | 15.2 /100 | #199 | Poor 5.7% |
| Icelanders | 14.6 /100 | #200 | Poor 5.7% |
| Basques | 13.7 /100 | #201 | Poor 5.7% |
| Austrians | 13.2 /100 | #202 | Poor 5.7% |
| Spanish American Indians | 12.8 /100 | #203 | Poor 5.7% |
| Paiute | 11.2 /100 | #204 | Poor 5.7% |
| Trinidadians and Tobagonians | 10.8 /100 | #205 | Poor 5.7% |
| Immigrants | Africa | 10.8 /100 | #206 | Poor 5.7% |
| Moroccans | 10.4 /100 | #207 | Poor 5.7% |
| Kenyans | 10.0 /100 | #208 | Poor 5.8% |
| Immigrants | Uganda | 9.7 /100 | #209 | Tragic 5.8% |