Valle, AZ Map & Demographics
Valle Map
Valle Overview
$52,495
PER CAPITA INCOME
0.51
INEQUALITY / GINI INDEX
248
TOTAL POPULATION
181
MALE POPULATION
67
FEMALE POPULATION
270.15
MALES / 100 FEMALES
37.02
FEMALES / 100 MALES
61.5
MEDIAN AGE
1.8
AVG FAMILY SIZE
1.4
AVG HOUSEHOLD SIZE
104
LABOR FORCE [ PEOPLE ]
41.9%
PERCENT IN LABOR FORCE
1.0%
UNEMPLOYMENT RATE
Income in Valle
Income Overview in Valle
| Characteristic | Number | Measure |
| Per Capita Income | 248 | $52,495 |
| Median Family Income | 38 | $0 |
| Mean Family Income | 38 | $0 |
| Median Household Income | 170 | $0 |
| Mean Household Income | 170 | $77,136 |
| Income Deficit | 38 | $0 |
| Wage / Income Gap (%) | 248 | 0.00% |
| Wage / Income Gap ($) | 248 | 100.00¢ per $1 |
| Gini / Inequality Index | 248 | 0.51 |
Earnings by Sex in Valle
| Sex | Number | Average Earnings |
| Male | 103 (99.0%) | $0 |
| Female | 1 (1.0%) | $0 |
| Total | 104 (100.0%) | $0 |
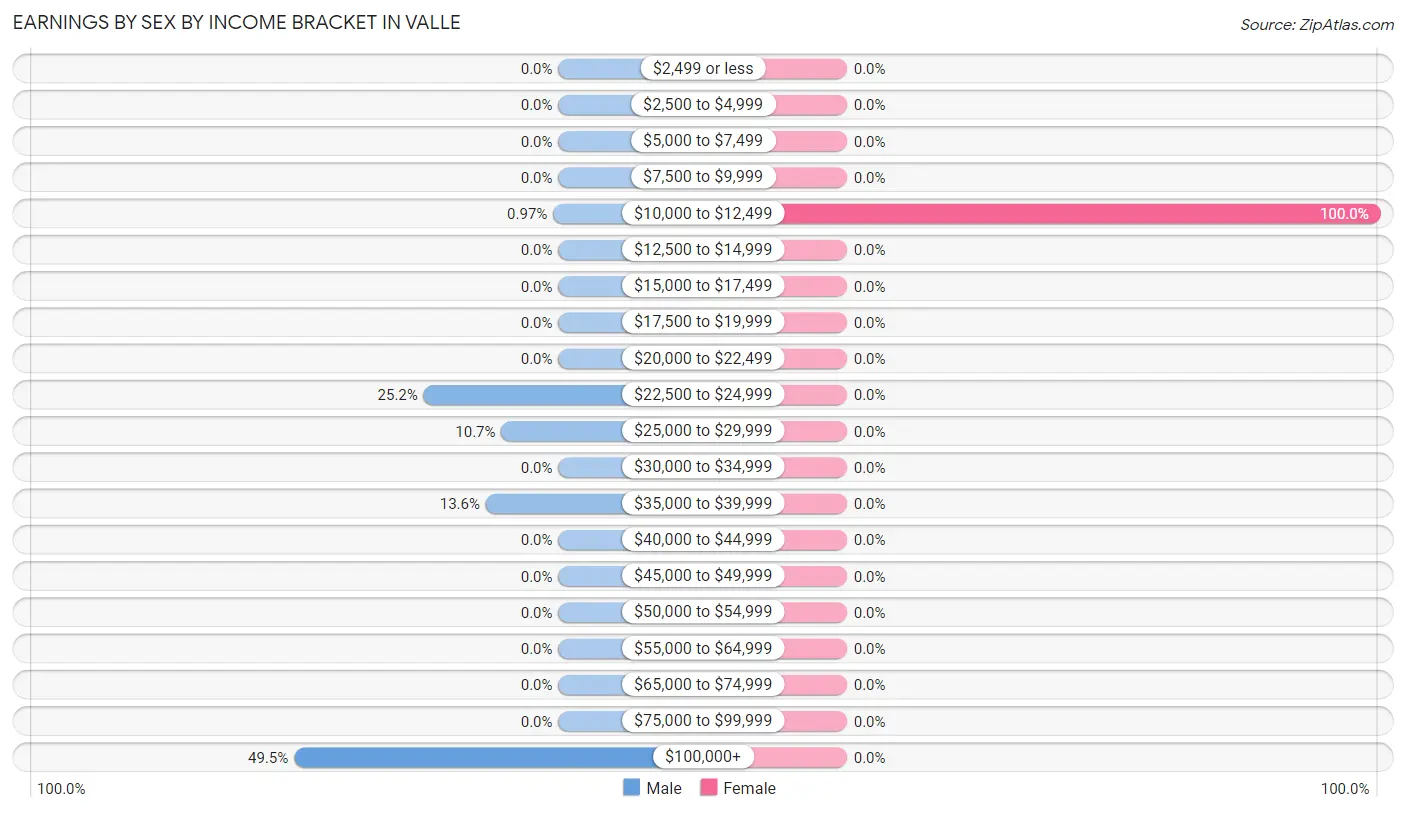
Earnings by Sex by Income Bracket in Valle
The most common earnings brackets in Valle are $100,000+ for men (51 | 49.5%) and $10,000 to $12,499 for women (1 | 100.0%).
| Income | Male | Female |
| $2,499 or less | 0 (0.0%) | 0 (0.0%) |
| $2,500 to $4,999 | 0 (0.0%) | 0 (0.0%) |
| $5,000 to $7,499 | 0 (0.0%) | 0 (0.0%) |
| $7,500 to $9,999 | 0 (0.0%) | 0 (0.0%) |
| $10,000 to $12,499 | 1 (1.0%) | 1 (100.0%) |
| $12,500 to $14,999 | 0 (0.0%) | 0 (0.0%) |
| $15,000 to $17,499 | 0 (0.0%) | 0 (0.0%) |
| $17,500 to $19,999 | 0 (0.0%) | 0 (0.0%) |
| $20,000 to $22,499 | 0 (0.0%) | 0 (0.0%) |
| $22,500 to $24,999 | 26 (25.2%) | 0 (0.0%) |
| $25,000 to $29,999 | 11 (10.7%) | 0 (0.0%) |
| $30,000 to $34,999 | 0 (0.0%) | 0 (0.0%) |
| $35,000 to $39,999 | 14 (13.6%) | 0 (0.0%) |
| $40,000 to $44,999 | 0 (0.0%) | 0 (0.0%) |
| $45,000 to $49,999 | 0 (0.0%) | 0 (0.0%) |
| $50,000 to $54,999 | 0 (0.0%) | 0 (0.0%) |
| $55,000 to $64,999 | 0 (0.0%) | 0 (0.0%) |
| $65,000 to $74,999 | 0 (0.0%) | 0 (0.0%) |
| $75,000 to $99,999 | 0 (0.0%) | 0 (0.0%) |
| $100,000+ | 51 (49.5%) | 0 (0.0%) |
| Total | 103 (100.0%) | 1 (100.0%) |
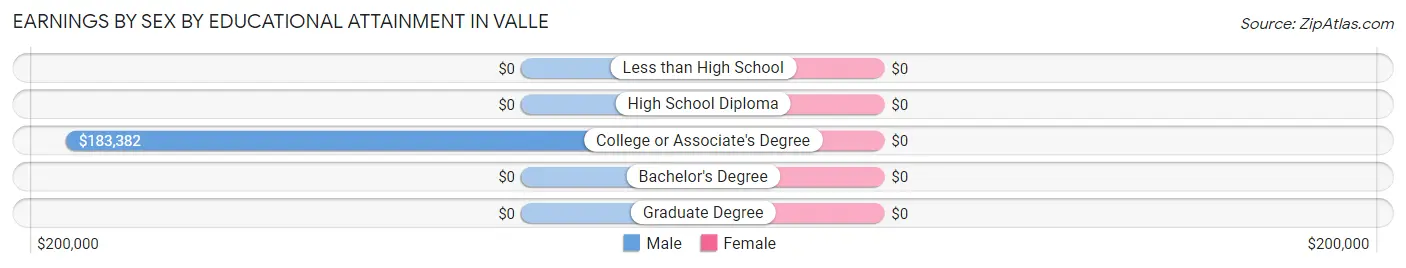
Earnings by Sex by Educational Attainment in Valle
| Educational Attainment | Male Income | Female Income |
| Less than High School | - | - |
| High School Diploma | - | - |
| College or Associate's Degree | $183,382 | $0 |
| Bachelor's Degree | - | - |
| Graduate Degree | - | - |
| Total | - | - |
Family Income in Valle
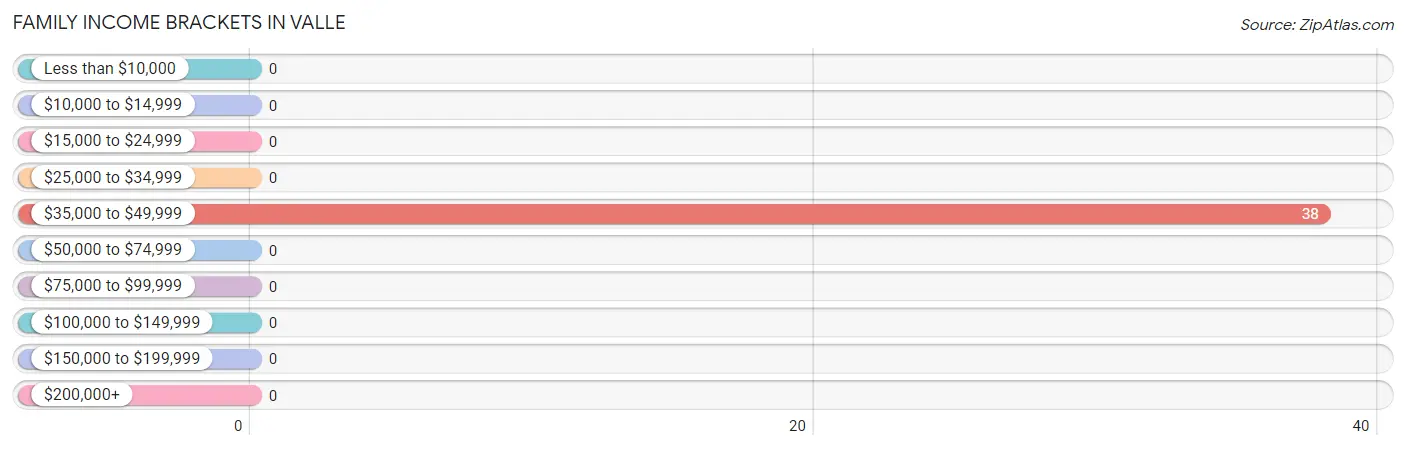
Family Income Brackets in Valle
According to the Valle family income data, there are 38 families falling into the $35,000 to $49,999 income range, which is the most common income bracket and makes up 100.0% of all families.
| Income Bracket | # Families | % Families |
| Less than $10,000 | 0 | 0.0% |
| $10,000 to $14,999 | 0 | 0.0% |
| $15,000 to $24,999 | 0 | 0.0% |
| $25,000 to $34,999 | 0 | 0.0% |
| $35,000 to $49,999 | 38 | 100.0% |
| $50,000 to $74,999 | 0 | 0.0% |
| $75,000 to $99,999 | 0 | 0.0% |
| $100,000 to $149,999 | 0 | 0.0% |
| $150,000 to $199,999 | 0 | 0.0% |
| $200,000+ | 0 | 0.0% |
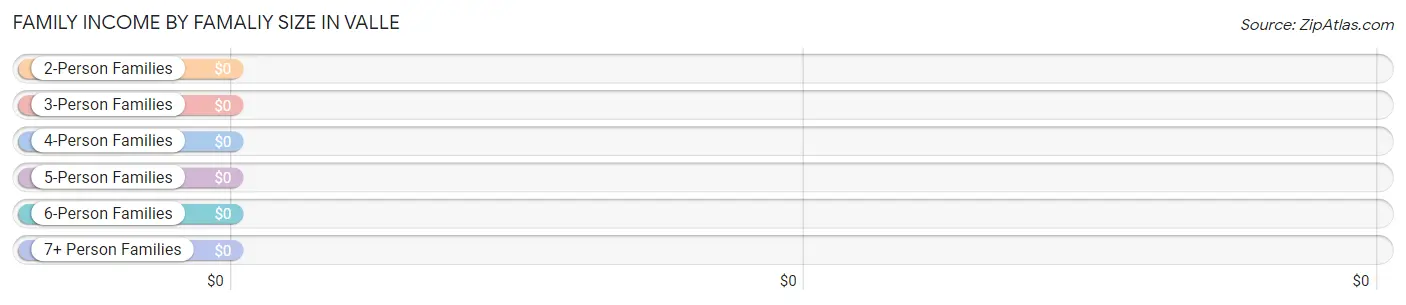
Family Income by Famaliy Size in Valle
| Income Bracket | # Families | Median Income |
| 2-Person Families | 38 (100.0%) | $0 |
| 3-Person Families | 0 (0.0%) | $0 |
| 4-Person Families | 0 (0.0%) | $0 |
| 5-Person Families | 0 (0.0%) | $0 |
| 6-Person Families | 0 (0.0%) | $0 |
| 7+ Person Families | 0 (0.0%) | $0 |
| Total | 38 (100.0%) | $0 |
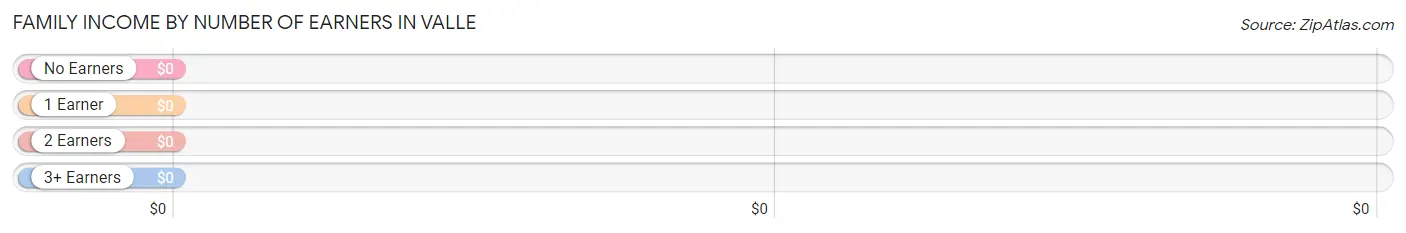
Family Income by Number of Earners in Valle
| Number of Earners | # Families | Median Income |
| No Earners | 38 (100.0%) | $0 |
| 1 Earner | 0 (0.0%) | $0 |
| 2 Earners | 0 (0.0%) | $0 |
| 3+ Earners | 0 (0.0%) | $0 |
| Total | 38 (100.0%) | $0 |
Household Income in Valle
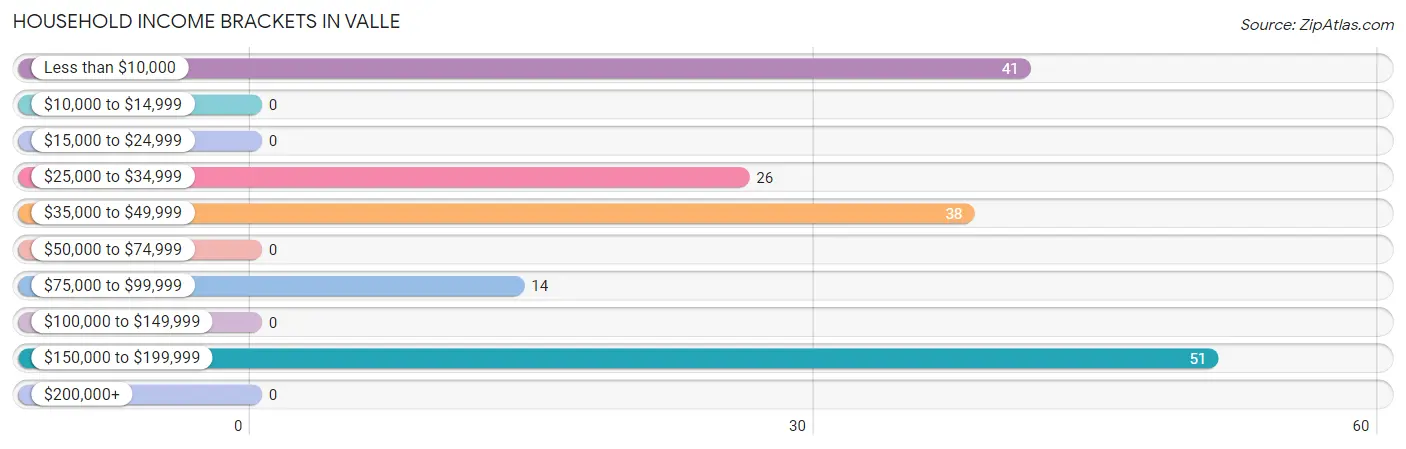
Household Income Brackets in Valle
With 51 households falling in the category, the $150,000 to $199,999 income range is the most frequent in Valle, accounting for 30.0% of all households.
| Income Bracket | # Households | % Households |
| Less than $10,000 | 41 | 24.1% |
| $10,000 to $14,999 | 0 | 0.0% |
| $15,000 to $24,999 | 0 | 0.0% |
| $25,000 to $34,999 | 26 | 15.3% |
| $35,000 to $49,999 | 38 | 22.4% |
| $50,000 to $74,999 | 0 | 0.0% |
| $75,000 to $99,999 | 14 | 8.2% |
| $100,000 to $149,999 | 0 | 0.0% |
| $150,000 to $199,999 | 51 | 30.0% |
| $200,000+ | 0 | 0.0% |
Household Income by Householder Age in Valle
| Income Bracket | # Households | Median Income |
| 15 to 24 Years | 0 (0.0%) | $0 |
| 25 to 44 Years | 51 (30.0%) | $0 |
| 45 to 64 Years | 97 (57.1%) | $0 |
| 65+ Years | 22 (12.9%) | $0 |
| Total | 170 (100.0%) | $0 |
Poverty in Valle
Income Below Poverty by Sex and Age in Valle
With 23.2% poverty level for males and 50.7% for females among the residents of Valle, 35 to 44 year old males and 35 to 44 year old females are the most vulnerable to poverty, with 1 males (100.0%) and 13 females (100.0%) in their respective age groups living below the poverty level.
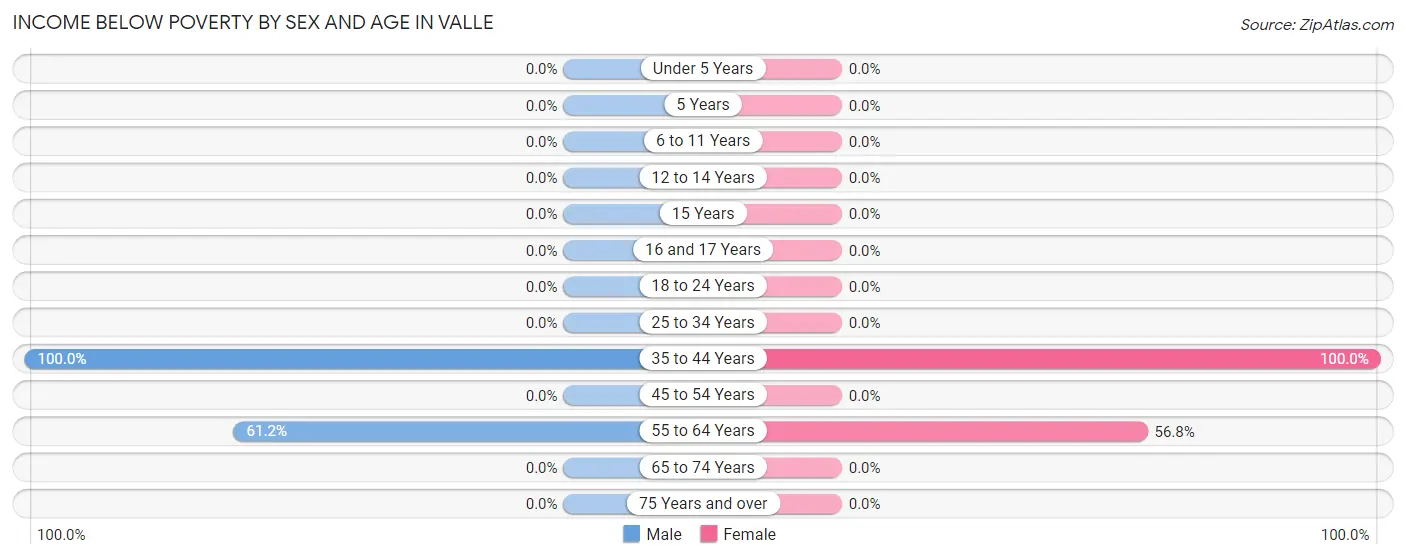
| Age Bracket | Male | Female |
| Under 5 Years | 0 (0.0%) | 0 (0.0%) |
| 5 Years | 0 (0.0%) | 0 (0.0%) |
| 6 to 11 Years | 0 (0.0%) | 0 (0.0%) |
| 12 to 14 Years | 0 (0.0%) | 0 (0.0%) |
| 15 Years | 0 (0.0%) | 0 (0.0%) |
| 16 and 17 Years | 0 (0.0%) | 0 (0.0%) |
| 18 to 24 Years | 0 (0.0%) | 0 (0.0%) |
| 25 to 34 Years | 0 (0.0%) | 0 (0.0%) |
| 35 to 44 Years | 1 (100.0%) | 13 (100.0%) |
| 45 to 54 Years | 0 (0.0%) | 0 (0.0%) |
| 55 to 64 Years | 41 (61.2%) | 21 (56.8%) |
| 65 to 74 Years | 0 (0.0%) | 0 (0.0%) |
| 75 Years and over | 0 (0.0%) | 0 (0.0%) |
| Total | 42 (23.2%) | 34 (50.7%) |
Income Above Poverty by Sex and Age in Valle
According to the poverty statistics in Valle, males aged 25 to 34 years and females aged 18 to 24 years are the age groups that are most secure financially, with 100.0% of males and 100.0% of females in these age groups living above the poverty line.
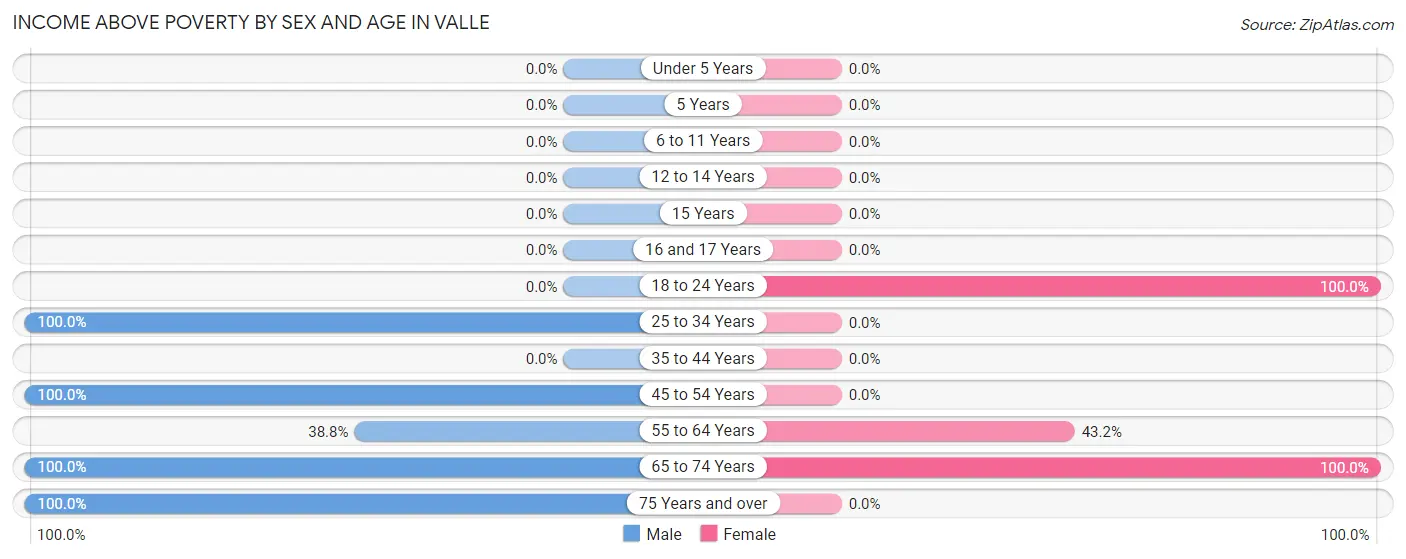
| Age Bracket | Male | Female |
| Under 5 Years | 0 (0.0%) | 0 (0.0%) |
| 5 Years | 0 (0.0%) | 0 (0.0%) |
| 6 to 11 Years | 0 (0.0%) | 0 (0.0%) |
| 12 to 14 Years | 0 (0.0%) | 0 (0.0%) |
| 15 Years | 0 (0.0%) | 0 (0.0%) |
| 16 and 17 Years | 0 (0.0%) | 0 (0.0%) |
| 18 to 24 Years | 0 (0.0%) | 1 (100.0%) |
| 25 to 34 Years | 51 (100.0%) | 0 (0.0%) |
| 35 to 44 Years | 0 (0.0%) | 0 (0.0%) |
| 45 to 54 Years | 25 (100.0%) | 0 (0.0%) |
| 55 to 64 Years | 26 (38.8%) | 16 (43.2%) |
| 65 to 74 Years | 15 (100.0%) | 16 (100.0%) |
| 75 Years and over | 22 (100.0%) | 0 (0.0%) |
| Total | 139 (76.8%) | 33 (49.2%) |
Income Below Poverty Among Married-Couple Families in Valle
| Children | Above Poverty | Below Poverty |
| No Children | 38 (100.0%) | 0 (0.0%) |
| 1 or 2 Children | 0 (0.0%) | 0 (0.0%) |
| 3 or 4 Children | 0 (0.0%) | 0 (0.0%) |
| 5 or more Children | 0 (0.0%) | 0 (0.0%) |
| Total | 38 (100.0%) | 0 (0.0%) |
Income Below Poverty Among Single-Parent Households in Valle
| Children | Single Father | Single Mother |
| No Children | 0 (0.0%) | 0 (0.0%) |
| 1 or 2 Children | 0 (0.0%) | 0 (0.0%) |
| 3 or 4 Children | 0 (0.0%) | 0 (0.0%) |
| 5 or more Children | 0 (0.0%) | 0 (0.0%) |
| Total | 0 (0.0%) | 0 (0.0%) |
Income Below Poverty Among Married-Couple vs Single-Parent Households in Valle
| Children | Married-Couple Families | Single-Parent Households |
| No Children | 0 (0.0%) | 0 (0.0%) |
| 1 or 2 Children | 0 (0.0%) | 0 (0.0%) |
| 3 or 4 Children | 0 (0.0%) | 0 (0.0%) |
| 5 or more Children | 0 (0.0%) | 0 (0.0%) |
| Total | 0 (0.0%) | 0 (0.0%) |
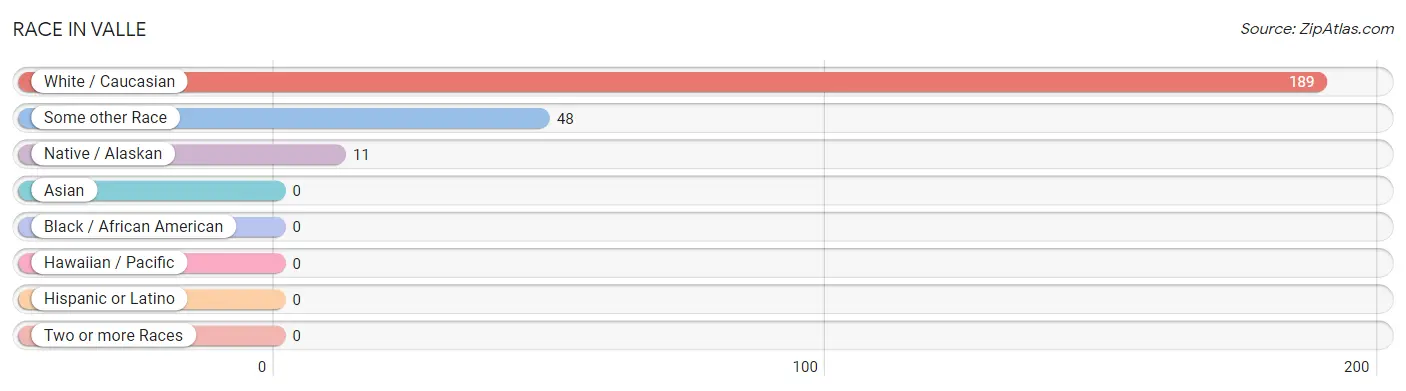
Race in Valle
The most populous races in Valle are White / Caucasian (189 | 76.2%), Some other Race (48 | 19.4%), and Native / Alaskan (11 | 4.4%).
| Race | # Population | % Population |
| Asian | 0 | 0.0% |
| Black / African American | 0 | 0.0% |
| Hawaiian / Pacific | 0 | 0.0% |
| Hispanic or Latino | 0 | 0.0% |
| Native / Alaskan | 11 | 4.4% |
| White / Caucasian | 189 | 76.2% |
| Two or more Races | 0 | 0.0% |
| Some other Race | 48 | 19.4% |
| Total | 248 | 100.0% |
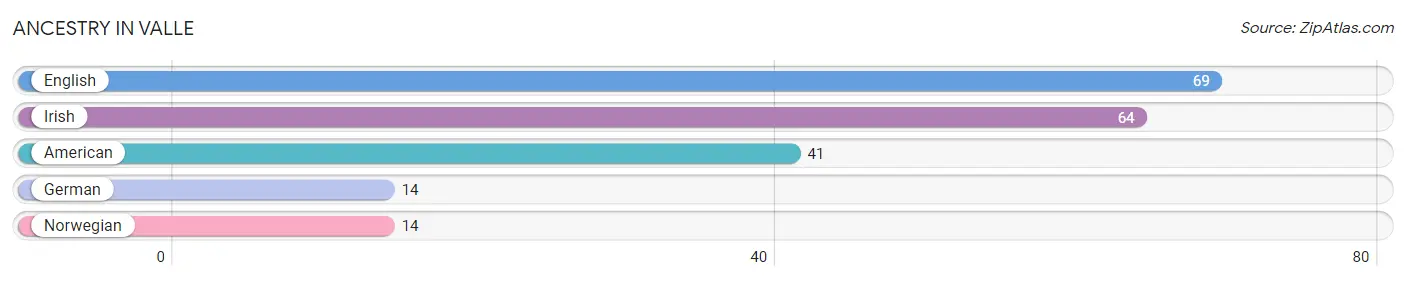
Ancestry in Valle
The most populous ancestries reported in Valle are English (69 | 27.8%), Irish (64 | 25.8%), American (41 | 16.5%), German (14 | 5.7%), and Norwegian (14 | 5.7%), together accounting for 81.5% of all Valle residents.
| Ancestry | # Population | % Population |
| American | 41 | 16.5% |
| English | 69 | 27.8% |
| German | 14 | 5.7% |
| Irish | 64 | 25.8% |
| Norwegian | 14 | 5.7% | View All 5 Rows |
Immigrants in Valle

| Immigration Origin | # Population | % Population | View All 0 Rows |
Sex and Age in Valle
Sex and Age in Valle
The most populous age groups in Valle are 60 to 64 Years (67 | 37.0%) for men and 60 to 64 Years (37 | 55.2%) for women.
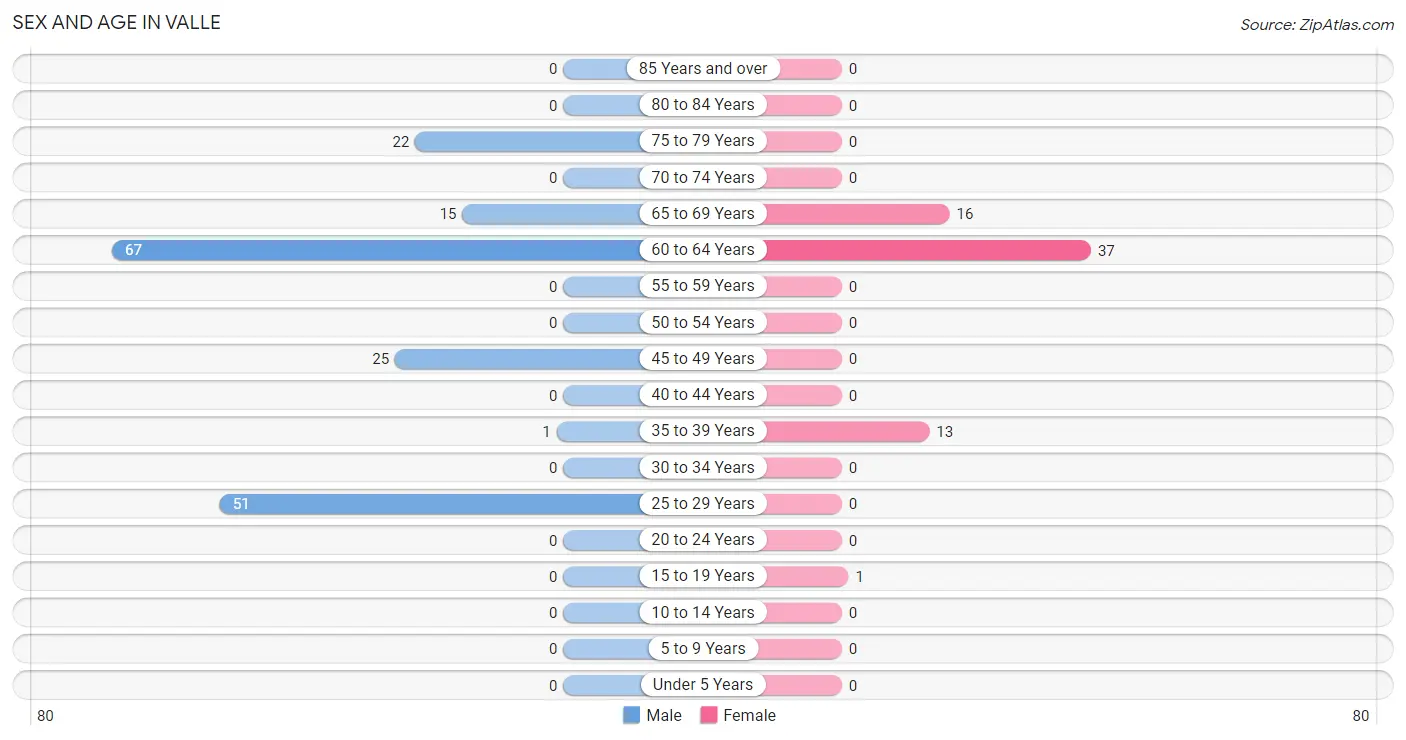
| Age Bracket | Male | Female |
| Under 5 Years | 0 (0.0%) | 0 (0.0%) |
| 5 to 9 Years | 0 (0.0%) | 0 (0.0%) |
| 10 to 14 Years | 0 (0.0%) | 0 (0.0%) |
| 15 to 19 Years | 0 (0.0%) | 1 (1.5%) |
| 20 to 24 Years | 0 (0.0%) | 0 (0.0%) |
| 25 to 29 Years | 51 (28.2%) | 0 (0.0%) |
| 30 to 34 Years | 0 (0.0%) | 0 (0.0%) |
| 35 to 39 Years | 1 (0.5%) | 13 (19.4%) |
| 40 to 44 Years | 0 (0.0%) | 0 (0.0%) |
| 45 to 49 Years | 25 (13.8%) | 0 (0.0%) |
| 50 to 54 Years | 0 (0.0%) | 0 (0.0%) |
| 55 to 59 Years | 0 (0.0%) | 0 (0.0%) |
| 60 to 64 Years | 67 (37.0%) | 37 (55.2%) |
| 65 to 69 Years | 15 (8.3%) | 16 (23.9%) |
| 70 to 74 Years | 0 (0.0%) | 0 (0.0%) |
| 75 to 79 Years | 22 (12.1%) | 0 (0.0%) |
| 80 to 84 Years | 0 (0.0%) | 0 (0.0%) |
| 85 Years and over | 0 (0.0%) | 0 (0.0%) |
| Total | 181 (100.0%) | 67 (100.0%) |
Families and Households in Valle
Median Family Size in Valle
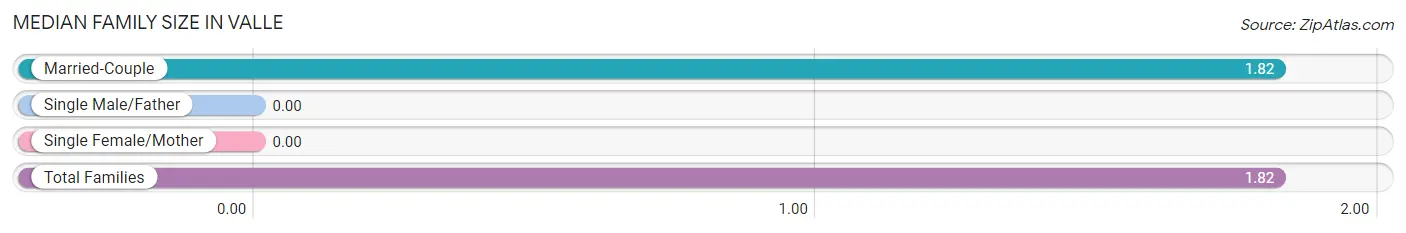
| Family Type | # Families | Family Size |
| Married-Couple | 38 (100.0%) | 1.82 |
| Single Male/Father | 0 (0.0%) | - |
| Single Female/Mother | 0 (0.0%) | - |
| Total Families | 38 (100.0%) | 1.82 |
Median Household Size in Valle
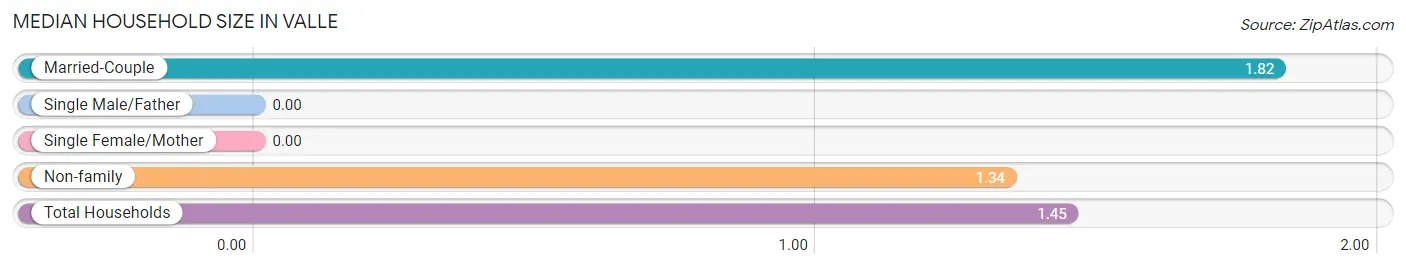
| Household Type | # Households | Household Size |
| Married-Couple | 38 (22.4%) | 1.82 |
| Single Male/Father | 0 (0.0%) | - |
| Single Female/Mother | 0 (0.0%) | - |
| Non-family | 132 (77.6%) | 1.34 |
| Total Households | 170 (100.0%) | 1.45 |
Household Size by Marriage Status in Valle
Out of a total of 170 households in Valle, 38 (22.4%) are family households, while 132 (77.6%) are nonfamily households. The most numerous type of family households are 2-person households, comprising 38, and the most common type of nonfamily households are 1-person households, comprising 92.
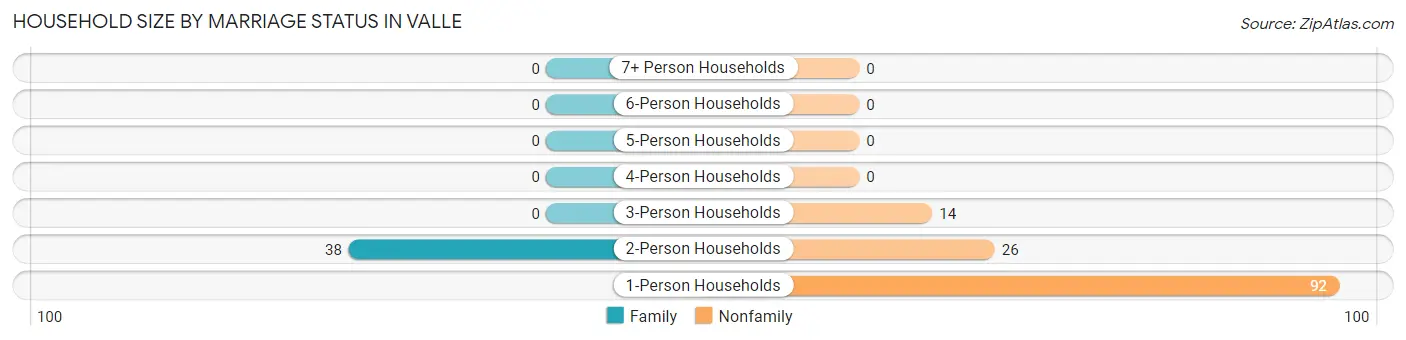
| Household Size | Family Households | Nonfamily Households |
| 1-Person Households | - | 92 (54.1%) |
| 2-Person Households | 38 (22.4%) | 26 (15.3%) |
| 3-Person Households | 0 (0.0%) | 14 (8.2%) |
| 4-Person Households | 0 (0.0%) | 0 (0.0%) |
| 5-Person Households | 0 (0.0%) | 0 (0.0%) |
| 6-Person Households | 0 (0.0%) | 0 (0.0%) |
| 7+ Person Households | 0 (0.0%) | 0 (0.0%) |
| Total | 38 (22.4%) | 132 (77.6%) |
Female Fertility in Valle
Fertility by Age in Valle
| Age Bracket | Women with Births | Births / 1,000 Women |
| 15 to 19 years | 0 (0.0%) | 0.0 |
| 20 to 34 years | 0 (0.0%) | 0.0 |
| 35 to 50 years | 0 (0.0%) | 0.0 |
| Total | 0 (0.0%) | 0.0 |
Fertility by Age by Marriage Status in Valle
| Age Bracket | Married | Unmarried |
| 15 to 19 years | 0 (0.0%) | 0 (0.0%) |
| 20 to 34 years | 0 (0.0%) | 0 (0.0%) |
| 35 to 50 years | 0 (0.0%) | 0 (0.0%) |
| Total | 0 (0.0%) | 0 (0.0%) |
Fertility by Education in Valle
| Educational Attainment | Women with Births | Births / 1,000 Women |
| Less than High School | 0 (0.0%) | 0.0 |
| High School Diploma | 0 (0.0%) | 0.0 |
| College or Associate's Degree | 0 (0.0%) | 0.0 |
| Bachelor's Degree | 0 (0.0%) | 0.0 |
| Graduate Degree | 0 (0.0%) | 0.0 |
| Total | 0 (0.0%) | 0.0 |
Fertility by Education by Marriage Status in Valle
| Educational Attainment | Married | Unmarried |
| Less than High School | 0 (0.0%) | 0 (0.0%) |
| High School Diploma | 0 (0.0%) | 0 (0.0%) |
| College or Associate's Degree | 0 (0.0%) | 0 (0.0%) |
| Bachelor's Degree | 0 (0.0%) | 0 (0.0%) |
| Graduate Degree | 0 (0.0%) | 0 (0.0%) |
| Total | 0 (0.0%) | 0 (0.0%) |
Employment Characteristics in Valle
Employment by Class of Employer in Valle
Among the 103 employed individuals in Valle, private company employees (77 | 74.8%), and self-employed (not incorporated) (26 | 25.2%) make up the most common classes of employment.
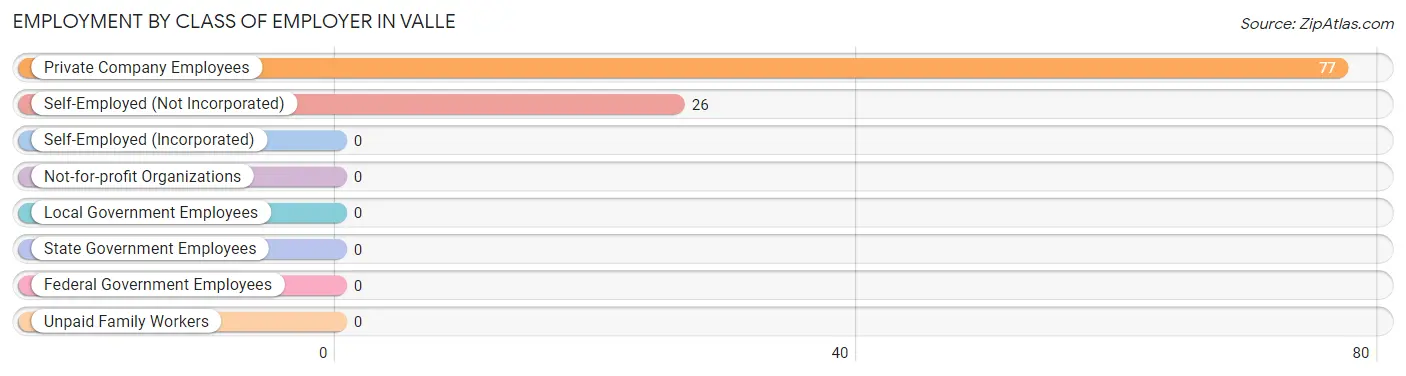
| Employer Class | # Employees | % Employees |
| Private Company Employees | 77 | 74.8% |
| Self-Employed (Incorporated) | 0 | 0.0% |
| Self-Employed (Not Incorporated) | 26 | 25.2% |
| Not-for-profit Organizations | 0 | 0.0% |
| Local Government Employees | 0 | 0.0% |
| State Government Employees | 0 | 0.0% |
| Federal Government Employees | 0 | 0.0% |
| Unpaid Family Workers | 0 | 0.0% |
| Total | 103 | 100.0% |
Employment Status by Age in Valle
According to the labor force statistics for Valle, out of the total population over 16 years of age (248), 41.9% or 104 individuals are in the labor force, with 1.0% or 1 of them unemployed. The age group with the highest labor force participation rate is 16 to 19 years, with 100.0% or 1 individuals in the labor force. Within the labor force, the 35 to 44 years age range has the highest percentage of unemployed individuals, with 100.0% or 1 of them being unemployed.
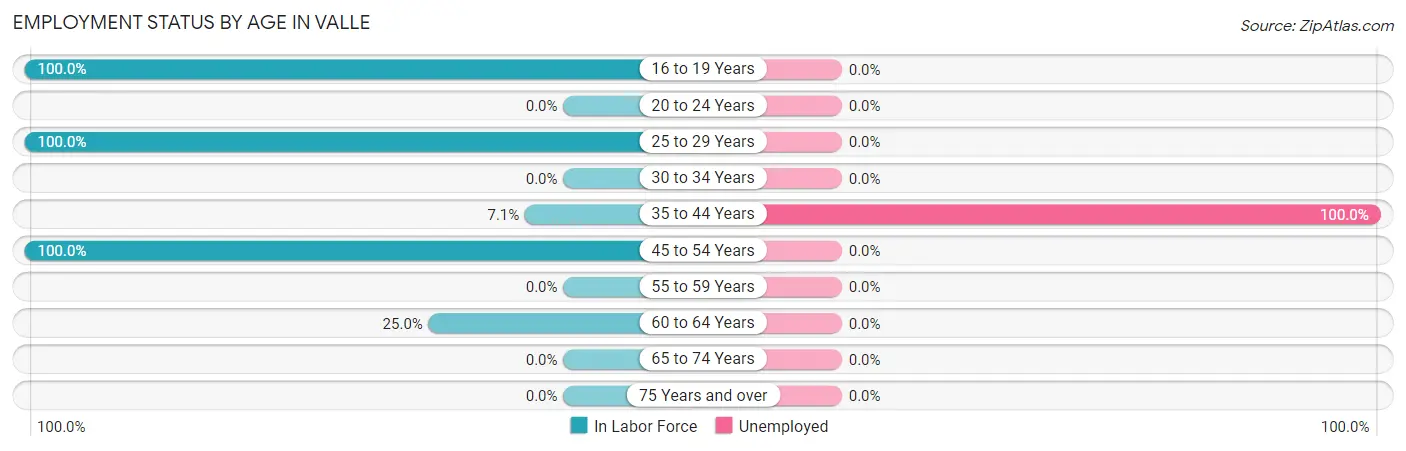
| Age Bracket | In Labor Force | Unemployed |
| 16 to 19 Years | 1 (100.0%) | 0 (0.0%) |
| 20 to 24 Years | 0 (0.0%) | 0 (0.0%) |
| 25 to 29 Years | 51 (100.0%) | 0 (0.0%) |
| 30 to 34 Years | 0 (0.0%) | 0 (0.0%) |
| 35 to 44 Years | 1 (7.1%) | 1 (100.0%) |
| 45 to 54 Years | 25 (100.0%) | 0 (0.0%) |
| 55 to 59 Years | 0 (0.0%) | 0 (0.0%) |
| 60 to 64 Years | 26 (25.0%) | 0 (0.0%) |
| 65 to 74 Years | 0 (0.0%) | 0 (0.0%) |
| 75 Years and over | 0 (0.0%) | 0 (0.0%) |
| Total | 104 (41.9%) | 1 (1.0%) |
Employment Status by Educational Attainment in Valle
According to labor force statistics for Valle, 53.1% of individuals (103) out of the total population between 25 and 64 years of age (194) are in the labor force, with 1.0% or 1 of them being unemployed. The group with the highest labor force participation rate are those with the educational attainment of college / associate degree, with 100.0% or 66 individuals in the labor force. Within the labor force, individuals with college / associate degree education have the highest percentage of unemployment, with 1.5% or 1 of them being unemployed.
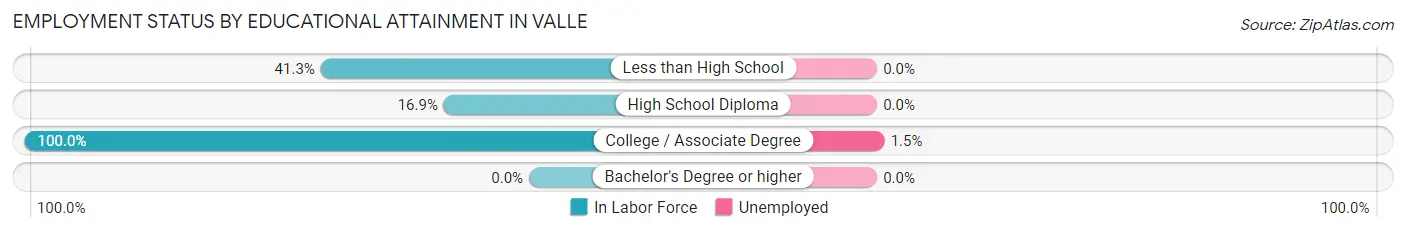
| Educational Attainment | In Labor Force | Unemployed |
| Less than High School | 26 (41.3%) | 0 (0.0%) |
| High School Diploma | 11 (16.9%) | 0 (0.0%) |
| College / Associate Degree | 66 (100.0%) | 1 (1.5%) |
| Bachelor's Degree or higher | 0 (0.0%) | 0 (0.0%) |
| Total | 103 (53.1%) | 2 (1.0%) |
Employment Occupations by Sex in Valle
Management, Business, Science and Arts Occupations
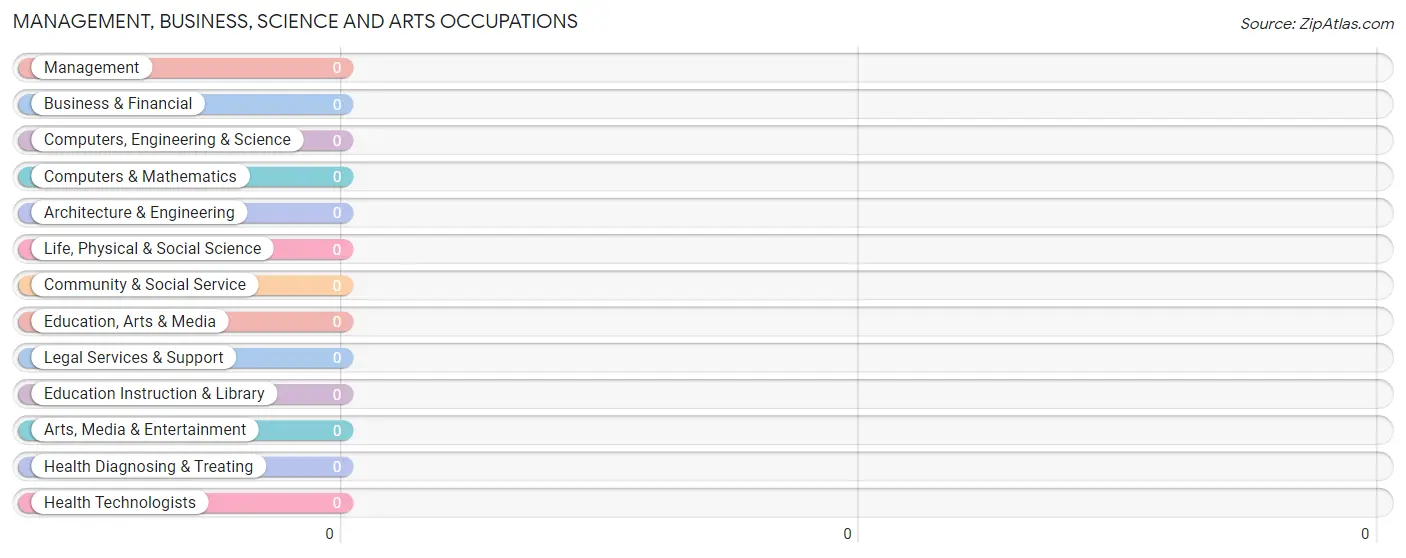
Management, Business, Science and Arts Occupations by Sex
| Occupation | Male | Female |
| Management | 0 (0.0%) | 0 (0.0%) |
| Business & Financial | 0 (0.0%) | 0 (0.0%) |
| Computers, Engineering & Science | 0 (0.0%) | 0 (0.0%) |
| Computers & Mathematics | 0 (0.0%) | 0 (0.0%) |
| Architecture & Engineering | 0 (0.0%) | 0 (0.0%) |
| Life, Physical & Social Science | 0 (0.0%) | 0 (0.0%) |
| Community & Social Service | 0 (0.0%) | 0 (0.0%) |
| Education, Arts & Media | 0 (0.0%) | 0 (0.0%) |
| Legal Services & Support | 0 (0.0%) | 0 (0.0%) |
| Education Instruction & Library | 0 (0.0%) | 0 (0.0%) |
| Arts, Media & Entertainment | 0 (0.0%) | 0 (0.0%) |
| Health Diagnosing & Treating | 0 (0.0%) | 0 (0.0%) |
| Health Technologists | 0 (0.0%) | 0 (0.0%) |
| Total (Category) | 0 (0.0%) | 0 (0.0%) |
| Total (Overall) | 102 (99.0%) | 1 (1.0%) |
Services Occupations
Services Occupations by Sex
| Occupation | Male | Female |
| Healthcare Support | 0 (0.0%) | 0 (0.0%) |
| Security & Protection | 0 (0.0%) | 0 (0.0%) |
| Firefighting & Prevention | 0 (0.0%) | 0 (0.0%) |
| Law Enforcement | 0 (0.0%) | 0 (0.0%) |
| Food Preparation & Serving | 0 (0.0%) | 0 (0.0%) |
| Cleaning & Maintenance | 0 (0.0%) | 0 (0.0%) |
| Personal Care & Service | 0 (0.0%) | 0 (0.0%) |
| Total (Category) | 0 (0.0%) | 0 (0.0%) |
| Total (Overall) | 102 (99.0%) | 1 (1.0%) |
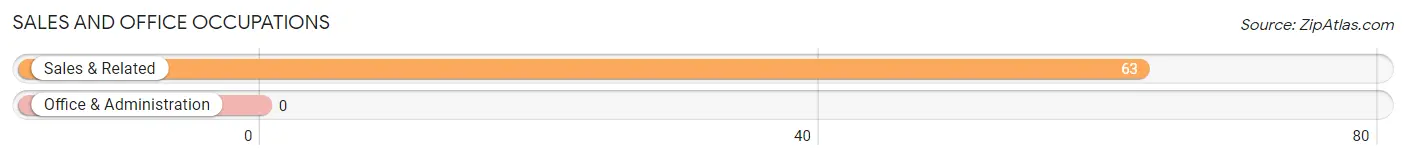
Sales and Office Occupations
The most common Sales and Office occupations in Valle are , and Sales & Related (63 | 61.2%).
Sales and Office Occupations by Sex
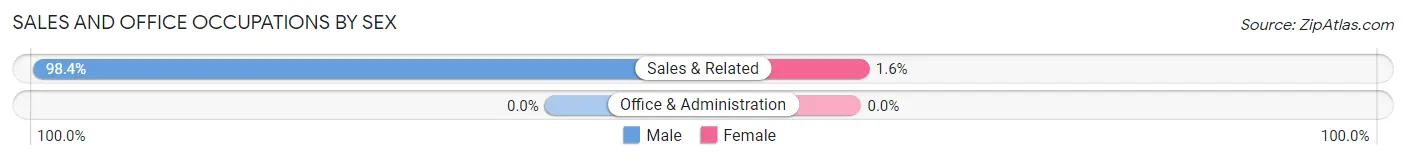
| Occupation | Male | Female |
| Sales & Related | 62 (98.4%) | 1 (1.6%) |
| Office & Administration | 0 (0.0%) | 0 (0.0%) |
| Total (Category) | 62 (98.4%) | 1 (1.6%) |
| Total (Overall) | 102 (99.0%) | 1 (1.0%) |
Natural Resources, Construction and Maintenance Occupations
The most common Natural Resources, Construction and Maintenance occupations in Valle are Construction & Extraction (26 | 25.2%), and Installation, Maintenance & Repair (14 | 13.6%).
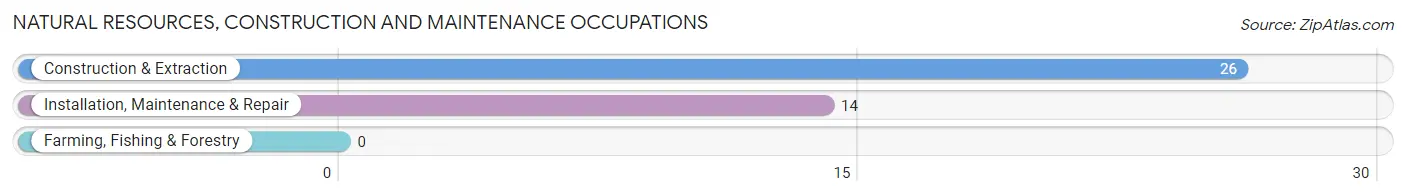
Natural Resources, Construction and Maintenance Occupations by Sex
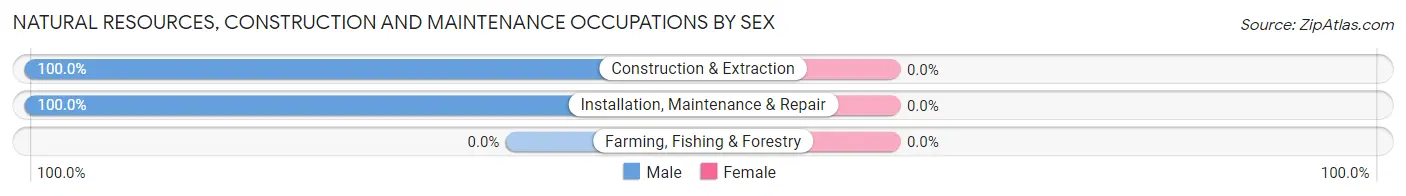
| Occupation | Male | Female |
| Farming, Fishing & Forestry | 0 (0.0%) | 0 (0.0%) |
| Construction & Extraction | 26 (100.0%) | 0 (0.0%) |
| Installation, Maintenance & Repair | 14 (100.0%) | 0 (0.0%) |
| Total (Category) | 40 (100.0%) | 0 (0.0%) |
| Total (Overall) | 102 (99.0%) | 1 (1.0%) |
Production, Transportation and Moving Occupations
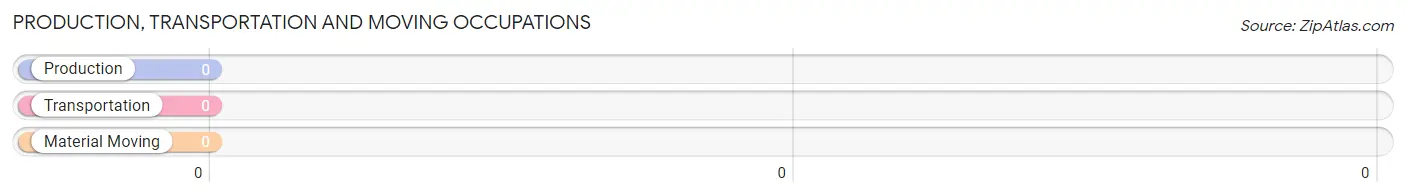
Production, Transportation and Moving Occupations by Sex
| Occupation | Male | Female |
| Production | 0 (0.0%) | 0 (0.0%) |
| Transportation | 0 (0.0%) | 0 (0.0%) |
| Material Moving | 0 (0.0%) | 0 (0.0%) |
| Total (Category) | 0 (0.0%) | 0 (0.0%) |
| Total (Overall) | 102 (99.0%) | 1 (1.0%) |
Employment Industries by Sex in Valle
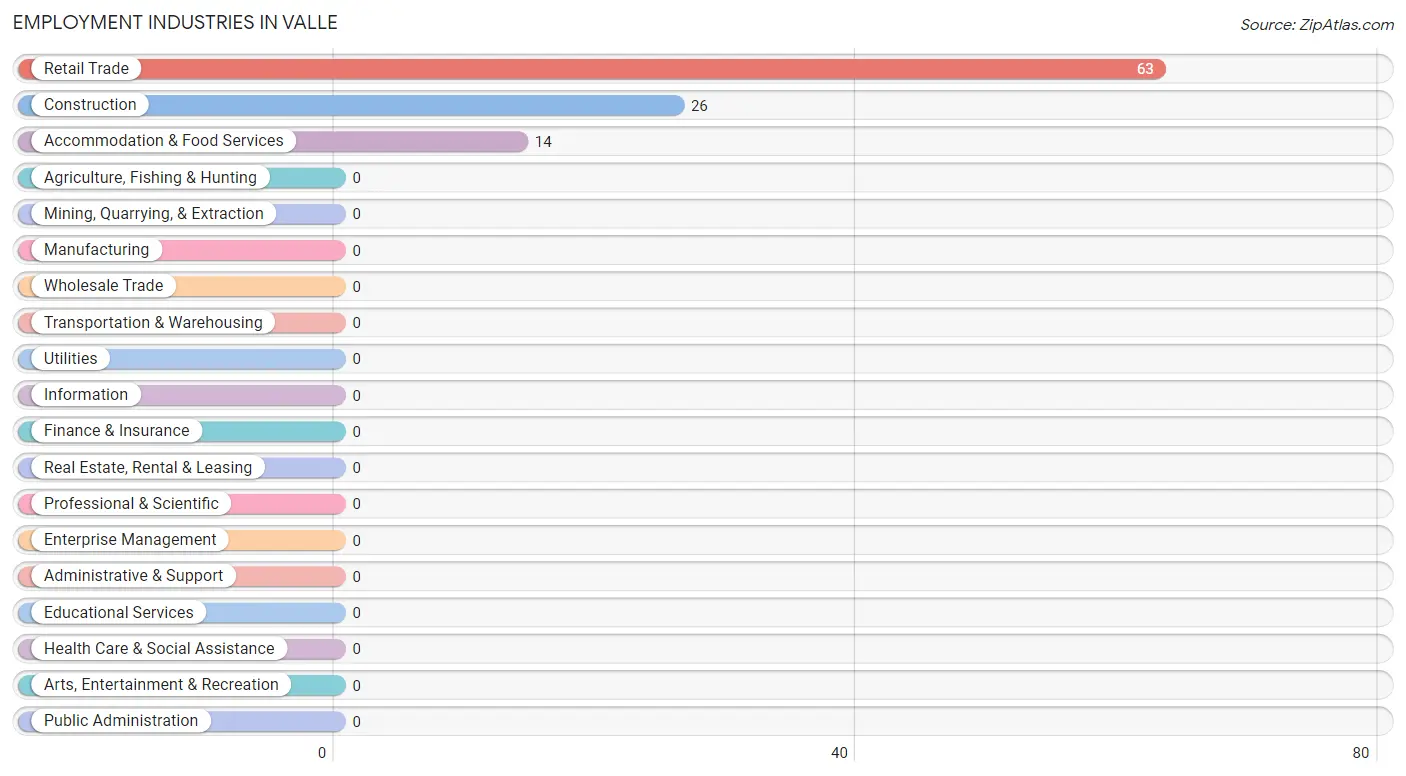
Employment Industries in Valle
The major employment industries in Valle include Retail Trade (63 | 61.2%), Construction (26 | 25.2%), and Accommodation & Food Services (14 | 13.6%).
Employment Industries by Sex in Valle
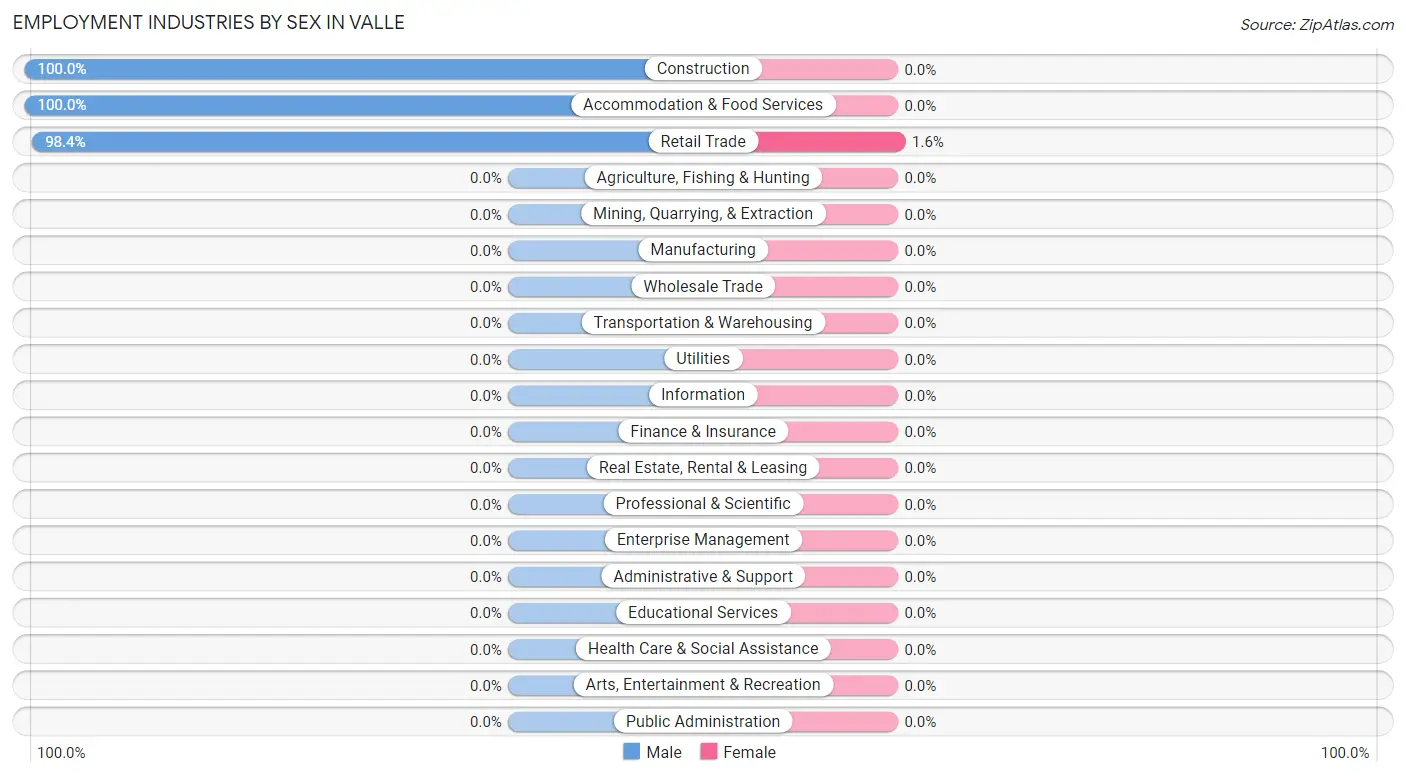
| Industry | Male | Female |
| Agriculture, Fishing & Hunting | 0 (0.0%) | 0 (0.0%) |
| Mining, Quarrying, & Extraction | 0 (0.0%) | 0 (0.0%) |
| Construction | 26 (100.0%) | 0 (0.0%) |
| Manufacturing | 0 (0.0%) | 0 (0.0%) |
| Wholesale Trade | 0 (0.0%) | 0 (0.0%) |
| Retail Trade | 62 (98.4%) | 1 (1.6%) |
| Transportation & Warehousing | 0 (0.0%) | 0 (0.0%) |
| Utilities | 0 (0.0%) | 0 (0.0%) |
| Information | 0 (0.0%) | 0 (0.0%) |
| Finance & Insurance | 0 (0.0%) | 0 (0.0%) |
| Real Estate, Rental & Leasing | 0 (0.0%) | 0 (0.0%) |
| Professional & Scientific | 0 (0.0%) | 0 (0.0%) |
| Enterprise Management | 0 (0.0%) | 0 (0.0%) |
| Administrative & Support | 0 (0.0%) | 0 (0.0%) |
| Educational Services | 0 (0.0%) | 0 (0.0%) |
| Health Care & Social Assistance | 0 (0.0%) | 0 (0.0%) |
| Arts, Entertainment & Recreation | 0 (0.0%) | 0 (0.0%) |
| Accommodation & Food Services | 14 (100.0%) | 0 (0.0%) |
| Public Administration | 0 (0.0%) | 0 (0.0%) |
| Total | 102 (99.0%) | 1 (1.0%) |
Education in Valle
School Enrollment in Valle
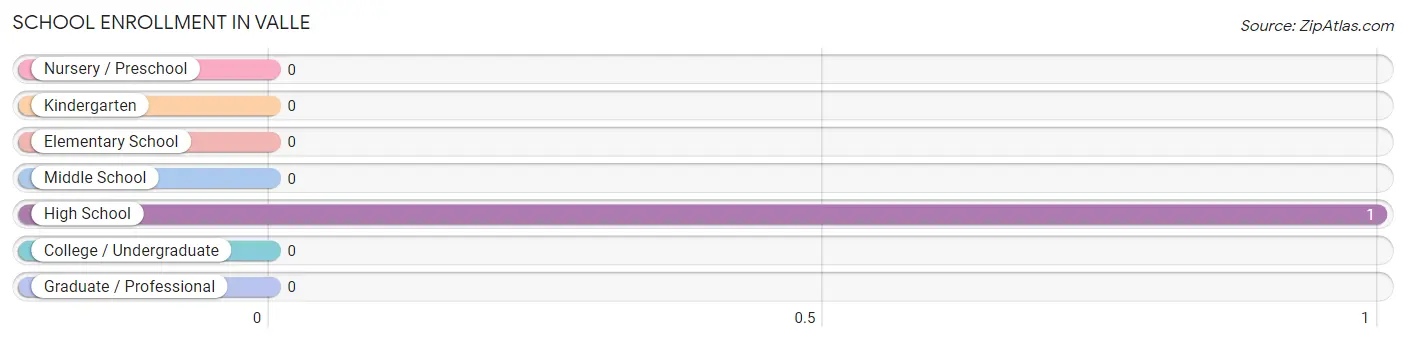
| School Level | # Students | % Students |
| Nursery / Preschool | 0 | 0.0% |
| Kindergarten | 0 | 0.0% |
| Elementary School | 0 | 0.0% |
| Middle School | 0 | 0.0% |
| High School | 1 | 100.0% |
| College / Undergraduate | 0 | 0.0% |
| Graduate / Professional | 0 | 0.0% |
| Total | 1 | 100.0% |
School Enrollment by Age by Funding Source in Valle
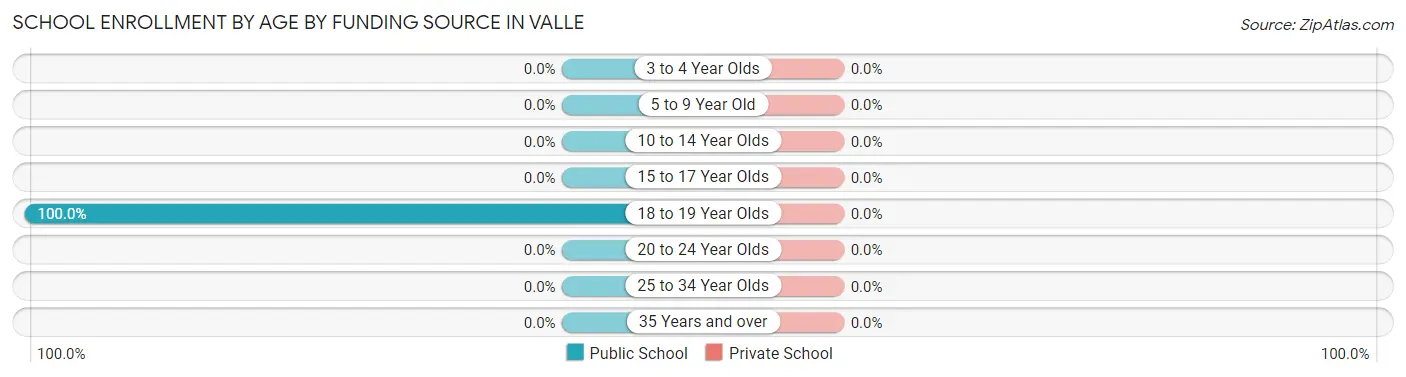
| Age Bracket | Public School | Private School |
| 3 to 4 Year Olds | 0 (0.0%) | 0 (0.0%) |
| 5 to 9 Year Old | 0 (0.0%) | 0 (0.0%) |
| 10 to 14 Year Olds | 0 (0.0%) | 0 (0.0%) |
| 15 to 17 Year Olds | 0 (0.0%) | 0 (0.0%) |
| 18 to 19 Year Olds | 1 (100.0%) | 0 (0.0%) |
| 20 to 24 Year Olds | 0 (0.0%) | 0 (0.0%) |
| 25 to 34 Year Olds | 0 (0.0%) | 0 (0.0%) |
| 35 Years and over | 0 (0.0%) | 0 (0.0%) |
| Total | 1 (100.0%) | 0 (0.0%) |
Educational Attainment by Field of Study in Valle
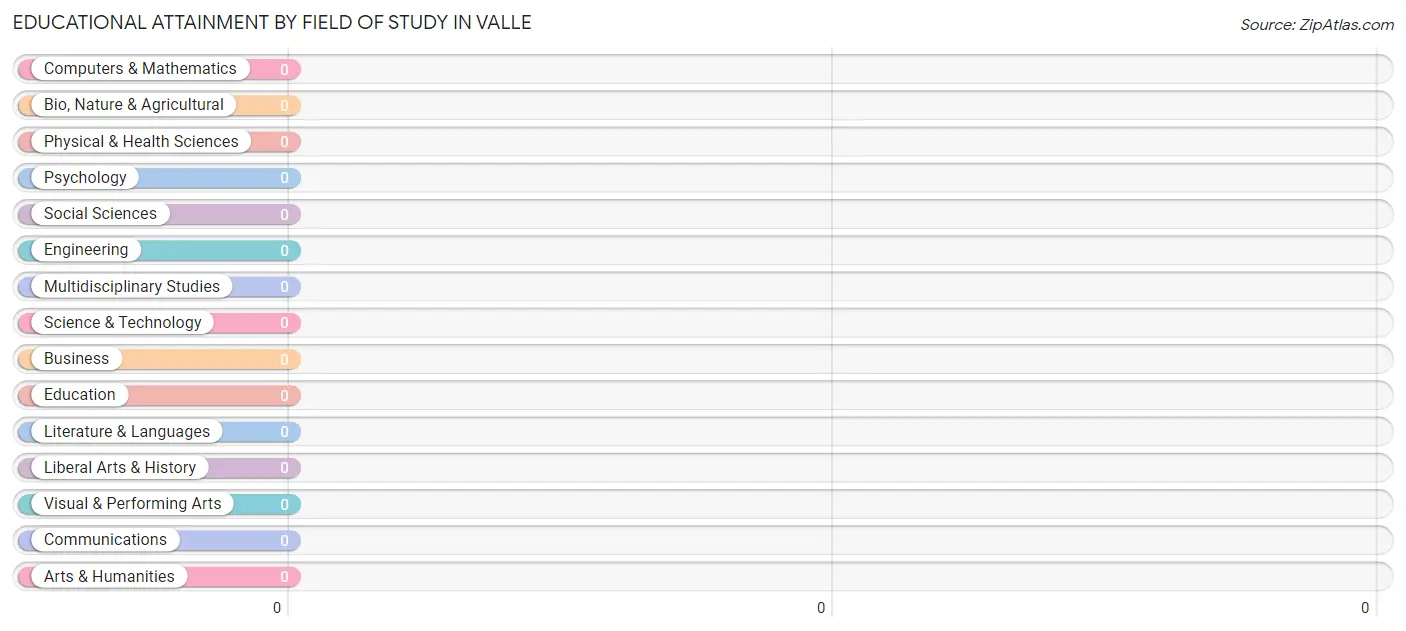
| Field of Study | # Graduates | % Graduates |
| Computers & Mathematics | 0 | 0.0% |
| Bio, Nature & Agricultural | 0 | 0.0% |
| Physical & Health Sciences | 0 | 0.0% |
| Psychology | 0 | 0.0% |
| Social Sciences | 0 | 0.0% |
| Engineering | 0 | 0.0% |
| Multidisciplinary Studies | 0 | 0.0% |
| Science & Technology | 0 | 0.0% |
| Business | 0 | 0.0% |
| Education | 0 | 0.0% |
| Literature & Languages | 0 | 0.0% |
| Liberal Arts & History | 0 | 0.0% |
| Visual & Performing Arts | 0 | 0.0% |
| Communications | 0 | 0.0% |
| Arts & Humanities | 0 | 0.0% |
| Total | 0 | 0.0% |
Transportation & Commute in Valle
Vehicle Availability by Sex in Valle
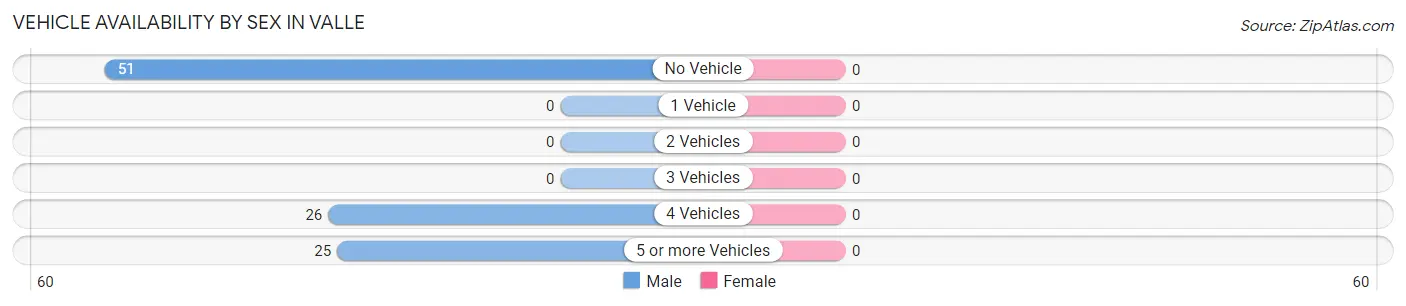
| Vehicles Available | Male | Female |
| No Vehicle | 51 (50.0%) | 0 (0.0%) |
| 1 Vehicle | 0 (0.0%) | 0 (0.0%) |
| 2 Vehicles | 0 (0.0%) | 0 (0.0%) |
| 3 Vehicles | 0 (0.0%) | 0 (0.0%) |
| 4 Vehicles | 26 (25.5%) | 0 (0.0%) |
| 5 or more Vehicles | 25 (24.5%) | 0 (0.0%) |
| Total | 102 (100.0%) | 0 (0.0%) |
Commute Time in Valle
The most frequently occuring commute durations in Valle are less than 5 minutes (51 commuters, 49.5%), 10 to 14 minutes (26 commuters, 25.2%), and 45 to 59 minutes (25 commuters, 24.3%).
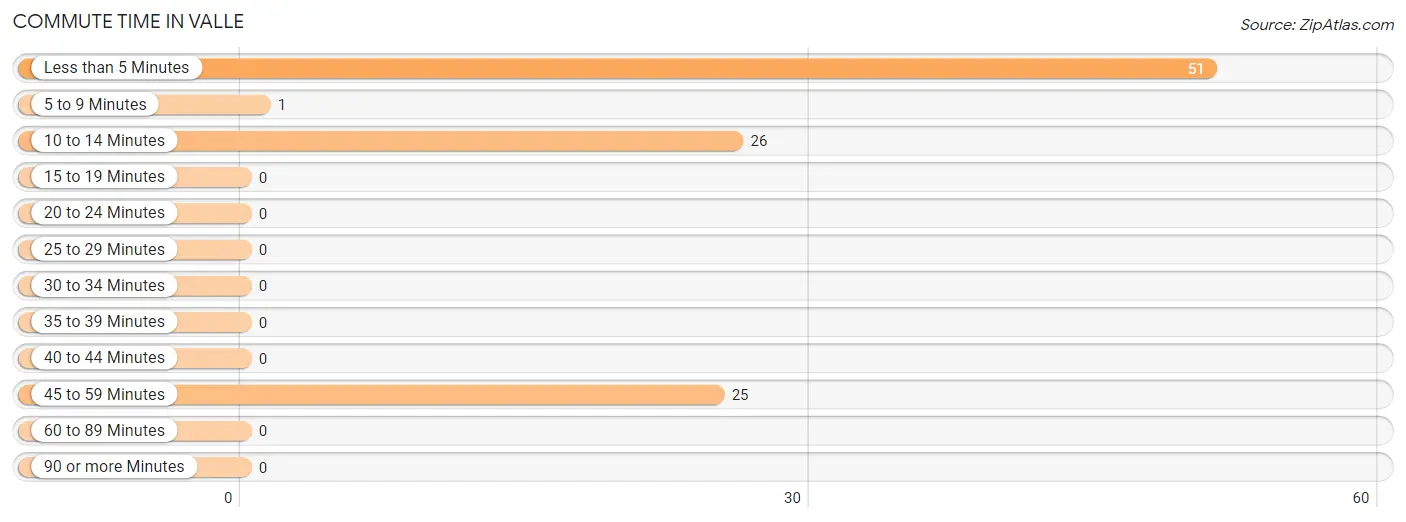
| Commute Time | # Commuters | % Commuters |
| Less than 5 Minutes | 51 | 49.5% |
| 5 to 9 Minutes | 1 | 1.0% |
| 10 to 14 Minutes | 26 | 25.2% |
| 15 to 19 Minutes | 0 | 0.0% |
| 20 to 24 Minutes | 0 | 0.0% |
| 25 to 29 Minutes | 0 | 0.0% |
| 30 to 34 Minutes | 0 | 0.0% |
| 35 to 39 Minutes | 0 | 0.0% |
| 40 to 44 Minutes | 0 | 0.0% |
| 45 to 59 Minutes | 25 | 24.3% |
| 60 to 89 Minutes | 0 | 0.0% |
| 90 or more Minutes | 0 | 0.0% |
Commute Time by Sex in Valle
The most common commute times in Valle are less than 5 minutes (51 commuters, 50.0%) for males and 5 to 9 minutes (1 commuters, 100.0%) for females.
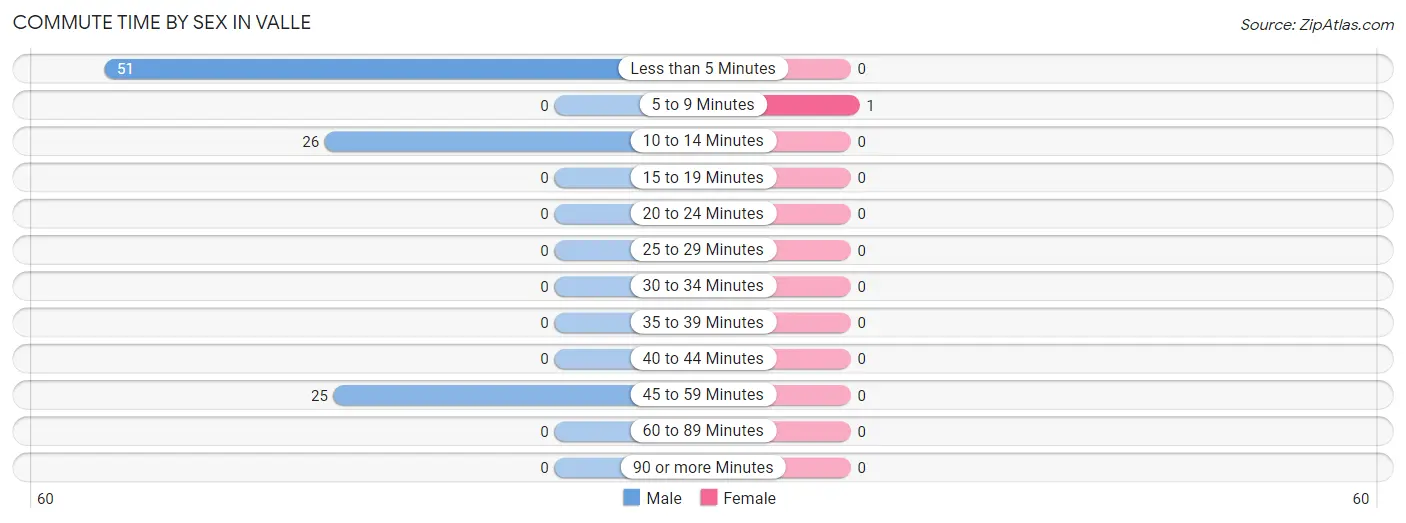
| Commute Time | Male | Female |
| Less than 5 Minutes | 51 (50.0%) | 0 (0.0%) |
| 5 to 9 Minutes | 0 (0.0%) | 1 (100.0%) |
| 10 to 14 Minutes | 26 (25.5%) | 0 (0.0%) |
| 15 to 19 Minutes | 0 (0.0%) | 0 (0.0%) |
| 20 to 24 Minutes | 0 (0.0%) | 0 (0.0%) |
| 25 to 29 Minutes | 0 (0.0%) | 0 (0.0%) |
| 30 to 34 Minutes | 0 (0.0%) | 0 (0.0%) |
| 35 to 39 Minutes | 0 (0.0%) | 0 (0.0%) |
| 40 to 44 Minutes | 0 (0.0%) | 0 (0.0%) |
| 45 to 59 Minutes | 25 (24.5%) | 0 (0.0%) |
| 60 to 89 Minutes | 0 (0.0%) | 0 (0.0%) |
| 90 or more Minutes | 0 (0.0%) | 0 (0.0%) |
Time of Departure to Work by Sex in Valle
The most frequent times of departure to work in Valle are 8:00 AM to 8:29 AM (51, 50.0%) for males and 7:30 AM to 7:59 AM (1, 100.0%) for females.
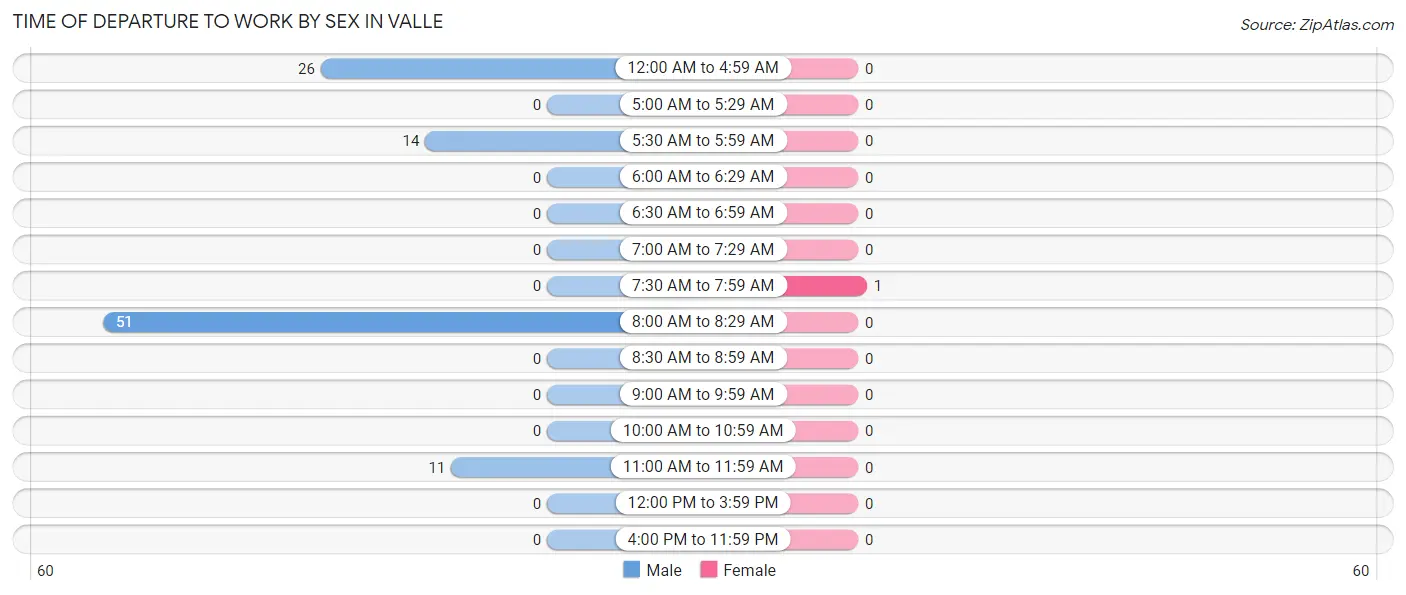
| Time of Departure | Male | Female |
| 12:00 AM to 4:59 AM | 26 (25.5%) | 0 (0.0%) |
| 5:00 AM to 5:29 AM | 0 (0.0%) | 0 (0.0%) |
| 5:30 AM to 5:59 AM | 14 (13.7%) | 0 (0.0%) |
| 6:00 AM to 6:29 AM | 0 (0.0%) | 0 (0.0%) |
| 6:30 AM to 6:59 AM | 0 (0.0%) | 0 (0.0%) |
| 7:00 AM to 7:29 AM | 0 (0.0%) | 0 (0.0%) |
| 7:30 AM to 7:59 AM | 0 (0.0%) | 1 (100.0%) |
| 8:00 AM to 8:29 AM | 51 (50.0%) | 0 (0.0%) |
| 8:30 AM to 8:59 AM | 0 (0.0%) | 0 (0.0%) |
| 9:00 AM to 9:59 AM | 0 (0.0%) | 0 (0.0%) |
| 10:00 AM to 10:59 AM | 0 (0.0%) | 0 (0.0%) |
| 11:00 AM to 11:59 AM | 11 (10.8%) | 0 (0.0%) |
| 12:00 PM to 3:59 PM | 0 (0.0%) | 0 (0.0%) |
| 4:00 PM to 11:59 PM | 0 (0.0%) | 0 (0.0%) |
| Total | 102 (100.0%) | 1 (100.0%) |
Housing Occupancy in Valle
Occupancy by Ownership in Valle
Of the total 170 dwellings in Valle, owner-occupied units account for 119 (70.0%), while renter-occupied units make up 51 (30.0%).
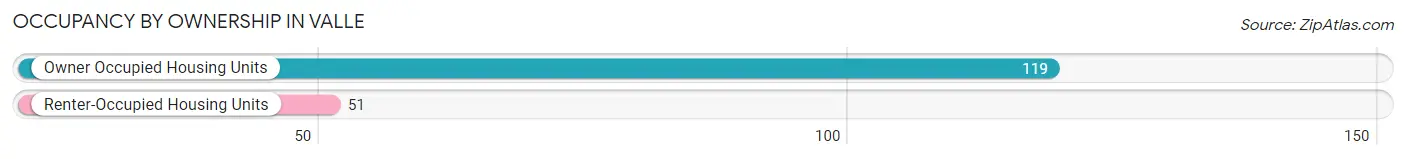
| Occupancy | # Housing Units | % Housing Units |
| Owner Occupied Housing Units | 119 | 70.0% |
| Renter-Occupied Housing Units | 51 | 30.0% |
| Total Occupied Housing Units | 170 | 100.0% |
Occupancy by Household Size in Valle
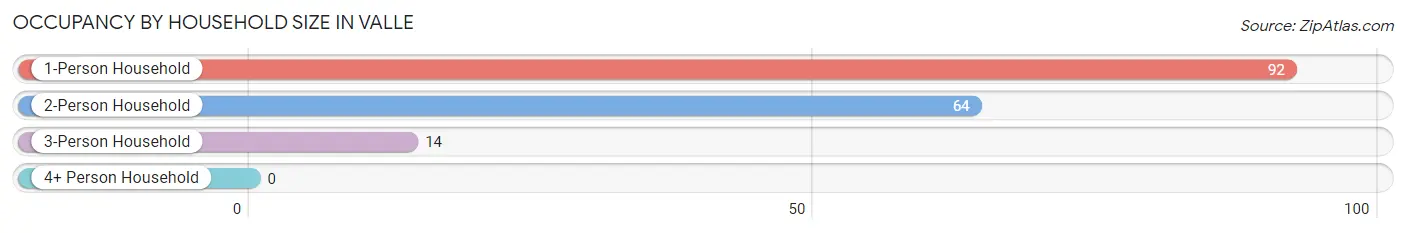
| Household Size | # Housing Units | % Housing Units |
| 1-Person Household | 92 | 54.1% |
| 2-Person Household | 64 | 37.7% |
| 3-Person Household | 14 | 8.2% |
| 4+ Person Household | 0 | 0.0% |
| Total Housing Units | 170 | 100.0% |
Occupancy by Ownership by Household Size in Valle
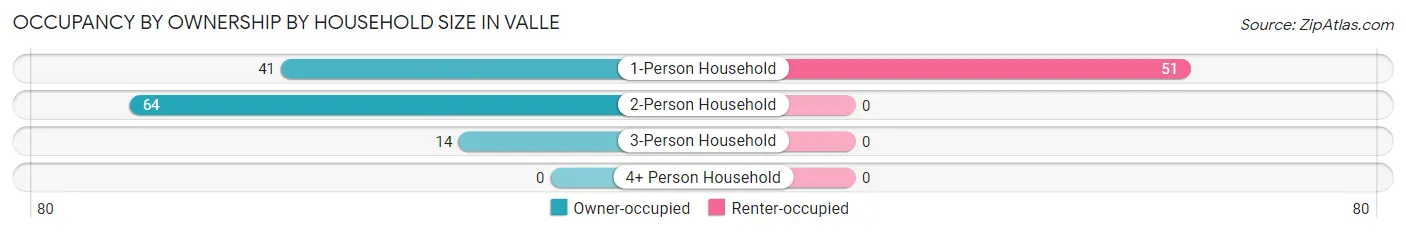
| Household Size | Owner-occupied | Renter-occupied |
| 1-Person Household | 41 (44.6%) | 51 (55.4%) |
| 2-Person Household | 64 (100.0%) | 0 (0.0%) |
| 3-Person Household | 14 (100.0%) | 0 (0.0%) |
| 4+ Person Household | 0 (0.0%) | 0 (0.0%) |
| Total Housing Units | 119 (70.0%) | 51 (30.0%) |
Occupancy by Educational Attainment in Valle
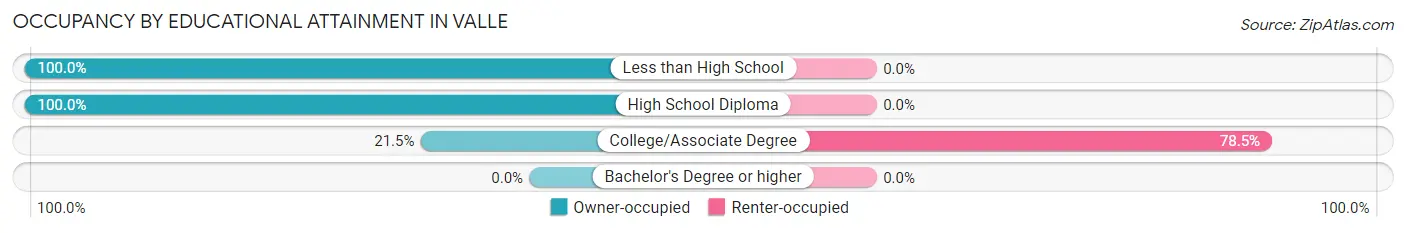
| Household Size | Owner-occupied | Renter-occupied |
| Less than High School | 42 (100.0%) | 0 (0.0%) |
| High School Diploma | 63 (100.0%) | 0 (0.0%) |
| College/Associate Degree | 14 (21.5%) | 51 (78.5%) |
| Bachelor's Degree or higher | 0 (0.0%) | 0 (0.0%) |
Occupancy by Age of Householder in Valle
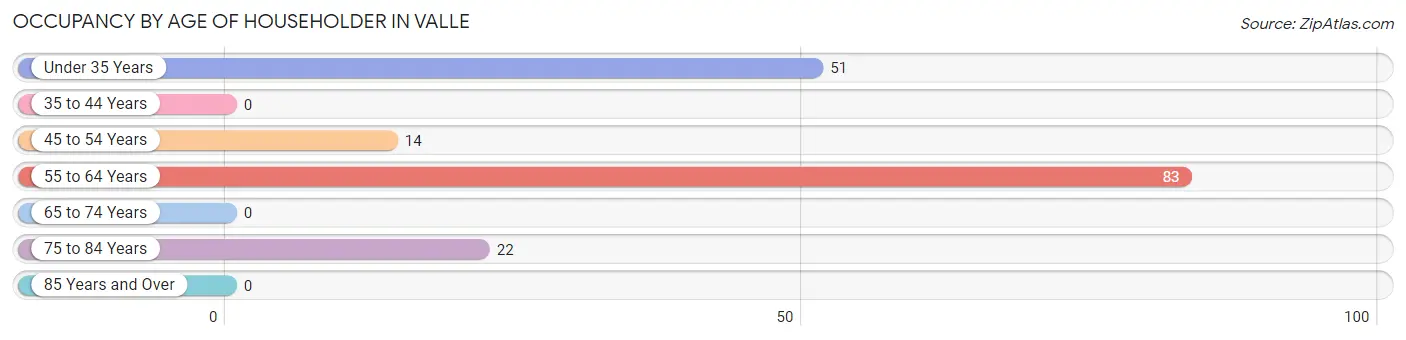
| Age Bracket | # Households | % Households |
| Under 35 Years | 51 | 30.0% |
| 35 to 44 Years | 0 | 0.0% |
| 45 to 54 Years | 14 | 8.2% |
| 55 to 64 Years | 83 | 48.8% |
| 65 to 74 Years | 0 | 0.0% |
| 75 to 84 Years | 22 | 12.9% |
| 85 Years and Over | 0 | 0.0% |
| Total | 170 | 100.0% |
Housing Finances in Valle
Median Income by Occupancy in Valle
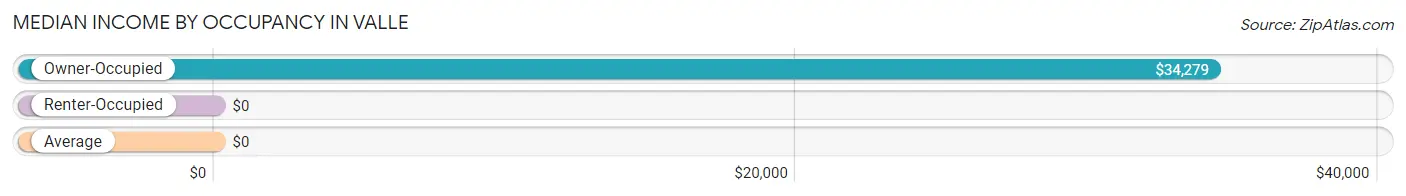
| Occupancy Type | # Households | Median Income |
| Owner-Occupied | 119 (70.0%) | $34,279 |
| Renter-Occupied | 51 (30.0%) | $0 |
| Average | 170 (100.0%) | $0 |
Occupancy by Householder Income Bracket in Valle
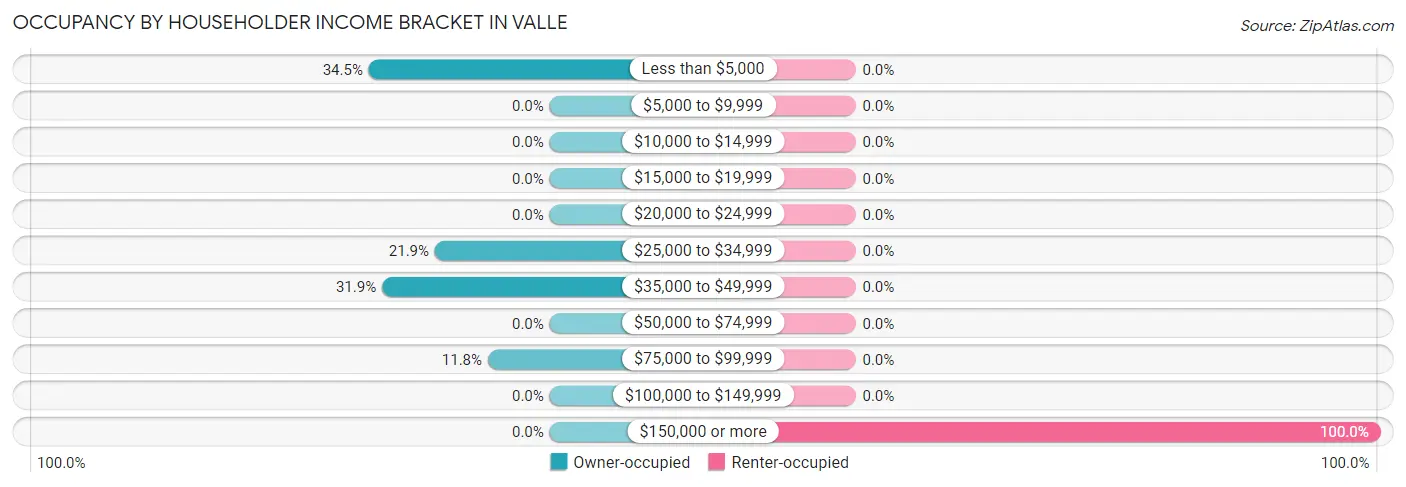
| Income Bracket | Owner-occupied | Renter-occupied |
| Less than $5,000 | 41 (34.4%) | 0 (0.0%) |
| $5,000 to $9,999 | 0 (0.0%) | 0 (0.0%) |
| $10,000 to $14,999 | 0 (0.0%) | 0 (0.0%) |
| $15,000 to $19,999 | 0 (0.0%) | 0 (0.0%) |
| $20,000 to $24,999 | 0 (0.0%) | 0 (0.0%) |
| $25,000 to $34,999 | 26 (21.8%) | 0 (0.0%) |
| $35,000 to $49,999 | 38 (31.9%) | 0 (0.0%) |
| $50,000 to $74,999 | 0 (0.0%) | 0 (0.0%) |
| $75,000 to $99,999 | 14 (11.8%) | 0 (0.0%) |
| $100,000 to $149,999 | 0 (0.0%) | 0 (0.0%) |
| $150,000 or more | 0 (0.0%) | 51 (100.0%) |
| Total | 119 (100.0%) | 51 (100.0%) |
Monthly Housing Cost Tiers in Valle
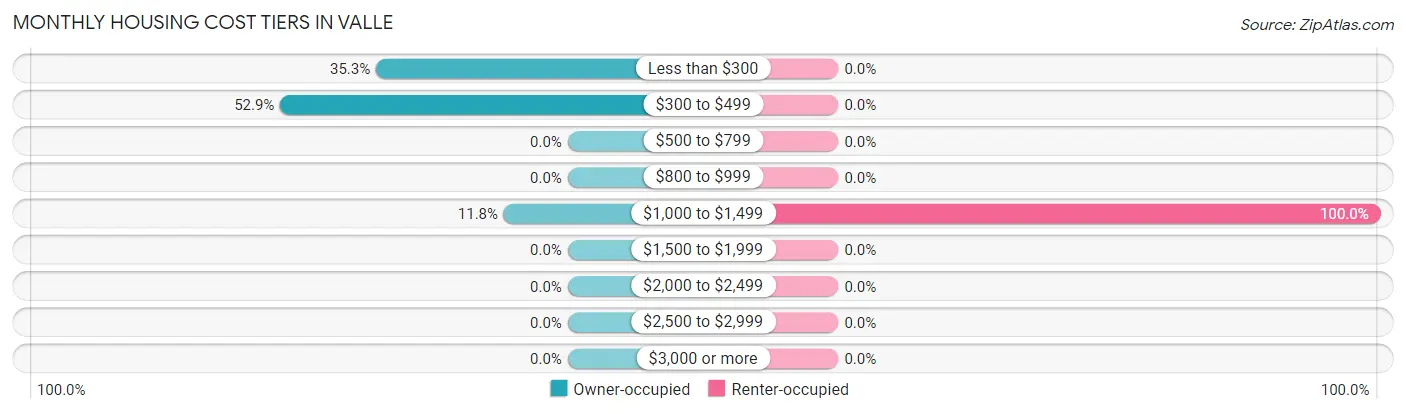
| Monthly Cost | Owner-occupied | Renter-occupied |
| Less than $300 | 42 (35.3%) | 0 (0.0%) |
| $300 to $499 | 63 (52.9%) | 0 (0.0%) |
| $500 to $799 | 0 (0.0%) | 0 (0.0%) |
| $800 to $999 | 0 (0.0%) | 0 (0.0%) |
| $1,000 to $1,499 | 14 (11.8%) | 51 (100.0%) |
| $1,500 to $1,999 | 0 (0.0%) | 0 (0.0%) |
| $2,000 to $2,499 | 0 (0.0%) | 0 (0.0%) |
| $2,500 to $2,999 | 0 (0.0%) | 0 (0.0%) |
| $3,000 or more | 0 (0.0%) | 0 (0.0%) |
| Total | 119 (100.0%) | 51 (100.0%) |
Physical Housing Characteristics in Valle
Housing Structures in Valle
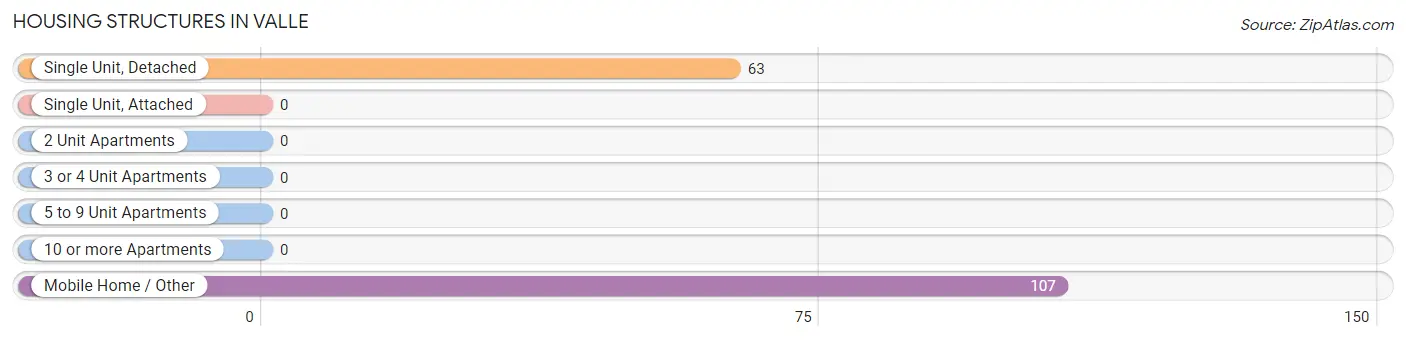
| Structure Type | # Housing Units | % Housing Units |
| Single Unit, Detached | 63 | 37.1% |
| Single Unit, Attached | 0 | 0.0% |
| 2 Unit Apartments | 0 | 0.0% |
| 3 or 4 Unit Apartments | 0 | 0.0% |
| 5 to 9 Unit Apartments | 0 | 0.0% |
| 10 or more Apartments | 0 | 0.0% |
| Mobile Home / Other | 107 | 62.9% |
| Total | 170 | 100.0% |
Housing Structures by Occupancy in Valle
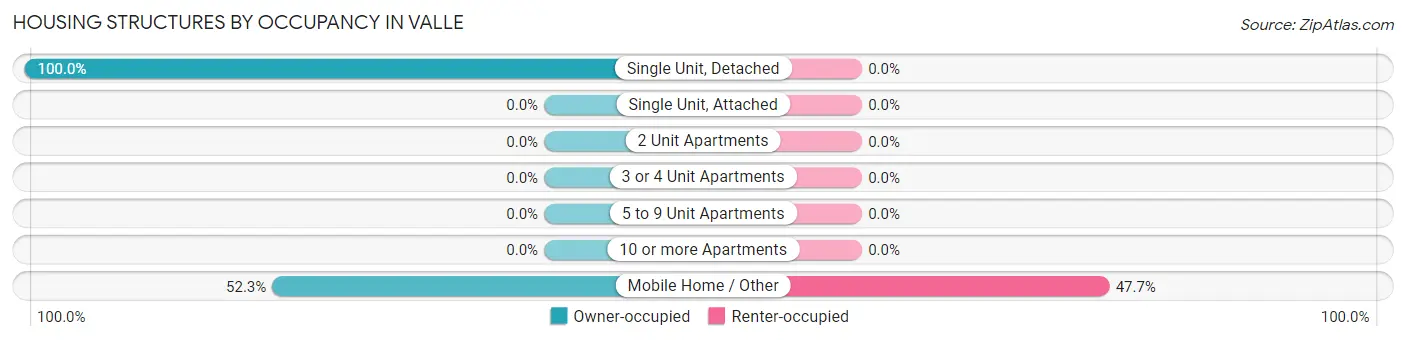
| Structure Type | Owner-occupied | Renter-occupied |
| Single Unit, Detached | 63 (100.0%) | 0 (0.0%) |
| Single Unit, Attached | 0 (0.0%) | 0 (0.0%) |
| 2 Unit Apartments | 0 (0.0%) | 0 (0.0%) |
| 3 or 4 Unit Apartments | 0 (0.0%) | 0 (0.0%) |
| 5 to 9 Unit Apartments | 0 (0.0%) | 0 (0.0%) |
| 10 or more Apartments | 0 (0.0%) | 0 (0.0%) |
| Mobile Home / Other | 56 (52.3%) | 51 (47.7%) |
| Total | 119 (70.0%) | 51 (30.0%) |
Housing Structures by Number of Rooms in Valle
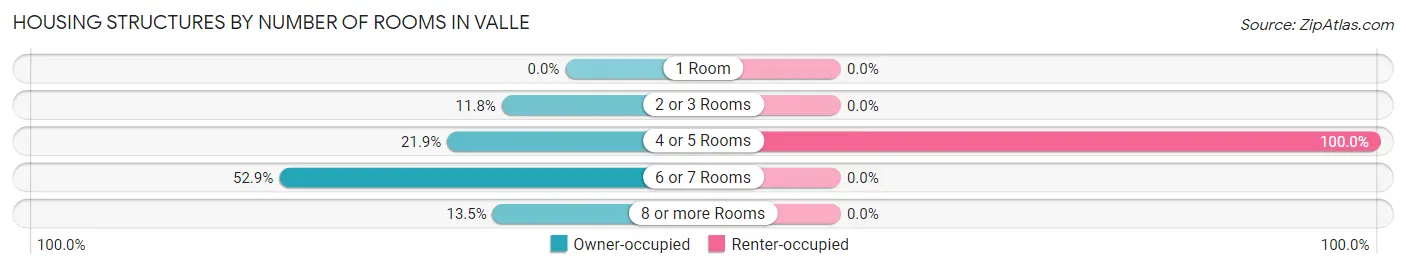
| Number of Rooms | Owner-occupied | Renter-occupied |
| 1 Room | 0 (0.0%) | 0 (0.0%) |
| 2 or 3 Rooms | 14 (11.8%) | 0 (0.0%) |
| 4 or 5 Rooms | 26 (21.8%) | 51 (100.0%) |
| 6 or 7 Rooms | 63 (52.9%) | 0 (0.0%) |
| 8 or more Rooms | 16 (13.5%) | 0 (0.0%) |
| Total | 119 (100.0%) | 51 (100.0%) |
Housing Structure by Heating Type in Valle
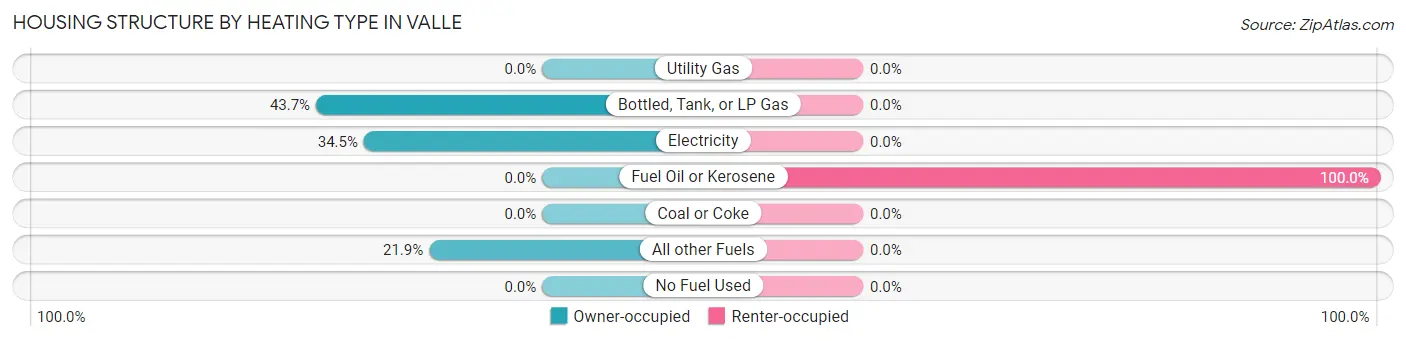
| Heating Type | Owner-occupied | Renter-occupied |
| Utility Gas | 0 (0.0%) | 0 (0.0%) |
| Bottled, Tank, or LP Gas | 52 (43.7%) | 0 (0.0%) |
| Electricity | 41 (34.4%) | 0 (0.0%) |
| Fuel Oil or Kerosene | 0 (0.0%) | 51 (100.0%) |
| Coal or Coke | 0 (0.0%) | 0 (0.0%) |
| All other Fuels | 26 (21.8%) | 0 (0.0%) |
| No Fuel Used | 0 (0.0%) | 0 (0.0%) |
| Total | 119 (100.0%) | 51 (100.0%) |
Household Vehicle Usage in Valle
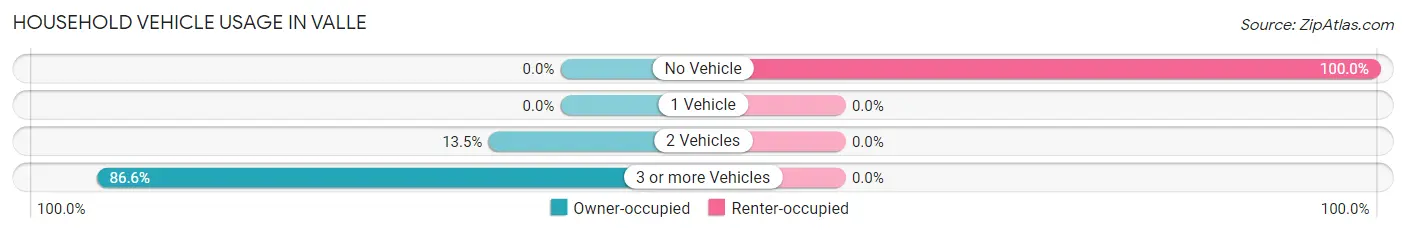
| Vehicles per Household | Owner-occupied | Renter-occupied |
| No Vehicle | 0 (0.0%) | 51 (100.0%) |
| 1 Vehicle | 0 (0.0%) | 0 (0.0%) |
| 2 Vehicles | 16 (13.5%) | 0 (0.0%) |
| 3 or more Vehicles | 103 (86.6%) | 0 (0.0%) |
| Total | 119 (100.0%) | 51 (100.0%) |
Real Estate & Mortgages in Valle
Real Estate and Mortgage Overview in Valle
| Characteristic | Without Mortgage | With Mortgage |
| Housing Units | 105 | 14 |
| Median Property Value | - | - |
| Median Household Income | - | - |
| Monthly Housing Costs | $417 | $0 |
| Real Estate Taxes | - | - |
Property Value by Mortgage Status in Valle
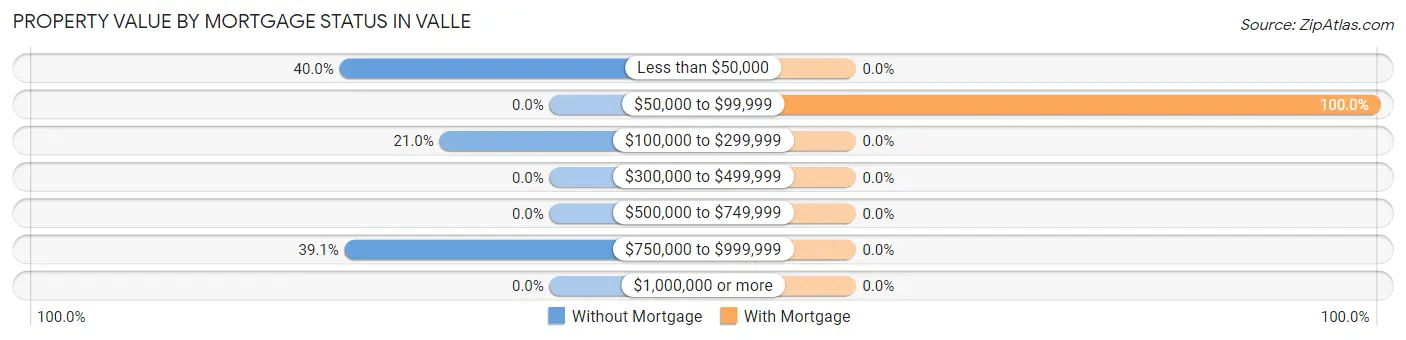
| Property Value | Without Mortgage | With Mortgage |
| Less than $50,000 | 42 (40.0%) | 0 (0.0%) |
| $50,000 to $99,999 | 0 (0.0%) | 14 (100.0%) |
| $100,000 to $299,999 | 22 (20.9%) | 0 (0.0%) |
| $300,000 to $499,999 | 0 (0.0%) | 0 (0.0%) |
| $500,000 to $749,999 | 0 (0.0%) | 0 (0.0%) |
| $750,000 to $999,999 | 41 (39.1%) | 0 (0.0%) |
| $1,000,000 or more | 0 (0.0%) | 0 (0.0%) |
| Total | 105 (100.0%) | 14 (100.0%) |
Household Income by Mortgage Status in Valle
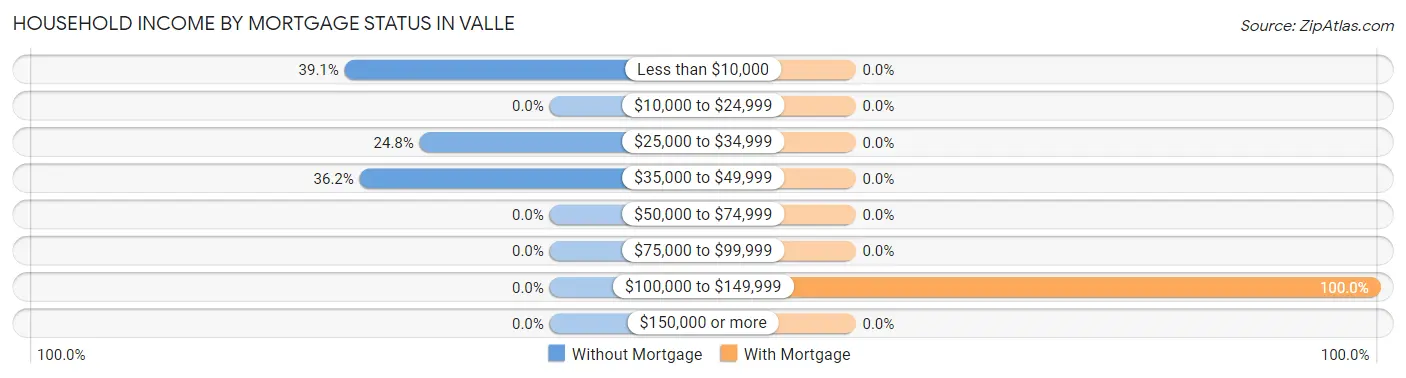
| Household Income | Without Mortgage | With Mortgage |
| Less than $10,000 | 41 (39.1%) | 0 (0.0%) |
| $10,000 to $24,999 | 0 (0.0%) | 0 (0.0%) |
| $25,000 to $34,999 | 26 (24.8%) | 0 (0.0%) |
| $35,000 to $49,999 | 38 (36.2%) | 0 (0.0%) |
| $50,000 to $74,999 | 0 (0.0%) | 0 (0.0%) |
| $75,000 to $99,999 | 0 (0.0%) | 0 (0.0%) |
| $100,000 to $149,999 | 0 (0.0%) | 14 (100.0%) |
| $150,000 or more | 0 (0.0%) | 0 (0.0%) |
| Total | 105 (100.0%) | 14 (100.0%) |
Property Value to Household Income Ratio in Valle
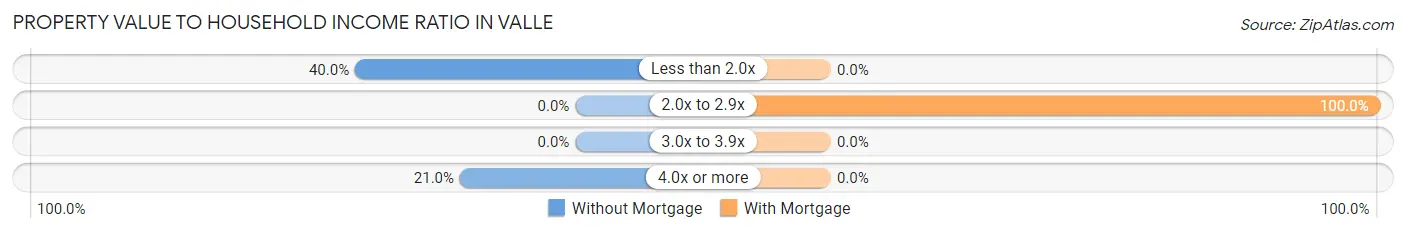
| Value-to-Income Ratio | Without Mortgage | With Mortgage |
| Less than 2.0x | 42 (40.0%) | 0 (0.0%) |
| 2.0x to 2.9x | 0 (0.0%) | 14 (100.0%) |
| 3.0x to 3.9x | 0 (0.0%) | 0 (0.0%) |
| 4.0x or more | 22 (20.9%) | 0 (0.0%) |
| Total | 105 (100.0%) | 14 (100.0%) |
Real Estate Taxes by Mortgage Status in Valle
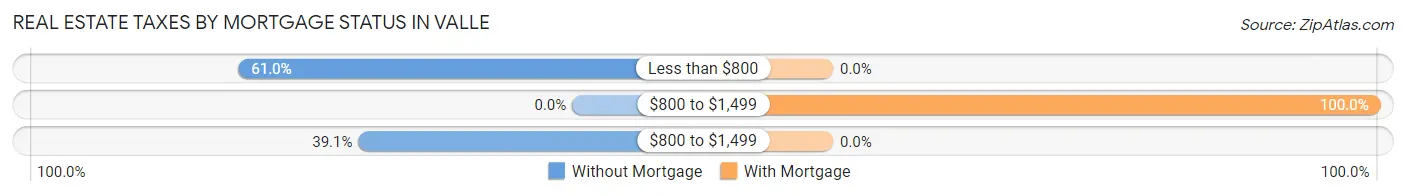
| Property Taxes | Without Mortgage | With Mortgage |
| Less than $800 | 64 (61.0%) | 0 (0.0%) |
| $800 to $1,499 | 0 (0.0%) | 14 (100.0%) |
| $800 to $1,499 | 41 (39.1%) | 0 (0.0%) |
| Total | 105 (100.0%) | 14 (100.0%) |
Health & Disability in Valle
Health Insurance Coverage by Age in Valle
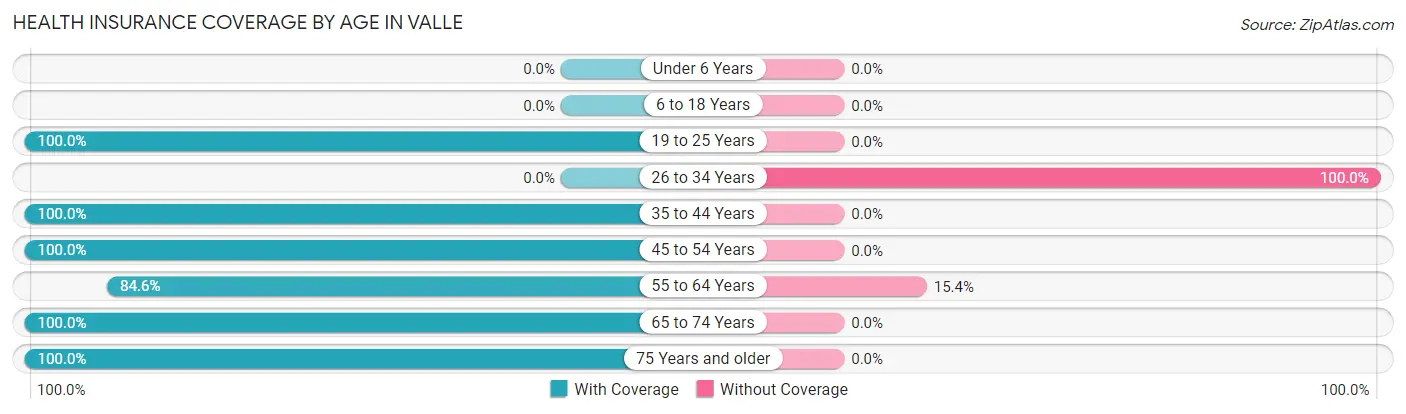
| Age Bracket | With Coverage | Without Coverage |
| Under 6 Years | 0 (0.0%) | 0 (0.0%) |
| 6 to 18 Years | 0 (0.0%) | 0 (0.0%) |
| 19 to 25 Years | 1 (100.0%) | 0 (0.0%) |
| 26 to 34 Years | 0 (0.0%) | 51 (100.0%) |
| 35 to 44 Years | 14 (100.0%) | 0 (0.0%) |
| 45 to 54 Years | 25 (100.0%) | 0 (0.0%) |
| 55 to 64 Years | 88 (84.6%) | 16 (15.4%) |
| 65 to 74 Years | 31 (100.0%) | 0 (0.0%) |
| 75 Years and older | 22 (100.0%) | 0 (0.0%) |
| Total | 181 (73.0%) | 67 (27.0%) |
Health Insurance Coverage by Citizenship Status in Valle
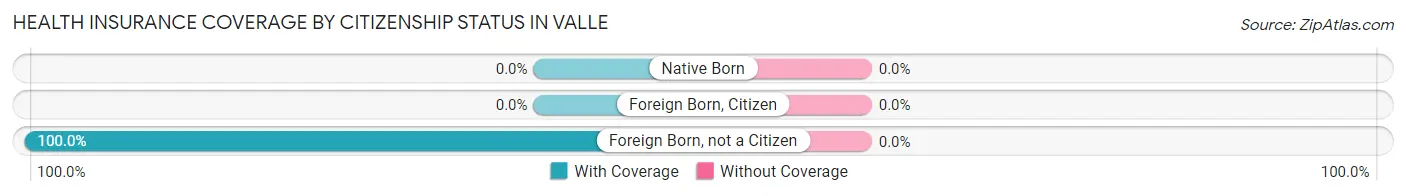
| Citizenship Status | With Coverage | Without Coverage |
| Native Born | 0 (0.0%) | 0 (0.0%) |
| Foreign Born, Citizen | 0 (0.0%) | 0 (0.0%) |
| Foreign Born, not a Citizen | 1 (100.0%) | 0 (0.0%) |
Health Insurance Coverage by Household Income in Valle
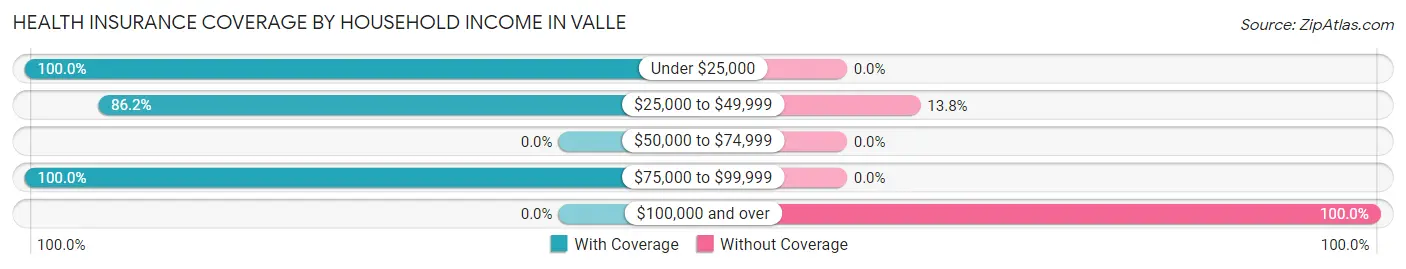
| Household Income | With Coverage | Without Coverage |
| Under $25,000 | 41 (100.0%) | 0 (0.0%) |
| $25,000 to $49,999 | 100 (86.2%) | 16 (13.8%) |
| $50,000 to $74,999 | 0 (0.0%) | 0 (0.0%) |
| $75,000 to $99,999 | 38 (100.0%) | 0 (0.0%) |
| $100,000 and over | 0 (0.0%) | 51 (100.0%) |
Public vs Private Health Insurance Coverage by Age in Valle
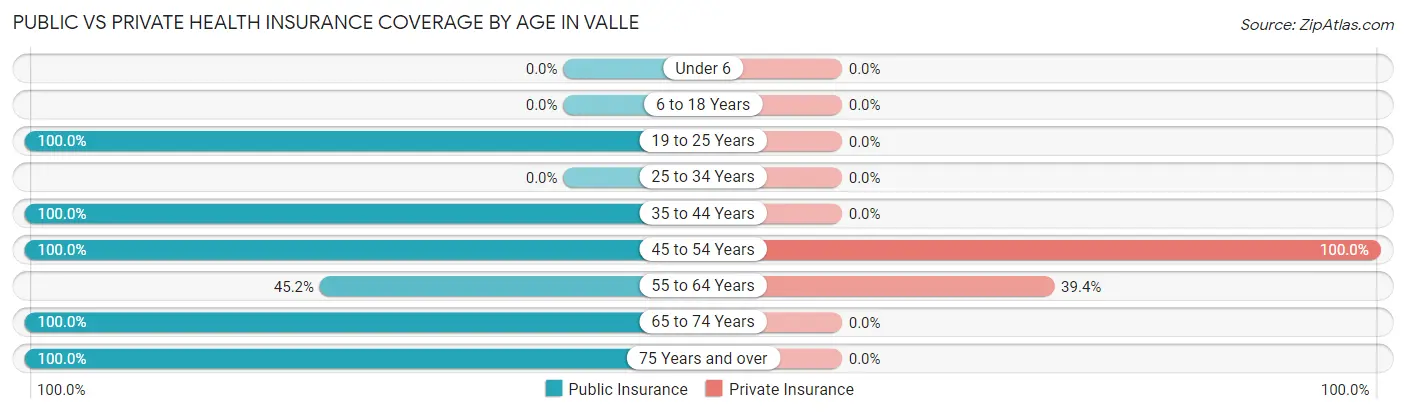
| Age Bracket | Public Insurance | Private Insurance |
| Under 6 | 0 (0.0%) | 0 (0.0%) |
| 6 to 18 Years | 0 (0.0%) | 0 (0.0%) |
| 19 to 25 Years | 1 (100.0%) | 0 (0.0%) |
| 25 to 34 Years | 0 (0.0%) | 0 (0.0%) |
| 35 to 44 Years | 14 (100.0%) | 0 (0.0%) |
| 45 to 54 Years | 25 (100.0%) | 25 (100.0%) |
| 55 to 64 Years | 47 (45.2%) | 41 (39.4%) |
| 65 to 74 Years | 31 (100.0%) | 0 (0.0%) |
| 75 Years and over | 22 (100.0%) | 0 (0.0%) |
| Total | 140 (56.5%) | 66 (26.6%) |
Disability Status by Sex by Age in Valle
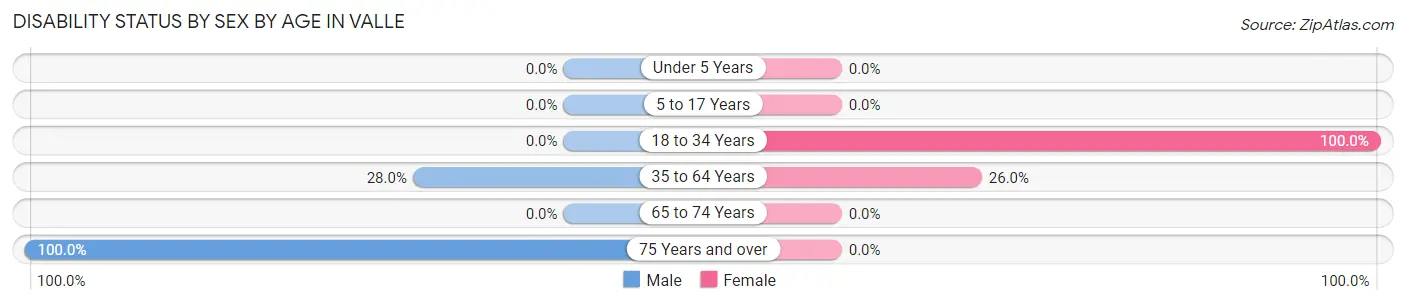
| Age Bracket | Male | Female |
| Under 5 Years | 0 (0.0%) | 0 (0.0%) |
| 5 to 17 Years | 0 (0.0%) | 0 (0.0%) |
| 18 to 34 Years | 0 (0.0%) | 1 (100.0%) |
| 35 to 64 Years | 26 (28.0%) | 13 (26.0%) |
| 65 to 74 Years | 0 (0.0%) | 0 (0.0%) |
| 75 Years and over | 22 (100.0%) | 0 (0.0%) |
Disability Class by Sex by Age in Valle
Disability Class: Hearing Difficulty
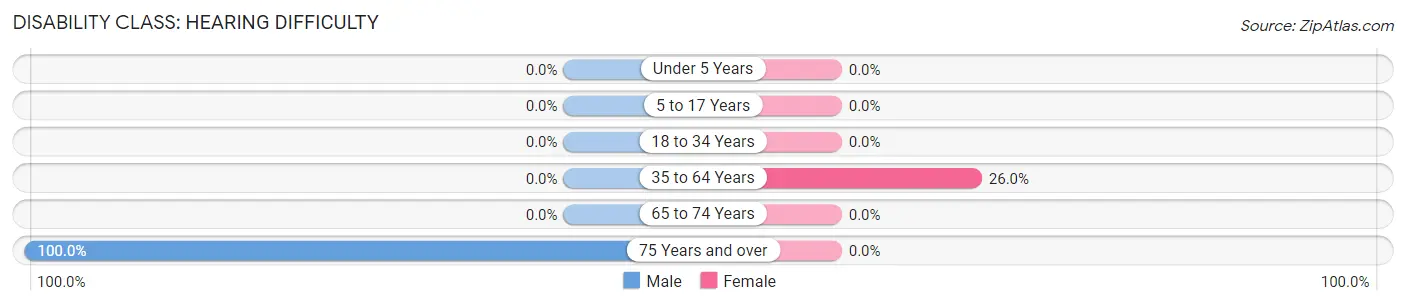
| Age Bracket | Male | Female |
| Under 5 Years | 0 (0.0%) | 0 (0.0%) |
| 5 to 17 Years | 0 (0.0%) | 0 (0.0%) |
| 18 to 34 Years | 0 (0.0%) | 0 (0.0%) |
| 35 to 64 Years | 0 (0.0%) | 13 (26.0%) |
| 65 to 74 Years | 0 (0.0%) | 0 (0.0%) |
| 75 Years and over | 22 (100.0%) | 0 (0.0%) |
Disability Class: Vision Difficulty
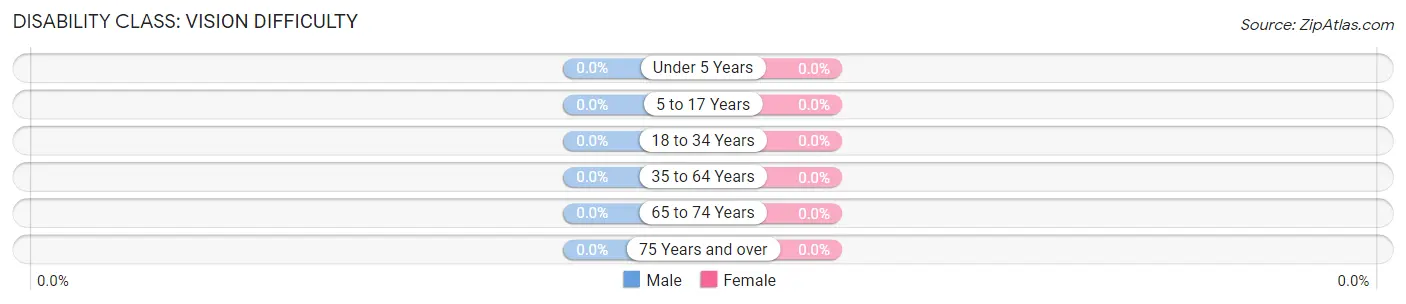
| Age Bracket | Male | Female |
| Under 5 Years | 0 (0.0%) | 0 (0.0%) |
| 5 to 17 Years | 0 (0.0%) | 0 (0.0%) |
| 18 to 34 Years | 0 (0.0%) | 0 (0.0%) |
| 35 to 64 Years | 0 (0.0%) | 0 (0.0%) |
| 65 to 74 Years | 0 (0.0%) | 0 (0.0%) |
| 75 Years and over | 0 (0.0%) | 0 (0.0%) |
Disability Class: Cognitive Difficulty
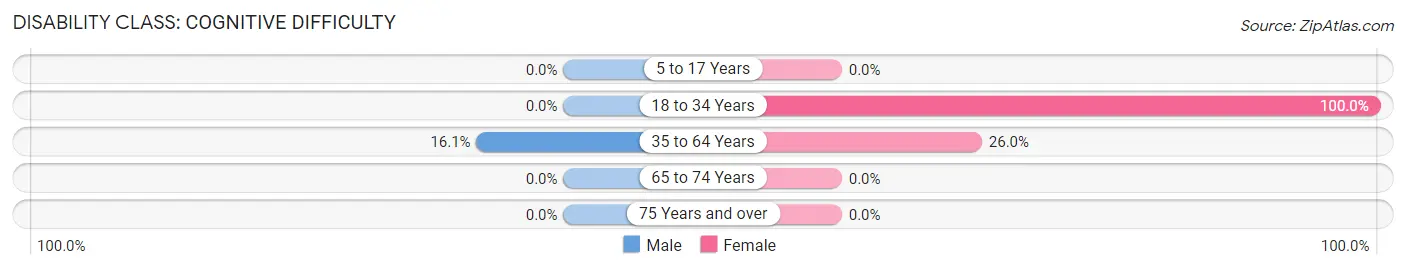
| Age Bracket | Male | Female |
| 5 to 17 Years | 0 (0.0%) | 0 (0.0%) |
| 18 to 34 Years | 0 (0.0%) | 1 (100.0%) |
| 35 to 64 Years | 15 (16.1%) | 13 (26.0%) |
| 65 to 74 Years | 0 (0.0%) | 0 (0.0%) |
| 75 Years and over | 0 (0.0%) | 0 (0.0%) |
Disability Class: Ambulatory Difficulty
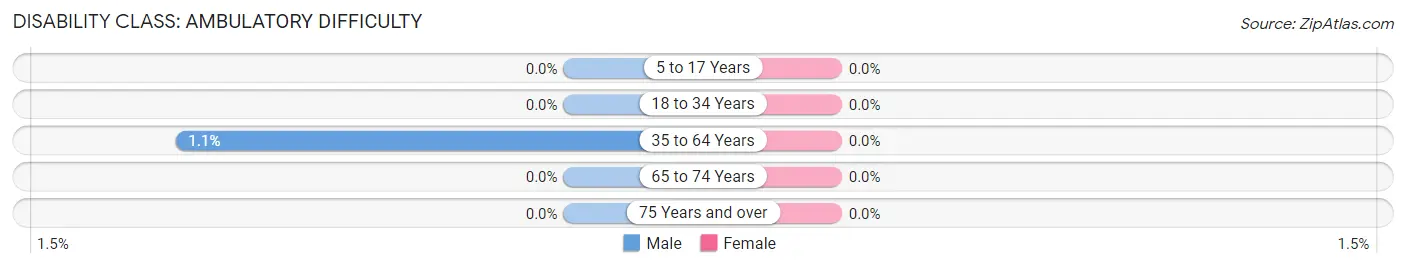
| Age Bracket | Male | Female |
| 5 to 17 Years | 0 (0.0%) | 0 (0.0%) |
| 18 to 34 Years | 0 (0.0%) | 0 (0.0%) |
| 35 to 64 Years | 1 (1.1%) | 0 (0.0%) |
| 65 to 74 Years | 0 (0.0%) | 0 (0.0%) |
| 75 Years and over | 0 (0.0%) | 0 (0.0%) |
Disability Class: Self-Care Difficulty
| Age Bracket | Male | Female |
| 5 to 17 Years | 0 (0.0%) | 0 (0.0%) |
| 18 to 34 Years | 0 (0.0%) | 0 (0.0%) |
| 35 to 64 Years | 0 (0.0%) | 0 (0.0%) |
| 65 to 74 Years | 0 (0.0%) | 0 (0.0%) |
| 75 Years and over | 0 (0.0%) | 0 (0.0%) |
Technology Access in Valle
Computing Device Access in Valle
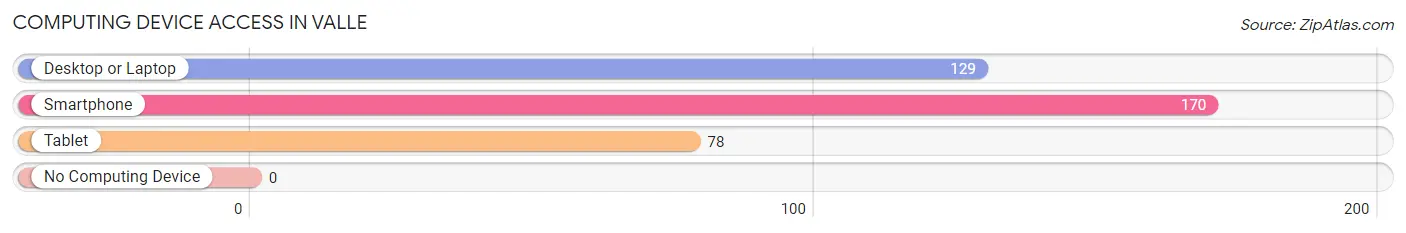
| Device Type | # Households | % Households |
| Desktop or Laptop | 129 | 75.9% |
| Smartphone | 170 | 100.0% |
| Tablet | 78 | 45.9% |
| No Computing Device | 0 | 0.0% |
| Total | 170 | 100.0% |
Internet Access in Valle
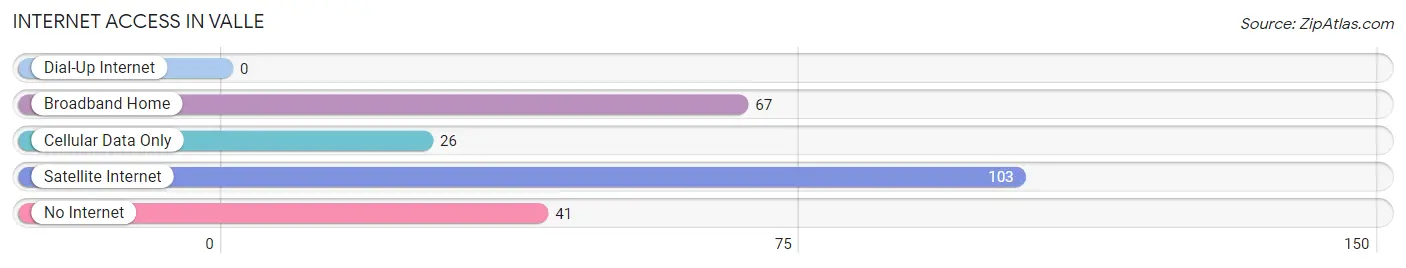
| Internet Type | # Households | % Households |
| Dial-Up Internet | 0 | 0.0% |
| Broadband Home | 67 | 39.4% |
| Cellular Data Only | 26 | 15.3% |
| Satellite Internet | 103 | 60.6% |
| No Internet | 41 | 24.1% |
| Total | 170 | 100.0% |
Valle Summary
Valle, Arizona is a small unincorporated community located in Coconino County, Arizona. It is situated in the northern part of the state, approximately 25 miles south of the Grand Canyon National Park. Valle is a rural community with a population of approximately 500 people.
History
Valle was first settled in the late 1800s by Mormon settlers who were looking for a place to practice their faith. The town was originally called “Valle de los Santos”, which translates to “Valley of the Saints”. The town was officially established in 1891 and was named after the nearby Valle Redondo, which was a large meadow that was used for grazing cattle.
In the early 1900s, Valle was a thriving community with a post office, a school, a general store, and a hotel. The town was also home to a number of businesses, including a blacksmith shop, a livery stable, and a saloon.
In the 1920s, the town began to decline as the railroad bypassed Valle and the population began to move away. By the 1940s, the town was nearly abandoned. In the 1950s, the town was revitalized when the Grand Canyon National Park was established and the town became a popular tourist destination.
Geography
Valle is located in the northern part of Arizona, approximately 25 miles south of the Grand Canyon National Park. The town is situated in a valley surrounded by the Coconino National Forest. The town is located at an elevation of 5,000 feet and has a semi-arid climate with hot summers and cold winters.
Economy
Valle’s economy is largely based on tourism. The town is a popular destination for visitors to the Grand Canyon National Park and is home to a number of hotels, restaurants, and other tourist attractions. The town is also home to a number of small businesses, including a general store, a gas station, and a post office.
Demographics
As of the 2010 census, the population of Valle was 498. The racial makeup of the town was 95.2% White, 0.2% African American, 0.4% Native American, 0.2% Asian, 0.2% Pacific Islander, 0.2% from other races, and 3.8% from two or more races. Hispanic or Latino of any race were 2.2% of the population.
The median household income in Valle was $37,500 and the median family income was $41,250. The per capita income for the town was $17,857. About 11.2% of families and 14.2% of the population were below the poverty line, including 18.2% of those under age 18 and none of those age 65 or over.
Conclusion
Valle, Arizona is a small unincorporated community located in Coconino County, Arizona. It is situated in the northern part of the state, approximately 25 miles south of the Grand Canyon National Park. Valle was first settled in the late 1800s by Mormon settlers and was officially established in 1891. The town’s economy is largely based on tourism and the population of Valle was 498 as of the 2010 census. Valle is a popular destination for visitors to the Grand Canyon National Park and is home to a number of hotels, restaurants, and other tourist attractions.
Common Questions
What is Per Capita Income in Valle?
Per Capita income in Valle is $52,495.
What is Inequality or Gini Index in Valle?
Inequality or Gini Index in Valle is 0.51.
What is the Total Population of Valle?
Total Population of Valle is 248.
What is the Total Male Population of Valle?
Total Male Population of Valle is 181.
What is the Total Female Population of Valle?
Total Female Population of Valle is 67.
What is the Ratio of Males per 100 Females in Valle?
There are 270.15 Males per 100 Females in Valle.
What is the Ratio of Females per 100 Males in Valle?
There are 37.02 Females per 100 Males in Valle.
What is the Median Population Age in Valle?
Median Population Age in Valle is 61.5 Years.
What is the Average Family Size in Valle
Average Family Size in Valle is 1.8 People.
What is the Average Household Size in Valle
Average Household Size in Valle is 1.4 People.
How Large is the Labor Force in Valle?
There are 104 People in the Labor Forcein in Valle.
What is the Percentage of People in the Labor Force in Valle?
41.9% of People are in the Labor Force in Valle.
What is the Unemployment Rate in Valle?
Unemployment Rate in Valle is 1.0%.