Zip Codes with the Highest Percentage of Population with a Degree in Liberal Arts and History in San Tan Valley, AZ
RELATED REPORTS & OPTIONS
Liberal Arts and History
San Tan Valley
Compare Zip Codes
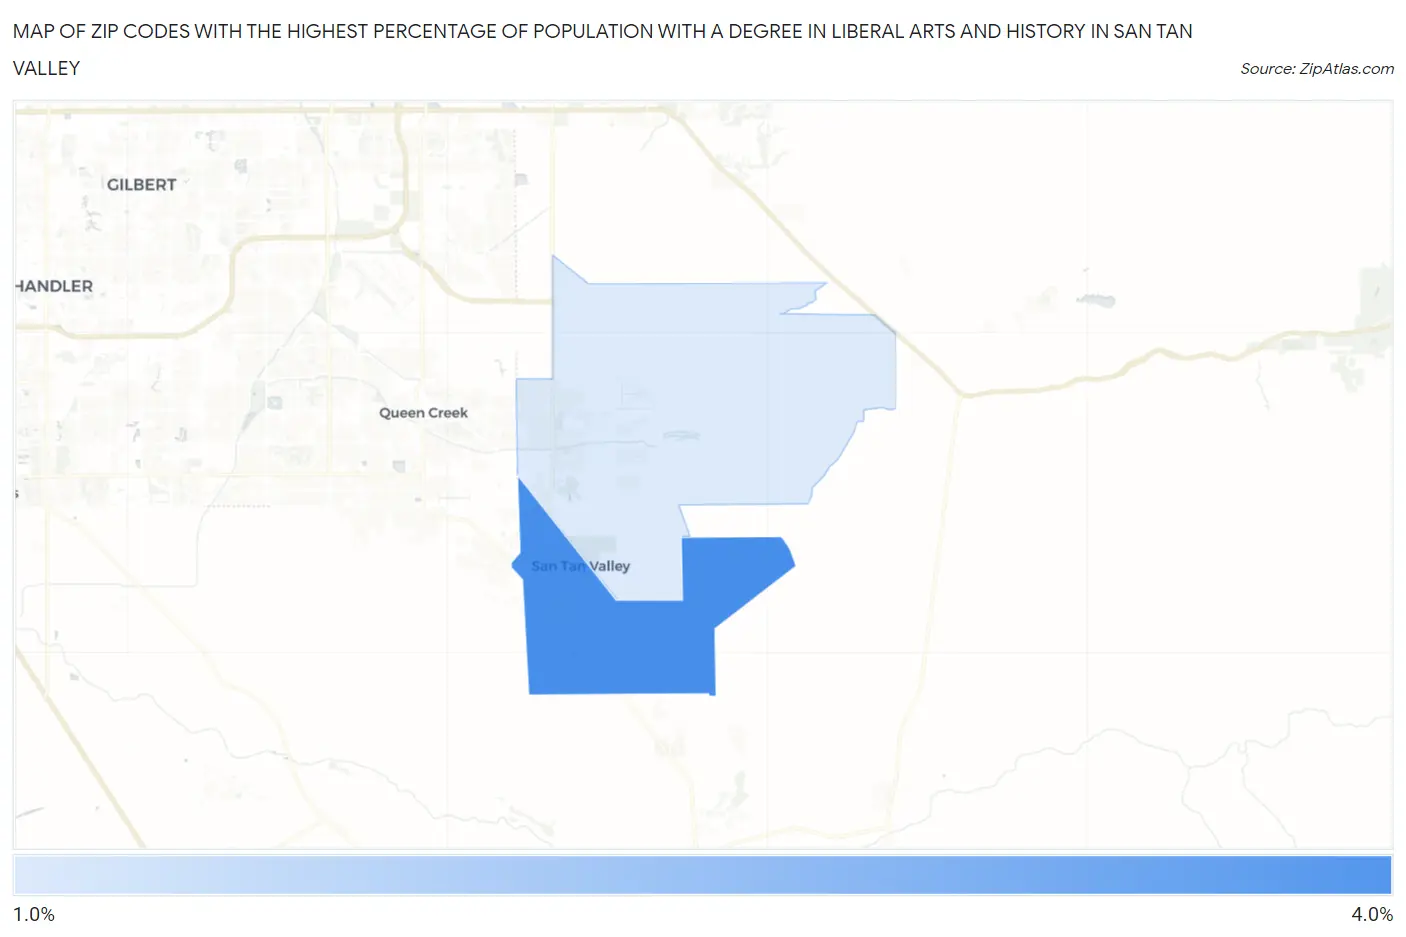
Map of Zip Codes with the Highest Percentage of Population with a Degree in Liberal Arts and History in San Tan Valley
1.9%
3.8%
Zip Codes with the Highest Percentage of Population with a Degree in Liberal Arts and History in San Tan Valley, AZ
| Zip Code | % Graduates | vs State | vs National | |
| 1. | 85143 | 3.8% | 4.3%(-0.441)#193 | 4.9%(-1.06)#15,474 |
| 2. | 85140 | 1.9% | 4.3%(-2.34)#275 | 4.9%(-2.96)#21,591 |
1
Common Questions
What are the Top Zip Codes with the Highest Percentage of Population with a Degree in Liberal Arts and History in San Tan Valley, AZ?
Top Zip Codes with the Highest Percentage of Population with a Degree in Liberal Arts and History in San Tan Valley, AZ are:
What zip code has the Highest Percentage of Population with a Degree in Liberal Arts and History in San Tan Valley, AZ?
85143 has the Highest Percentage of Population with a Degree in Liberal Arts and History in San Tan Valley, AZ with 3.8%.
What is the Percentage of Population with a Degree in Liberal Arts and History in San Tan Valley, AZ?
Percentage of Population with a Degree in Liberal Arts and History in San Tan Valley is 2.9%.
What is the Percentage of Population with a Degree in Liberal Arts and History in Arizona?
Percentage of Population with a Degree in Liberal Arts and History in Arizona is 4.3%.
What is the Percentage of Population with a Degree in Liberal Arts and History in the United States?
Percentage of Population with a Degree in Liberal Arts and History in the United States is 4.9%.