Zip Codes with the Highest Percentage of Population Taking Taxi / Cab to Work in San Tan Valley, AZ
RELATED REPORTS & OPTIONS
Taxi / Cab
San Tan Valley
Compare Zip Codes
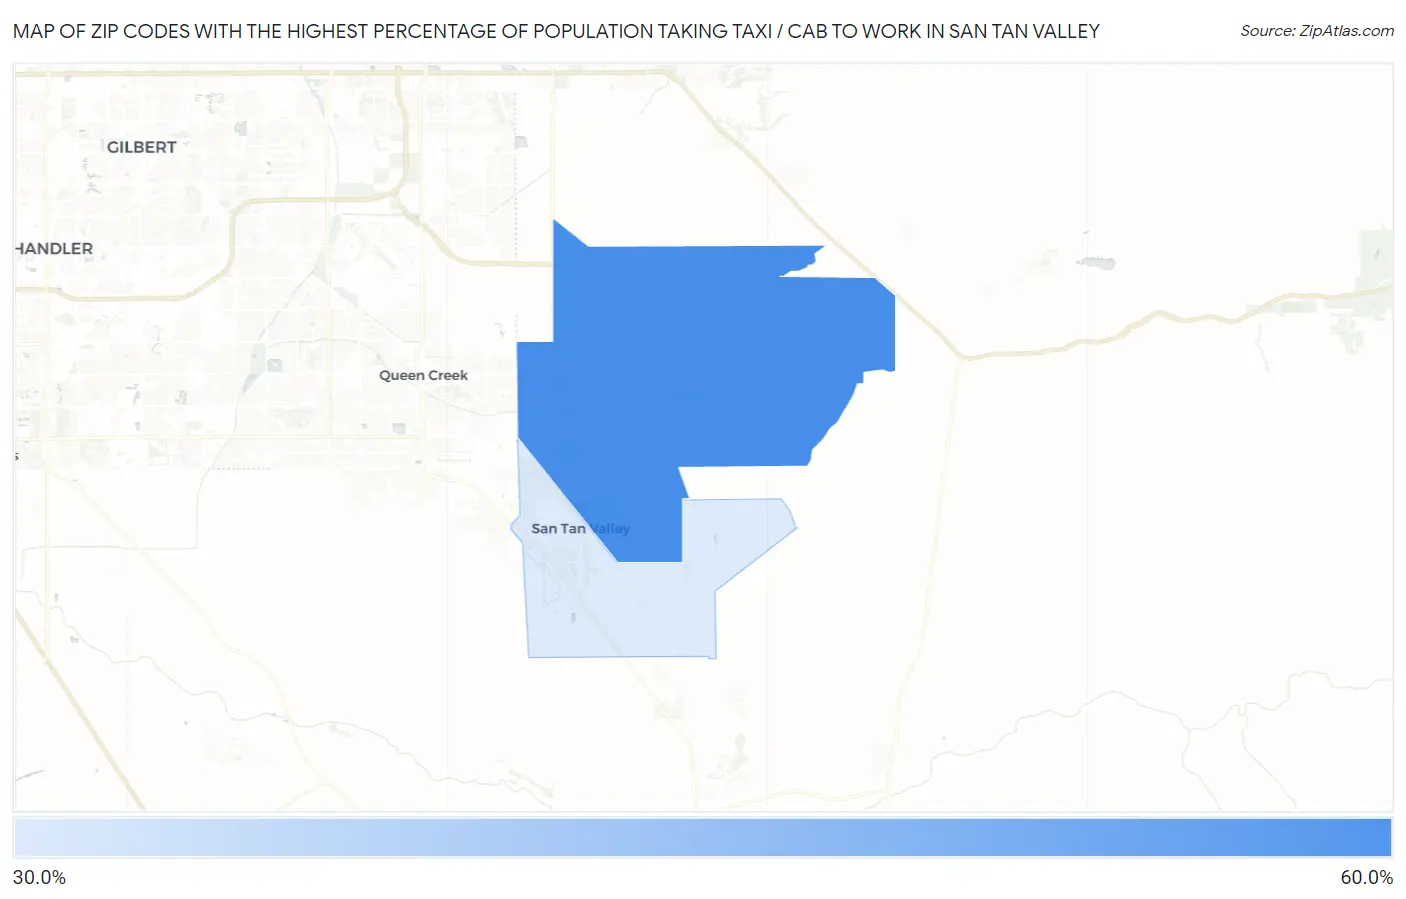
Map of Zip Codes with the Highest Percentage of Population Taking Taxi / Cab to Work in San Tan Valley
36.5%
50.3%
Zip Codes with the Highest Percentage of Population Taking Taxi / Cab to Work in San Tan Valley, AZ
| Zip Code | % Take Taxi / Cab | vs State | vs National | |
| 1. | 85140 | 50.3% | 38.4%(+11.9)#39 | 38.2%(+12.1)#2,849 |
| 2. | 85143 | 36.5% | 38.4%(-1.90)#135 | 38.2%(-1.70)#8,177 |
1
Common Questions
What are the Top Zip Codes with the Highest Percentage of Population Taking Taxi / Cab to Work in San Tan Valley, AZ?
Top Zip Codes with the Highest Percentage of Population Taking Taxi / Cab to Work in San Tan Valley, AZ are:
What zip code has the Highest Percentage of Population Taking Taxi / Cab to Work in San Tan Valley, AZ?
85140 has the Highest Percentage of Population Taking Taxi / Cab to Work in San Tan Valley, AZ with 50.3%.
What is the Percentage of Population Taking Taxi / Cab to Work in San Tan Valley, AZ?
Percentage of Population Taking Taxi / Cab to Work in San Tan Valley is 40.1%.
What is the Percentage of Population Taking Taxi / Cab to Work in Arizona?
Percentage of Population Taking Taxi / Cab to Work in Arizona is 38.4%.
What is the Percentage of Population Taking Taxi / Cab to Work in the United States?
Percentage of Population Taking Taxi / Cab to Work in the United States is 38.2%.