Zip Codes with the Highest Percentage of Households with Income Below $10,000 in San Tan Valley, AZ
RELATED REPORTS & OPTIONS
Household Income | $0-10k
San Tan Valley
Compare Zip Codes
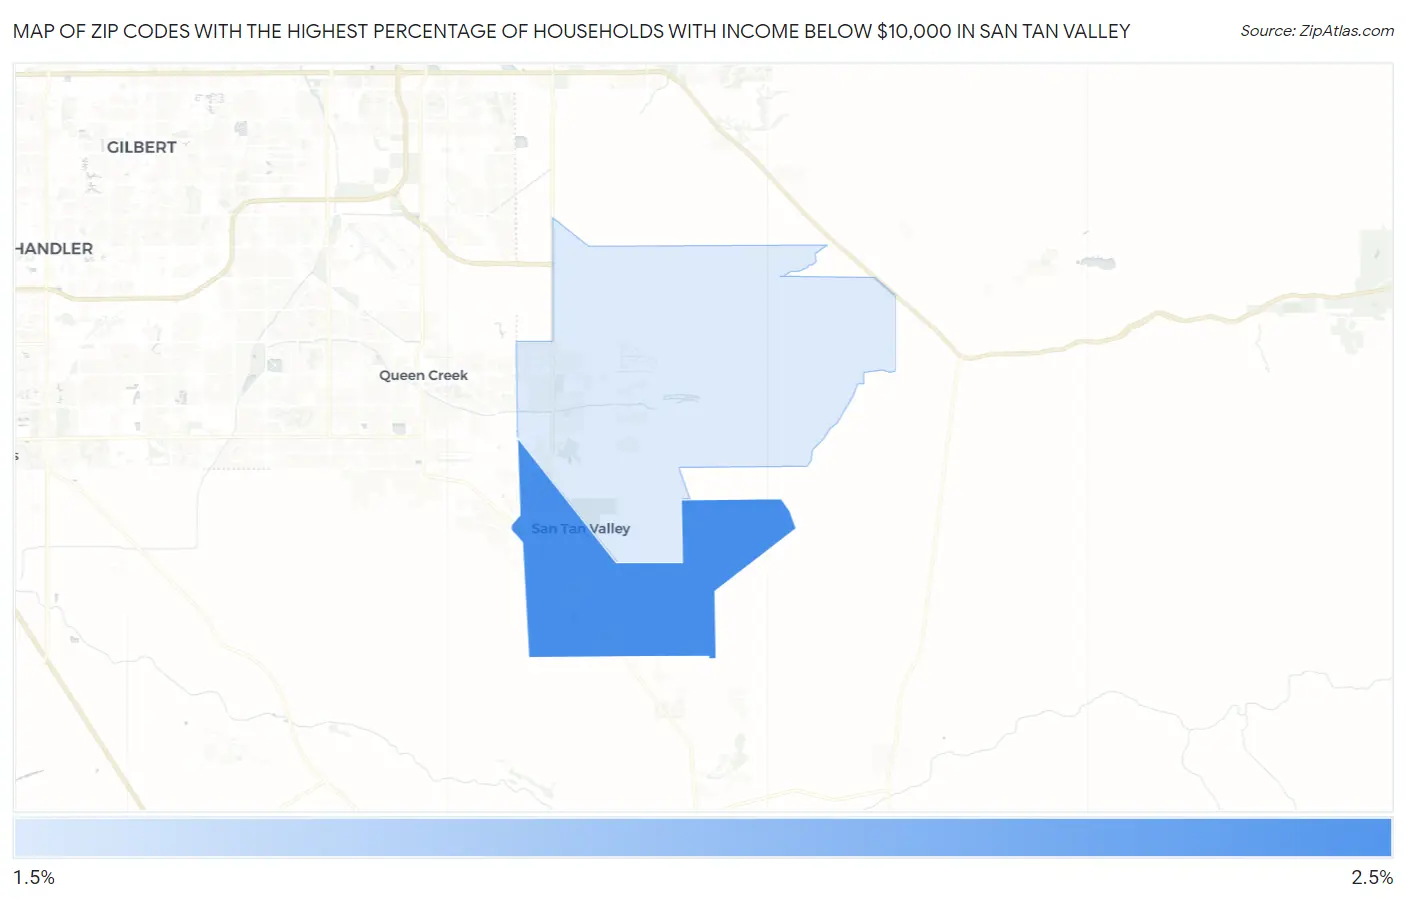
Map of Zip Codes with the Highest Percentage of Households with Income Below $10,000 in San Tan Valley
1.7%
2.4%
Zip Codes with the Highest Percentage of Households with Income Below $10,000 in San Tan Valley, AZ
| Zip Code | Households with Income < $10k | vs State | vs National | |
| 1. | 85143 | 2.4% | 4.9%(-2.50)#322 | 4.9%(-2.50)#22,002 |
| 2. | 85140 | 1.7% | 4.9%(-3.20)#345 | 4.9%(-3.20)#24,683 |
1
Common Questions
What are the Top Zip Codes with the Highest Percentage of Households with Income Below $10,000 in San Tan Valley, AZ?
Top Zip Codes with the Highest Percentage of Households with Income Below $10,000 in San Tan Valley, AZ are:
What zip code has the Highest Percentage of Households with Income Below $10,000 in San Tan Valley, AZ?
85143 has the Highest Percentage of Households with Income Below $10,000 in San Tan Valley, AZ with 2.4%.
What is the Percentage of Households with Income Below $10,000 in San Tan Valley, AZ?
Percentage of Households with Income Below $10,000 in San Tan Valley is 2.1%.
What is the Percentage of Households with Income Below $10,000 in Arizona?
Percentage of Households with Income Below $10,000 in Arizona is 4.9%.
What is the Percentage of Households with Income Below $10,000 in the United States?
Percentage of Households with Income Below $10,000 in the United States is 4.9%.