Zip Codes with the Highest Percentage of Population Employed in Arts, Entertainment & Recreation in San Tan Valley, AZ
RELATED REPORTS & OPTIONS
Arts, Entertainment & Recreation
San Tan Valley
Compare Zip Codes
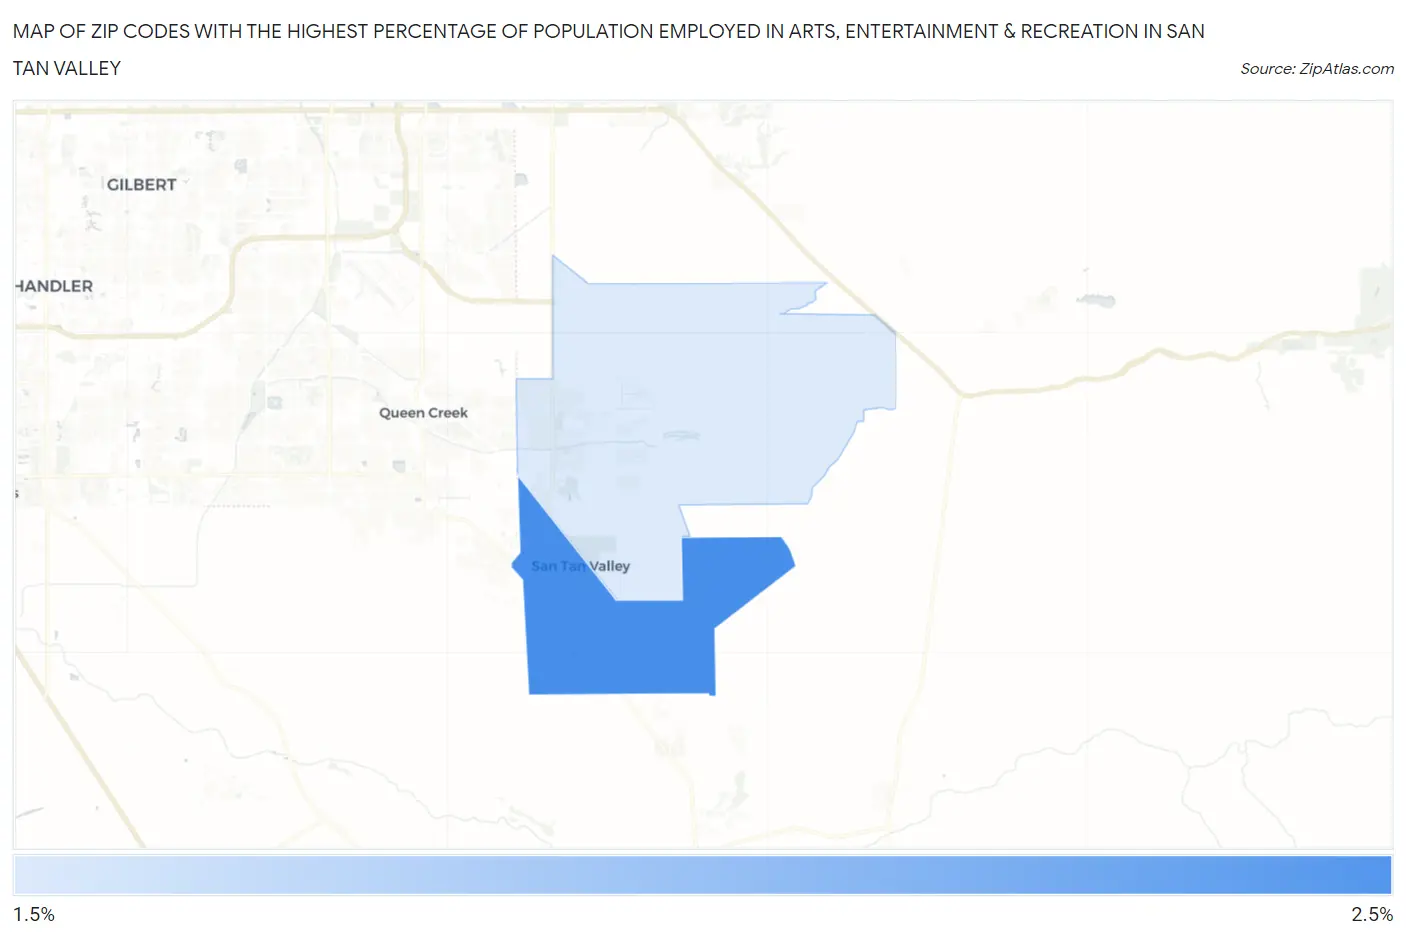
Map of Zip Codes with the Highest Percentage of Population Employed in Arts, Entertainment & Recreation in San Tan Valley
2.0%
2.2%
Zip Codes with the Highest Percentage of Population Employed in Arts, Entertainment & Recreation in San Tan Valley, AZ
| Zip Code | % Employed | vs State | vs National | |
| 1. | 85143 | 2.2% | 2.3%(-0.121)#166 | 2.1%(+0.107)#8,706 |
| 2. | 85140 | 2.0% | 2.3%(-0.294)#183 | 2.1%(-0.066)#9,677 |
1
Common Questions
What are the Top Zip Codes with the Highest Percentage of Population Employed in Arts, Entertainment & Recreation in San Tan Valley, AZ?
Top Zip Codes with the Highest Percentage of Population Employed in Arts, Entertainment & Recreation in San Tan Valley, AZ are:
What zip code has the Highest Percentage of Population Employed in Arts, Entertainment & Recreation in San Tan Valley, AZ?
85143 has the Highest Percentage of Population Employed in Arts, Entertainment & Recreation in San Tan Valley, AZ with 2.2%.
What is the Percentage of Population Employed in Arts, Entertainment & Recreation in San Tan Valley, AZ?
Percentage of Population Employed in Arts, Entertainment & Recreation in San Tan Valley is 1.9%.
What is the Percentage of Population Employed in Arts, Entertainment & Recreation in Arizona?
Percentage of Population Employed in Arts, Entertainment & Recreation in Arizona is 2.3%.
What is the Percentage of Population Employed in Arts, Entertainment & Recreation in the United States?
Percentage of Population Employed in Arts, Entertainment & Recreation in the United States is 2.1%.