Zip Codes with the Highest Percentage of Population Employed in Agriculture, Fishing & Hunting in San Tan Valley, AZ
RELATED REPORTS & OPTIONS
Agriculture, Fishing & Hunting
San Tan Valley
Compare Zip Codes
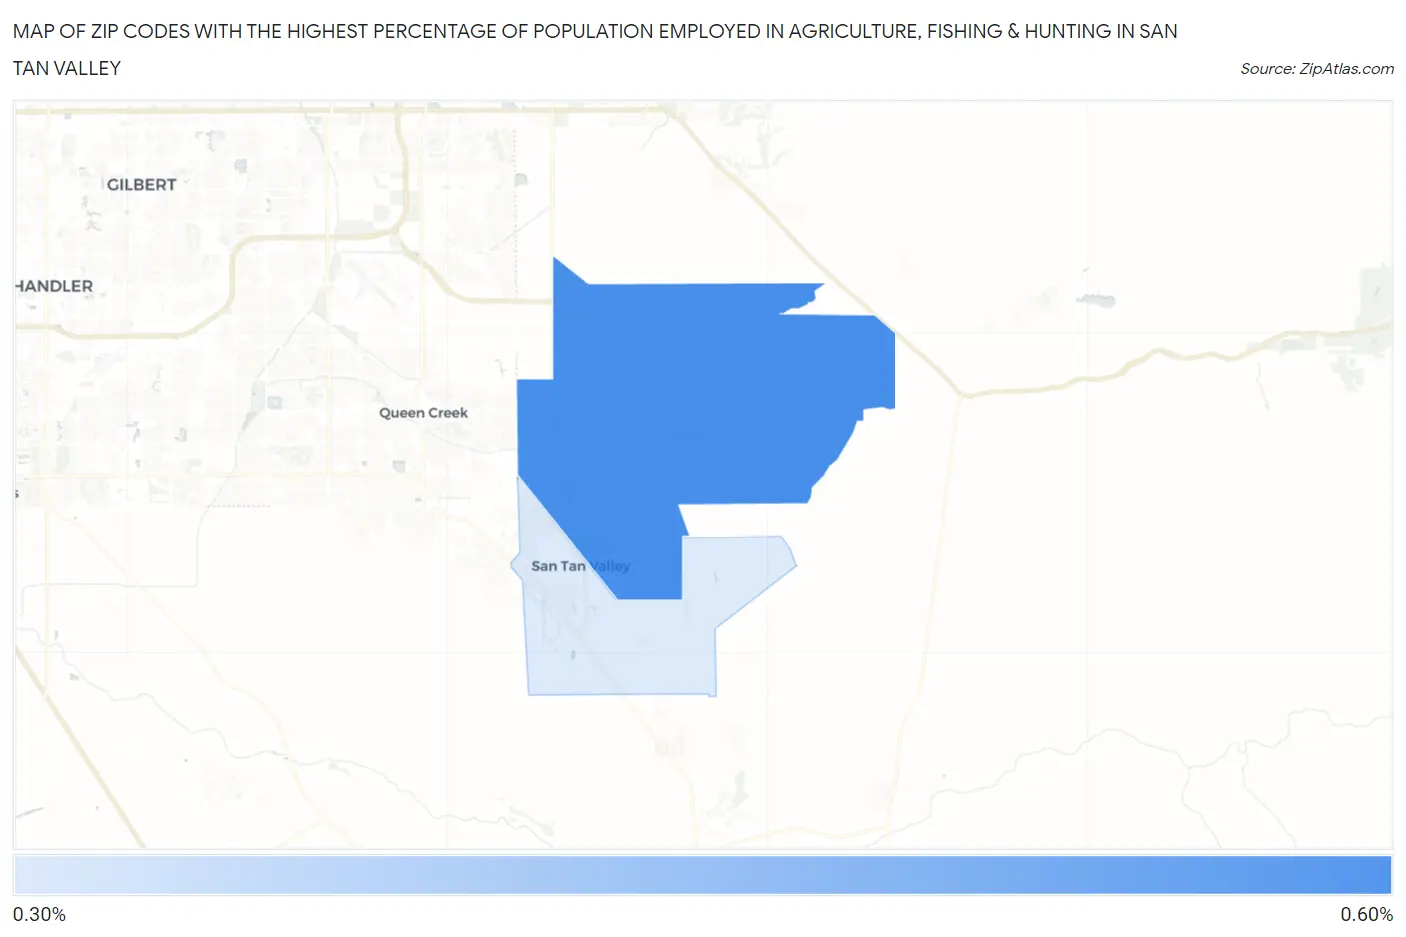
Map of Zip Codes with the Highest Percentage of Population Employed in Agriculture, Fishing & Hunting in San Tan Valley
0.35%
0.55%
Zip Codes with the Highest Percentage of Population Employed in Agriculture, Fishing & Hunting in San Tan Valley, AZ
| Zip Code | % Employed | vs State | vs National | |
| 1. | 85140 | 0.55% | 0.80%(-0.257)#159 | 1.2%(-0.654)#18,890 |
| 2. | 85143 | 0.35% | 0.80%(-0.455)#205 | 1.2%(-0.852)#20,679 |
1
Common Questions
What are the Top Zip Codes with the Highest Percentage of Population Employed in Agriculture, Fishing & Hunting in San Tan Valley, AZ?
Top Zip Codes with the Highest Percentage of Population Employed in Agriculture, Fishing & Hunting in San Tan Valley, AZ are:
What zip code has the Highest Percentage of Population Employed in Agriculture, Fishing & Hunting in San Tan Valley, AZ?
85140 has the Highest Percentage of Population Employed in Agriculture, Fishing & Hunting in San Tan Valley, AZ with 0.55%.
What is the Percentage of Population Employed in Agriculture, Fishing & Hunting in San Tan Valley, AZ?
Percentage of Population Employed in Agriculture, Fishing & Hunting in San Tan Valley is 0.49%.
What is the Percentage of Population Employed in Agriculture, Fishing & Hunting in Arizona?
Percentage of Population Employed in Agriculture, Fishing & Hunting in Arizona is 0.80%.
What is the Percentage of Population Employed in Agriculture, Fishing & Hunting in the United States?
Percentage of Population Employed in Agriculture, Fishing & Hunting in the United States is 1.2%.