Red Rock CDP Apache County, AZ Map & Demographics
Red Rock CDP Apache County Overview
$13,281
PER CAPITA INCOME
$37,500
AVG FAMILY INCOME
$37,500
AVG HOUSEHOLD INCOME
0.13
INEQUALITY / GINI INDEX
75
TOTAL POPULATION
31
MALE POPULATION
44
FEMALE POPULATION
70.45
MALES / 100 FEMALES
141.94
FEMALES / 100 MALES
61.2
MEDIAN AGE
2.5
AVG FAMILY SIZE
2.5
AVG HOUSEHOLD SIZE
14
LABOR FORCE [ PEOPLE ]
18.7%
PERCENT IN LABOR FORCE
Income in Red Rock CDP Apache County
Income Overview in Red Rock CDP Apache County
Per Capita Income in Red Rock CDP Apache County is $13,281, while median incomes of families and households are $37,500 and $37,500 respectively.
| Characteristic | Number | Measure |
| Per Capita Income | 75 | $13,281 |
| Median Family Income | 30 | $37,500 |
| Mean Family Income | 30 | $35,950 |
| Median Household Income | 30 | $37,500 |
| Mean Household Income | 30 | $35,950 |
| Income Deficit | 30 | $0 |
| Wage / Income Gap (%) | 75 | 0.00% |
| Wage / Income Gap ($) | 75 | 100.00¢ per $1 |
| Gini / Inequality Index | 75 | 0.13 |
Earnings by Sex in Red Rock CDP Apache County
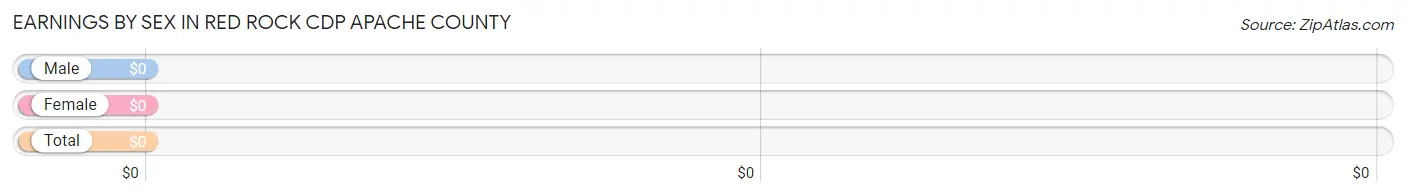
| Sex | Number | Average Earnings |
| Male | 0 (0.0%) | $0 |
| Female | 14 (100.0%) | $0 |
| Total | 14 (100.0%) | $0 |
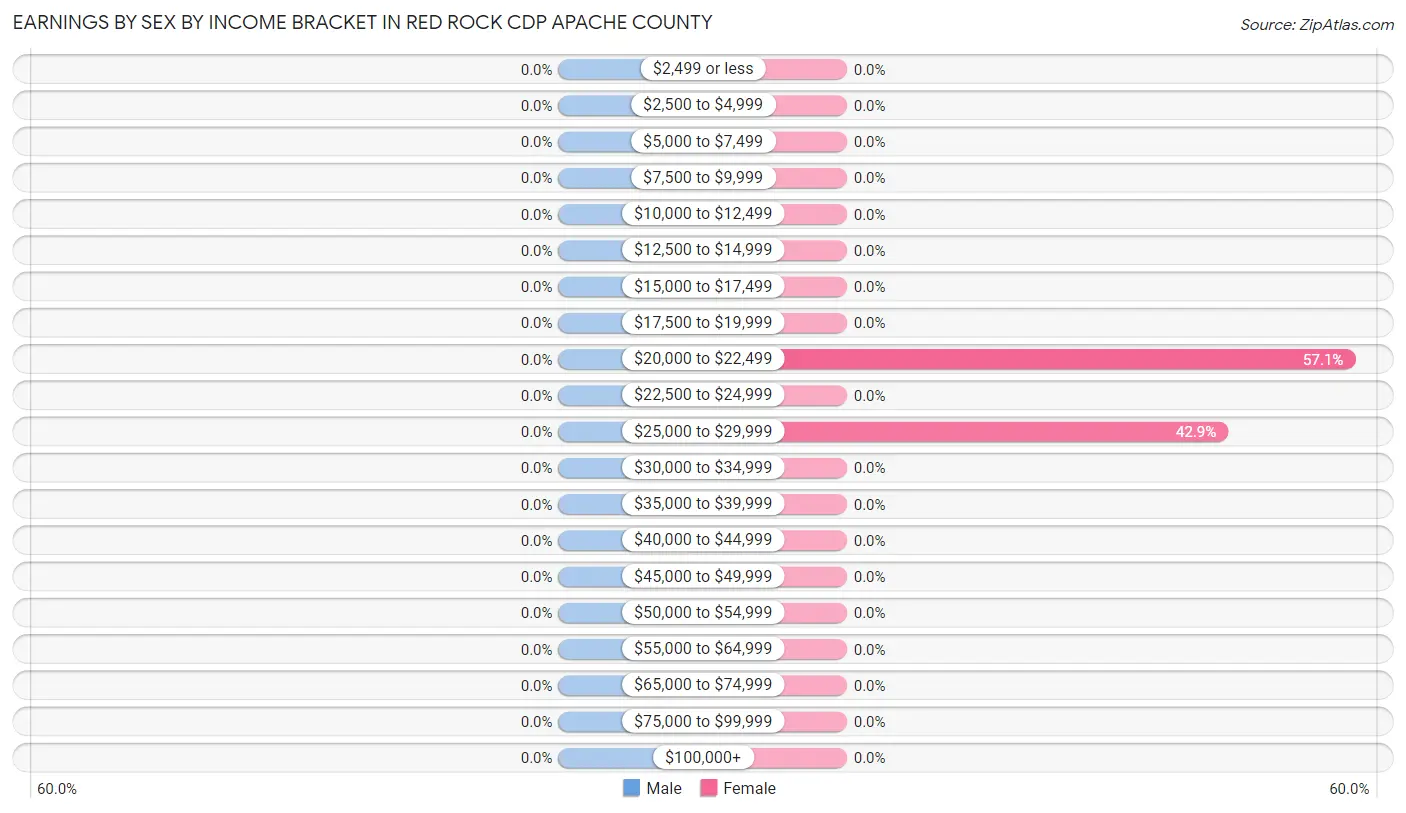
Earnings by Sex by Income Bracket in Red Rock CDP Apache County
| Income | Male | Female |
| $2,499 or less | 0 (0.0%) | 0 (0.0%) |
| $2,500 to $4,999 | 0 (0.0%) | 0 (0.0%) |
| $5,000 to $7,499 | 0 (0.0%) | 0 (0.0%) |
| $7,500 to $9,999 | 0 (0.0%) | 0 (0.0%) |
| $10,000 to $12,499 | 0 (0.0%) | 0 (0.0%) |
| $12,500 to $14,999 | 0 (0.0%) | 0 (0.0%) |
| $15,000 to $17,499 | 0 (0.0%) | 0 (0.0%) |
| $17,500 to $19,999 | 0 (0.0%) | 0 (0.0%) |
| $20,000 to $22,499 | 0 (0.0%) | 8 (57.1%) |
| $22,500 to $24,999 | 0 (0.0%) | 0 (0.0%) |
| $25,000 to $29,999 | 0 (0.0%) | 6 (42.9%) |
| $30,000 to $34,999 | 0 (0.0%) | 0 (0.0%) |
| $35,000 to $39,999 | 0 (0.0%) | 0 (0.0%) |
| $40,000 to $44,999 | 0 (0.0%) | 0 (0.0%) |
| $45,000 to $49,999 | 0 (0.0%) | 0 (0.0%) |
| $50,000 to $54,999 | 0 (0.0%) | 0 (0.0%) |
| $55,000 to $64,999 | 0 (0.0%) | 0 (0.0%) |
| $65,000 to $74,999 | 0 (0.0%) | 0 (0.0%) |
| $75,000 to $99,999 | 0 (0.0%) | 0 (0.0%) |
| $100,000+ | 0 (0.0%) | 0 (0.0%) |
| Total | 0 (0.0%) | 14 (100.0%) |
Earnings by Sex by Educational Attainment in Red Rock CDP Apache County
| Educational Attainment | Male Income | Female Income |
| Less than High School | - | - |
| High School Diploma | - | - |
| College or Associate's Degree | - | - |
| Bachelor's Degree | - | - |
| Graduate Degree | - | - |
| Total | - | - |
Family Income in Red Rock CDP Apache County
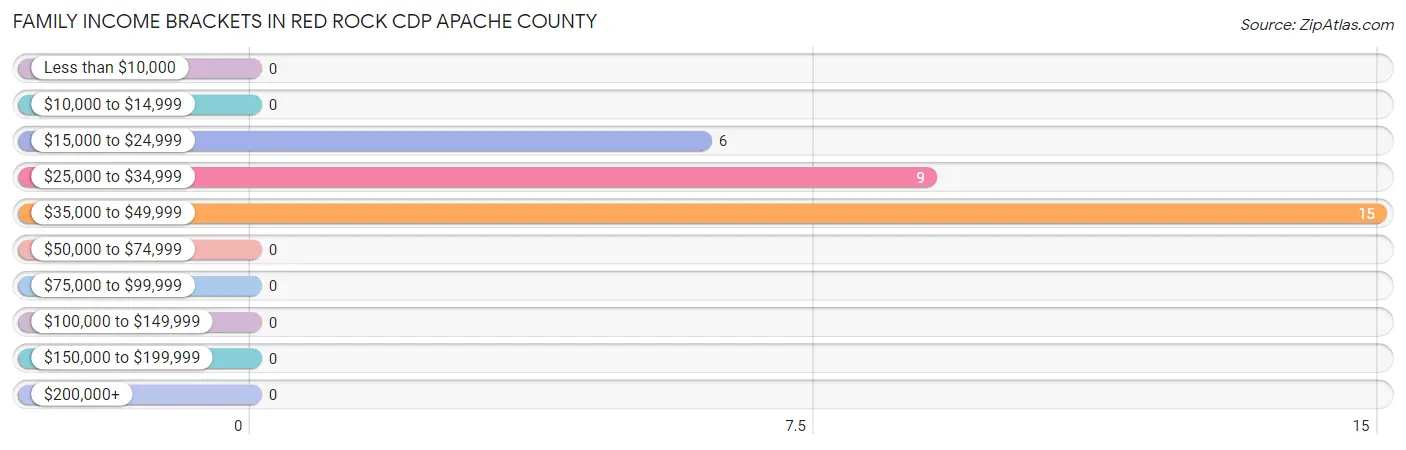
Family Income Brackets in Red Rock CDP Apache County
According to the Red Rock CDP Apache County family income data, there are 15 families falling into the $35,000 to $49,999 income range, which is the most common income bracket and makes up 50.0% of all families.
| Income Bracket | # Families | % Families |
| Less than $10,000 | 0 | 0.0% |
| $10,000 to $14,999 | 0 | 0.0% |
| $15,000 to $24,999 | 6 | 20.0% |
| $25,000 to $34,999 | 9 | 30.0% |
| $35,000 to $49,999 | 15 | 50.0% |
| $50,000 to $74,999 | 0 | 0.0% |
| $75,000 to $99,999 | 0 | 0.0% |
| $100,000 to $149,999 | 0 | 0.0% |
| $150,000 to $199,999 | 0 | 0.0% |
| $200,000+ | 0 | 0.0% |
Family Income by Famaliy Size in Red Rock CDP Apache County
2-person families (19 | 63.3%) account for the highest median family income in Red Rock CDP Apache County with $28,958 per family, while 2-person families (19 | 63.3%) have the highest median income of $14,479 per family member.
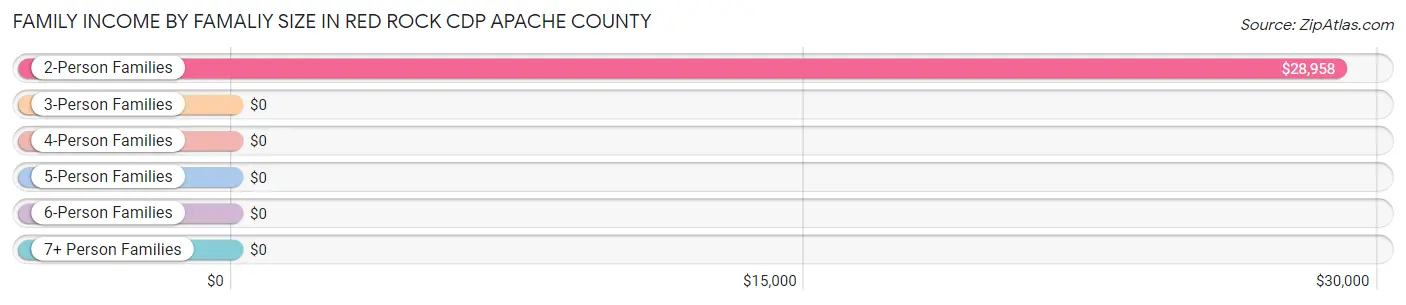
| Income Bracket | # Families | Median Income |
| 2-Person Families | 19 (63.3%) | $28,958 |
| 3-Person Families | 11 (36.7%) | $0 |
| 4-Person Families | 0 (0.0%) | $0 |
| 5-Person Families | 0 (0.0%) | $0 |
| 6-Person Families | 0 (0.0%) | $0 |
| 7+ Person Families | 0 (0.0%) | $0 |
| Total | 30 (100.0%) | $37,500 |
Family Income by Number of Earners in Red Rock CDP Apache County
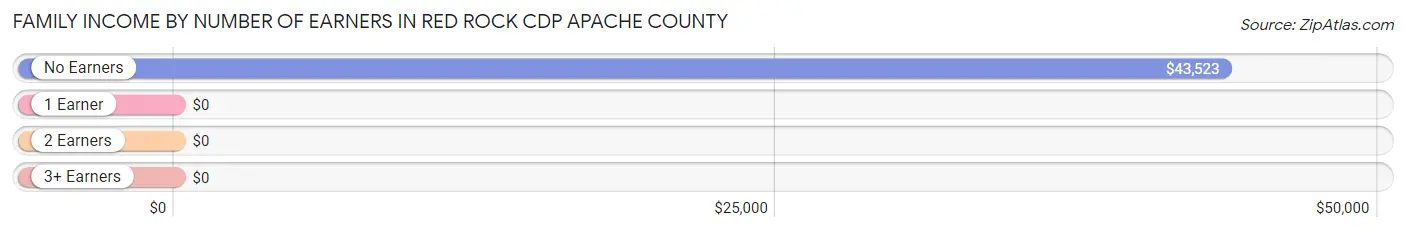
| Number of Earners | # Families | Median Income |
| No Earners | 21 (70.0%) | $43,523 |
| 1 Earner | 9 (30.0%) | $0 |
| 2 Earners | 0 (0.0%) | $0 |
| 3+ Earners | 0 (0.0%) | $0 |
| Total | 30 (100.0%) | $37,500 |
Household Income in Red Rock CDP Apache County
Household Income Brackets in Red Rock CDP Apache County
With 15 households falling in the category, the $35,000 to $49,999 income range is the most frequent in Red Rock CDP Apache County, accounting for 50.0% of all households.
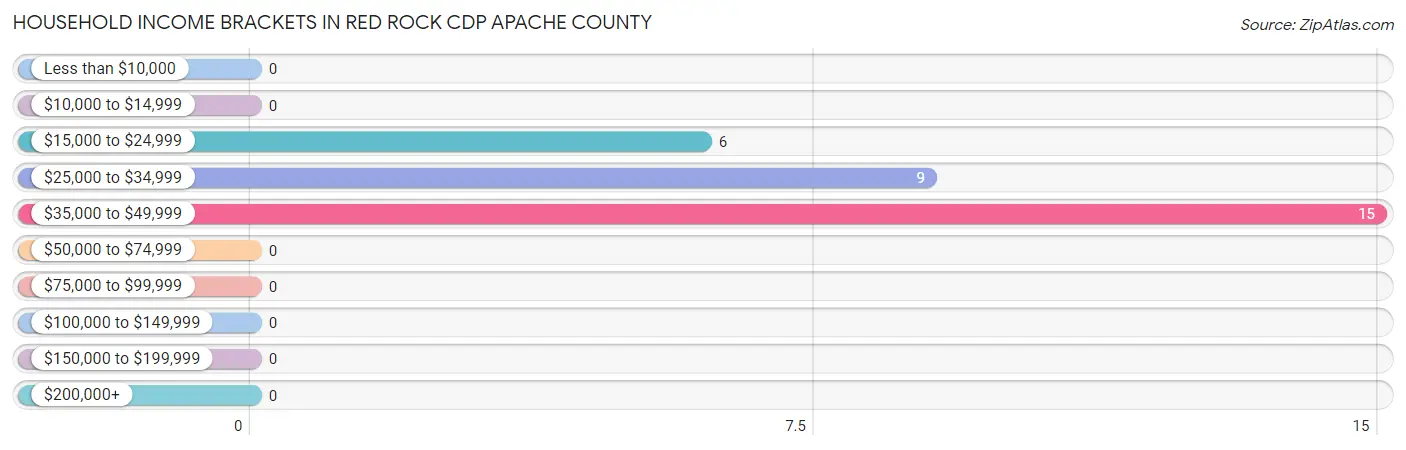
| Income Bracket | # Households | % Households |
| Less than $10,000 | 0 | 0.0% |
| $10,000 to $14,999 | 0 | 0.0% |
| $15,000 to $24,999 | 6 | 20.0% |
| $25,000 to $34,999 | 9 | 30.0% |
| $35,000 to $49,999 | 15 | 50.0% |
| $50,000 to $74,999 | 0 | 0.0% |
| $75,000 to $99,999 | 0 | 0.0% |
| $100,000 to $149,999 | 0 | 0.0% |
| $150,000 to $199,999 | 0 | 0.0% |
| $200,000+ | 0 | 0.0% |
Household Income by Householder Age in Red Rock CDP Apache County
The median household income in Red Rock CDP Apache County is $37,500, with the highest median household income of $28,333 found in the 45 to 64 years age bracket for the primary householder. A total of 16 households (53.3%) fall into this category.
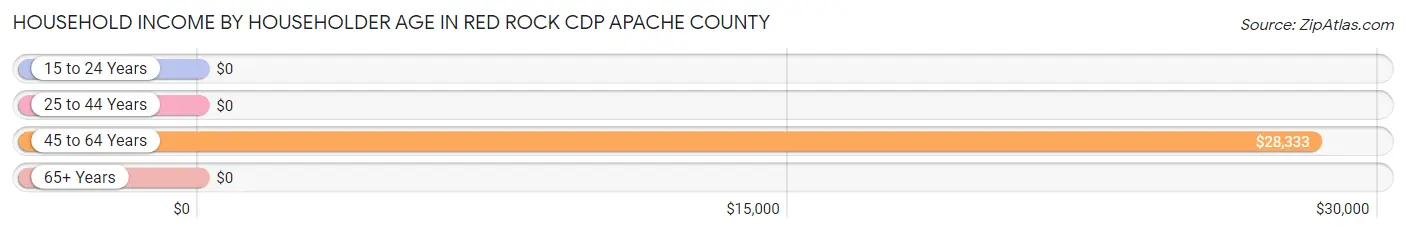
| Income Bracket | # Households | Median Income |
| 15 to 24 Years | 0 (0.0%) | $0 |
| 25 to 44 Years | 0 (0.0%) | $0 |
| 45 to 64 Years | 16 (53.3%) | $28,333 |
| 65+ Years | 14 (46.7%) | $0 |
| Total | 30 (100.0%) | $37,500 |
Poverty in Red Rock CDP Apache County
Income Below Poverty by Sex and Age in Red Rock CDP Apache County
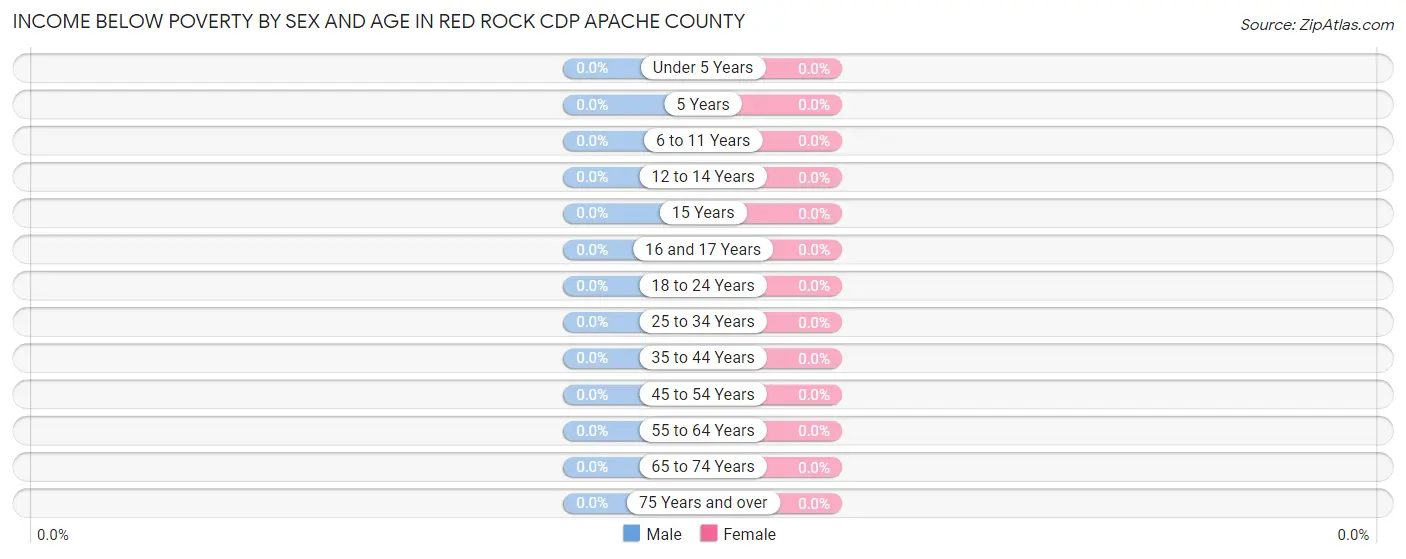
| Age Bracket | Male | Female |
| Under 5 Years | 0 (0.0%) | 0 (0.0%) |
| 5 Years | 0 (0.0%) | 0 (0.0%) |
| 6 to 11 Years | 0 (0.0%) | 0 (0.0%) |
| 12 to 14 Years | 0 (0.0%) | 0 (0.0%) |
| 15 Years | 0 (0.0%) | 0 (0.0%) |
| 16 and 17 Years | 0 (0.0%) | 0 (0.0%) |
| 18 to 24 Years | 0 (0.0%) | 0 (0.0%) |
| 25 to 34 Years | 0 (0.0%) | 0 (0.0%) |
| 35 to 44 Years | 0 (0.0%) | 0 (0.0%) |
| 45 to 54 Years | 0 (0.0%) | 0 (0.0%) |
| 55 to 64 Years | 0 (0.0%) | 0 (0.0%) |
| 65 to 74 Years | 0 (0.0%) | 0 (0.0%) |
| 75 Years and over | 0 (0.0%) | 0 (0.0%) |
| Total | 0 (0.0%) | 0 (0.0%) |
Income Above Poverty by Sex and Age in Red Rock CDP Apache County
According to the poverty statistics in Red Rock CDP Apache County, males aged 25 to 34 years and females aged 35 to 44 years are the age groups that are most secure financially, with 100.0% of males and 100.0% of females in these age groups living above the poverty line.
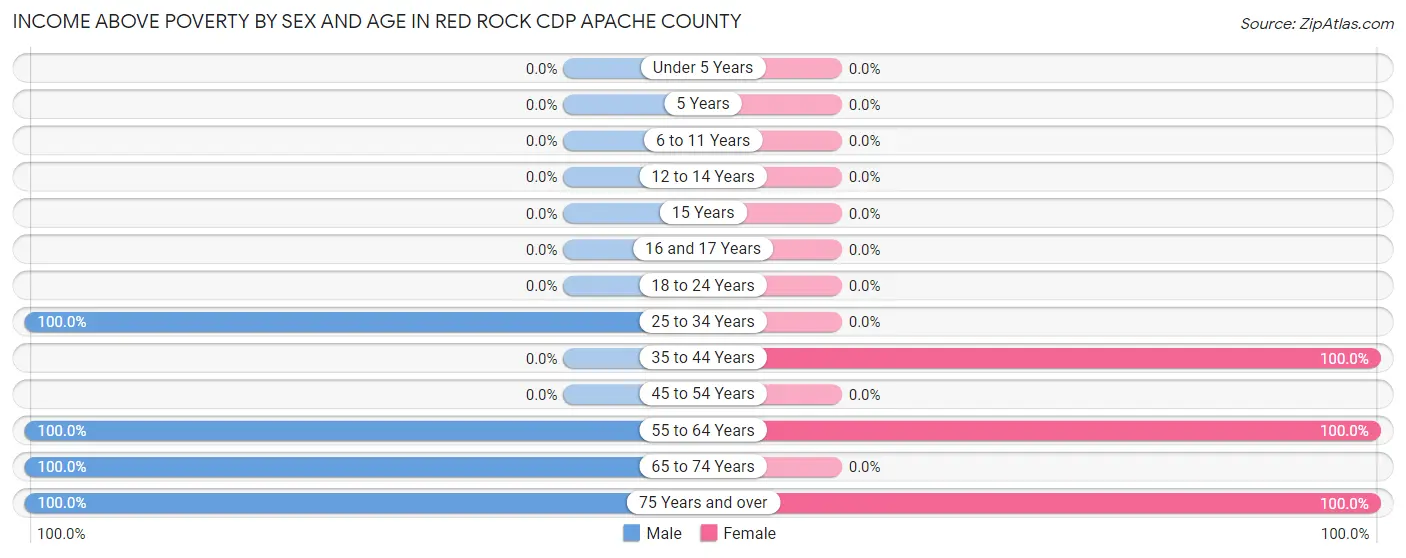
| Age Bracket | Male | Female |
| Under 5 Years | 0 (0.0%) | 0 (0.0%) |
| 5 Years | 0 (0.0%) | 0 (0.0%) |
| 6 to 11 Years | 0 (0.0%) | 0 (0.0%) |
| 12 to 14 Years | 0 (0.0%) | 0 (0.0%) |
| 15 Years | 0 (0.0%) | 0 (0.0%) |
| 16 and 17 Years | 0 (0.0%) | 0 (0.0%) |
| 18 to 24 Years | 0 (0.0%) | 0 (0.0%) |
| 25 to 34 Years | 12 (100.0%) | 0 (0.0%) |
| 35 to 44 Years | 0 (0.0%) | 8 (100.0%) |
| 45 to 54 Years | 0 (0.0%) | 0 (0.0%) |
| 55 to 64 Years | 10 (100.0%) | 25 (100.0%) |
| 65 to 74 Years | 6 (100.0%) | 0 (0.0%) |
| 75 Years and over | 3 (100.0%) | 11 (100.0%) |
| Total | 31 (100.0%) | 44 (100.0%) |
Income Below Poverty Among Married-Couple Families in Red Rock CDP Apache County
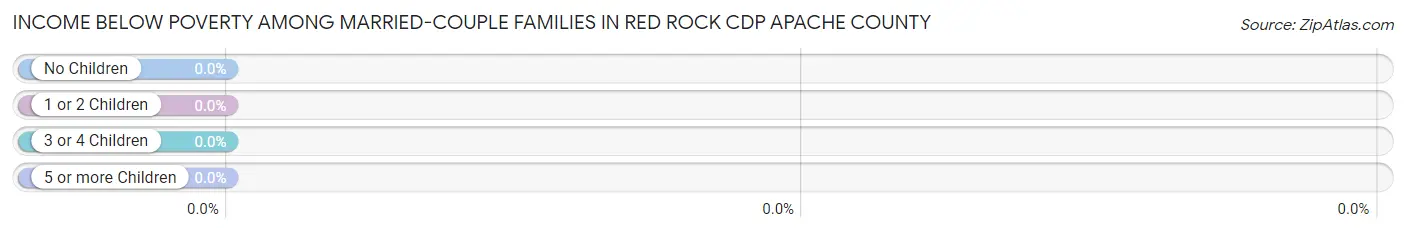
| Children | Above Poverty | Below Poverty |
| No Children | 10 (100.0%) | 0 (0.0%) |
| 1 or 2 Children | 0 (0.0%) | 0 (0.0%) |
| 3 or 4 Children | 0 (0.0%) | 0 (0.0%) |
| 5 or more Children | 0 (0.0%) | 0 (0.0%) |
| Total | 10 (100.0%) | 0 (0.0%) |
Income Below Poverty Among Single-Parent Households in Red Rock CDP Apache County
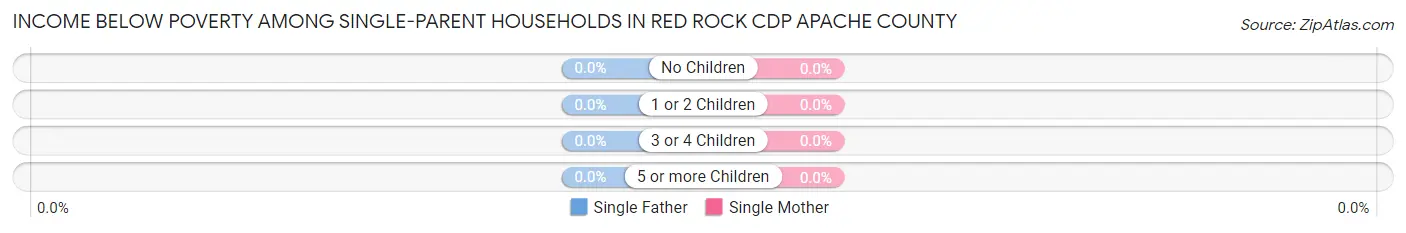
| Children | Single Father | Single Mother |
| No Children | 0 (0.0%) | 0 (0.0%) |
| 1 or 2 Children | 0 (0.0%) | 0 (0.0%) |
| 3 or 4 Children | 0 (0.0%) | 0 (0.0%) |
| 5 or more Children | 0 (0.0%) | 0 (0.0%) |
| Total | 0 (0.0%) | 0 (0.0%) |
Income Below Poverty Among Married-Couple vs Single-Parent Households in Red Rock CDP Apache County
| Children | Married-Couple Families | Single-Parent Households |
| No Children | 0 (0.0%) | 0 (0.0%) |
| 1 or 2 Children | 0 (0.0%) | 0 (0.0%) |
| 3 or 4 Children | 0 (0.0%) | 0 (0.0%) |
| 5 or more Children | 0 (0.0%) | 0 (0.0%) |
| Total | 0 (0.0%) | 0 (0.0%) |
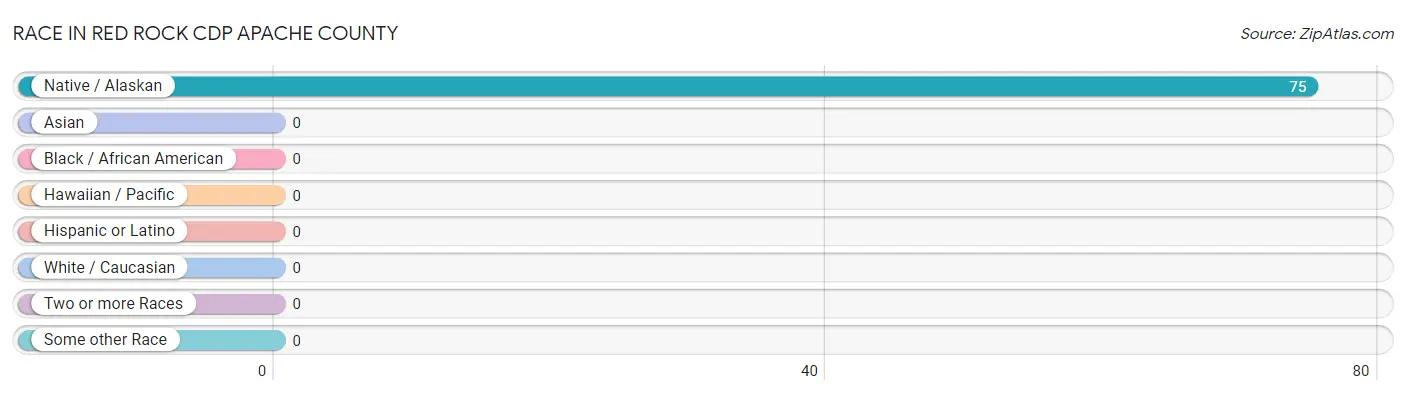
Race in Red Rock CDP Apache County
The most populous races in Red Rock CDP Apache County are , and Native / Alaskan (75 | 100.0%).
| Race | # Population | % Population |
| Asian | 0 | 0.0% |
| Black / African American | 0 | 0.0% |
| Hawaiian / Pacific | 0 | 0.0% |
| Hispanic or Latino | 0 | 0.0% |
| Native / Alaskan | 75 | 100.0% |
| White / Caucasian | 0 | 0.0% |
| Two or more Races | 0 | 0.0% |
| Some other Race | 0 | 0.0% |
| Total | 75 | 100.0% |
Ancestry in Red Rock CDP Apache County
The most populous ancestries reported in Red Rock CDP Apache County are , and Navajo (75 | 100.0%), together accounting for 100.0% of all Red Rock CDP Apache County residents.

| Ancestry | # Population | % Population |
| Navajo | 75 | 100.0% | View All 1 Rows |
Immigrants in Red Rock CDP Apache County

| Immigration Origin | # Population | % Population | View All 0 Rows |
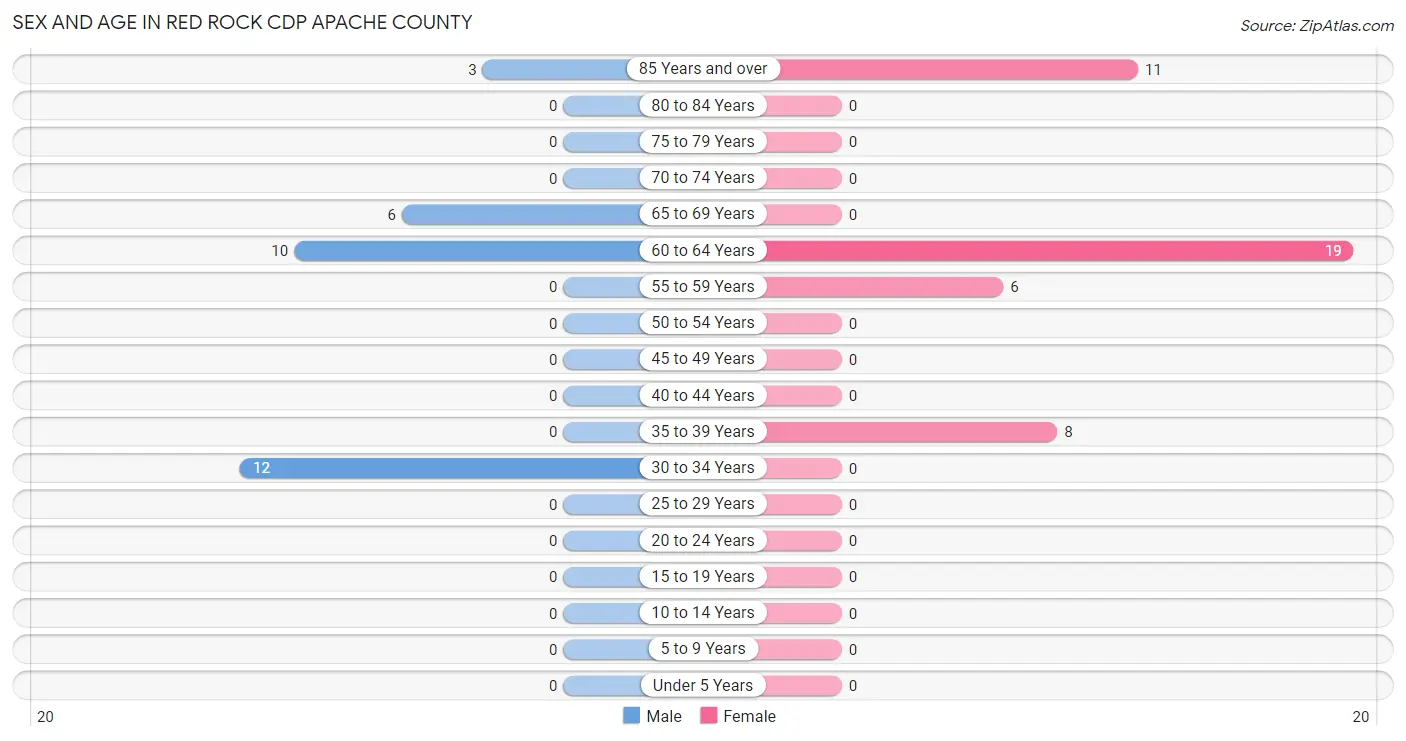
Sex and Age in Red Rock CDP Apache County
Sex and Age in Red Rock CDP Apache County
The most populous age groups in Red Rock CDP Apache County are 30 to 34 Years (12 | 38.7%) for men and 60 to 64 Years (19 | 43.2%) for women.
| Age Bracket | Male | Female |
| Under 5 Years | 0 (0.0%) | 0 (0.0%) |
| 5 to 9 Years | 0 (0.0%) | 0 (0.0%) |
| 10 to 14 Years | 0 (0.0%) | 0 (0.0%) |
| 15 to 19 Years | 0 (0.0%) | 0 (0.0%) |
| 20 to 24 Years | 0 (0.0%) | 0 (0.0%) |
| 25 to 29 Years | 0 (0.0%) | 0 (0.0%) |
| 30 to 34 Years | 12 (38.7%) | 0 (0.0%) |
| 35 to 39 Years | 0 (0.0%) | 8 (18.2%) |
| 40 to 44 Years | 0 (0.0%) | 0 (0.0%) |
| 45 to 49 Years | 0 (0.0%) | 0 (0.0%) |
| 50 to 54 Years | 0 (0.0%) | 0 (0.0%) |
| 55 to 59 Years | 0 (0.0%) | 6 (13.6%) |
| 60 to 64 Years | 10 (32.3%) | 19 (43.2%) |
| 65 to 69 Years | 6 (19.4%) | 0 (0.0%) |
| 70 to 74 Years | 0 (0.0%) | 0 (0.0%) |
| 75 to 79 Years | 0 (0.0%) | 0 (0.0%) |
| 80 to 84 Years | 0 (0.0%) | 0 (0.0%) |
| 85 Years and over | 3 (9.7%) | 11 (25.0%) |
| Total | 31 (100.0%) | 44 (100.0%) |
Families and Households in Red Rock CDP Apache County
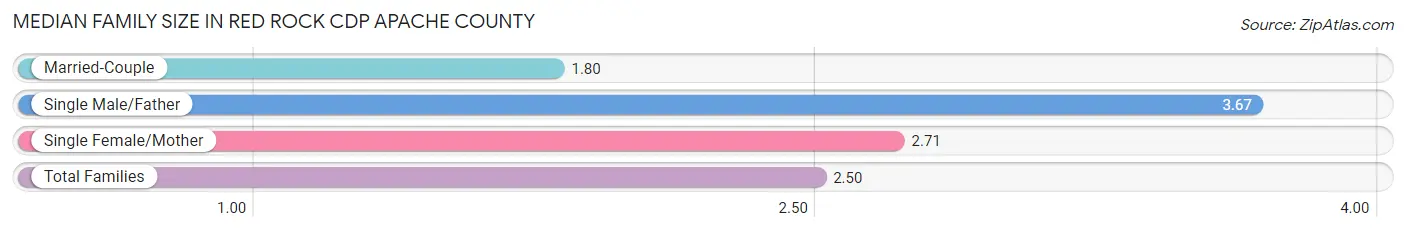
Median Family Size in Red Rock CDP Apache County
The median family size in Red Rock CDP Apache County is 2.50 persons per family, with single male/father families (3 | 10.0%) accounting for the largest median family size of 3.67 persons per family. On the other hand, married-couple families (10 | 33.3%) represent the smallest median family size with 1.80 persons per family.
| Family Type | # Families | Family Size |
| Married-Couple | 10 (33.3%) | 1.80 |
| Single Male/Father | 3 (10.0%) | 3.67 |
| Single Female/Mother | 17 (56.7%) | 2.71 |
| Total Families | 30 (100.0%) | 2.50 |
Median Household Size in Red Rock CDP Apache County
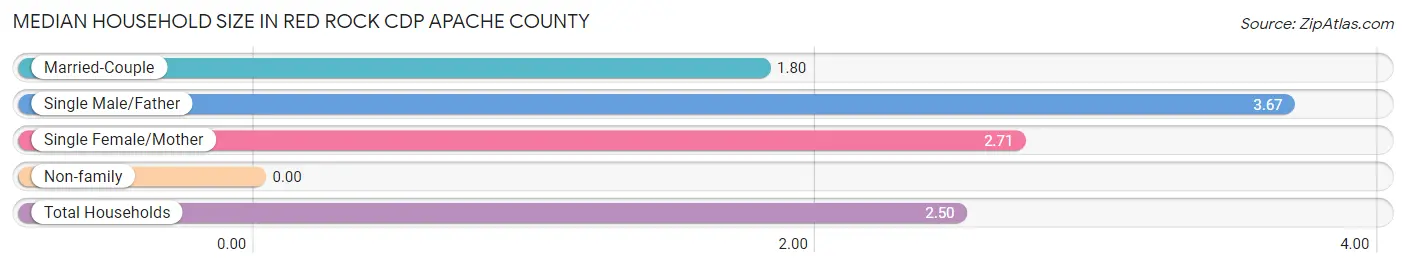
| Household Type | # Households | Household Size |
| Married-Couple | 10 (33.3%) | 1.80 |
| Single Male/Father | 3 (10.0%) | 3.67 |
| Single Female/Mother | 17 (56.7%) | 2.71 |
| Non-family | 0 (0.0%) | - |
| Total Households | 30 (100.0%) | 2.50 |
Household Size by Marriage Status in Red Rock CDP Apache County
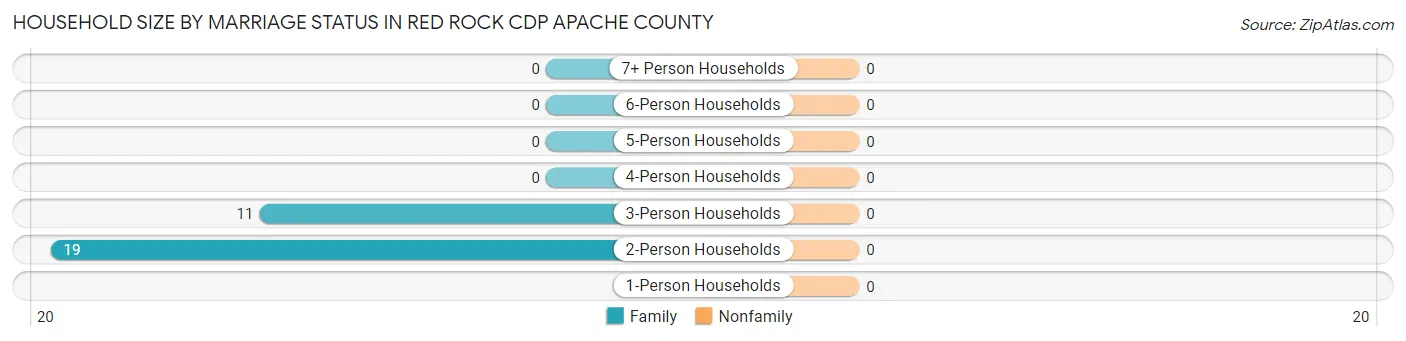
| Household Size | Family Households | Nonfamily Households |
| 1-Person Households | - | 0 (0.0%) |
| 2-Person Households | 19 (63.3%) | 0 (0.0%) |
| 3-Person Households | 11 (36.7%) | 0 (0.0%) |
| 4-Person Households | 0 (0.0%) | 0 (0.0%) |
| 5-Person Households | 0 (0.0%) | 0 (0.0%) |
| 6-Person Households | 0 (0.0%) | 0 (0.0%) |
| 7+ Person Households | 0 (0.0%) | 0 (0.0%) |
| Total | 30 (100.0%) | 0 (0.0%) |
Female Fertility in Red Rock CDP Apache County
Fertility by Age in Red Rock CDP Apache County
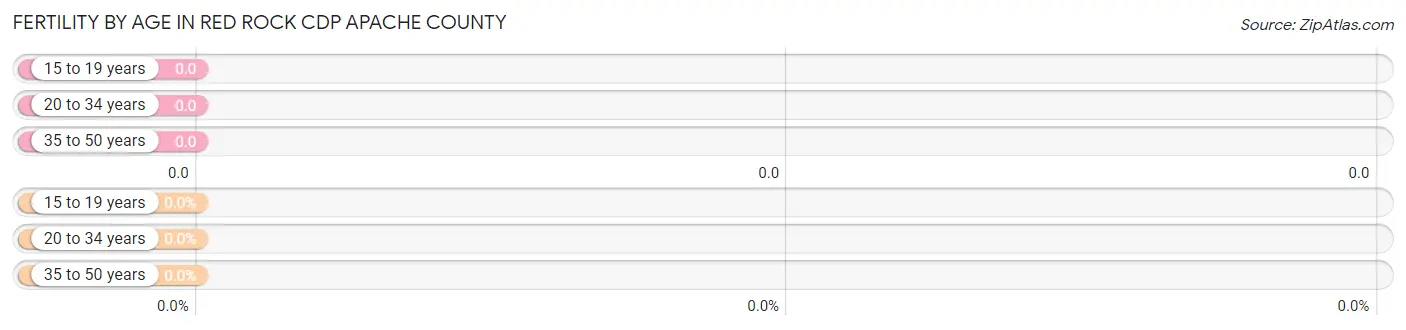
| Age Bracket | Women with Births | Births / 1,000 Women |
| 15 to 19 years | 0 (0.0%) | 0.0 |
| 20 to 34 years | 0 (0.0%) | 0.0 |
| 35 to 50 years | 0 (0.0%) | 0.0 |
| Total | 0 (0.0%) | 0.0 |
Fertility by Age by Marriage Status in Red Rock CDP Apache County
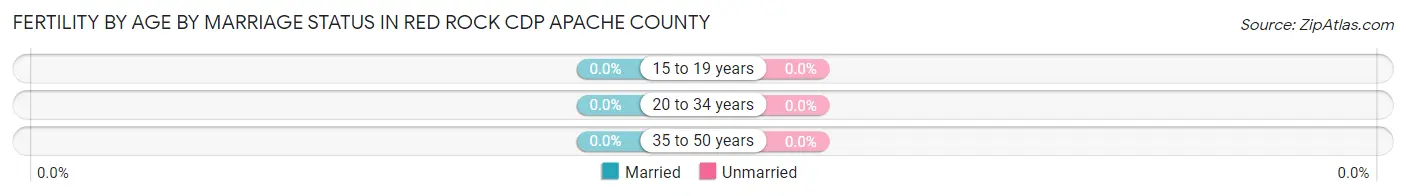
| Age Bracket | Married | Unmarried |
| 15 to 19 years | 0 (0.0%) | 0 (0.0%) |
| 20 to 34 years | 0 (0.0%) | 0 (0.0%) |
| 35 to 50 years | 0 (0.0%) | 0 (0.0%) |
| Total | 0 (0.0%) | 0 (0.0%) |
Fertility by Education in Red Rock CDP Apache County
| Educational Attainment | Women with Births | Births / 1,000 Women |
| Less than High School | 0 (0.0%) | 0.0 |
| High School Diploma | 0 (0.0%) | 0.0 |
| College or Associate's Degree | 0 (0.0%) | 0.0 |
| Bachelor's Degree | 0 (0.0%) | 0.0 |
| Graduate Degree | 0 (0.0%) | 0.0 |
| Total | 0 (0.0%) | 0.0 |
Fertility by Education by Marriage Status in Red Rock CDP Apache County
| Educational Attainment | Married | Unmarried |
| Less than High School | 0 (0.0%) | 0 (0.0%) |
| High School Diploma | 0 (0.0%) | 0 (0.0%) |
| College or Associate's Degree | 0 (0.0%) | 0 (0.0%) |
| Bachelor's Degree | 0 (0.0%) | 0 (0.0%) |
| Graduate Degree | 0 (0.0%) | 0 (0.0%) |
| Total | 0 (0.0%) | 0 (0.0%) |
Employment Characteristics in Red Rock CDP Apache County
Employment by Class of Employer in Red Rock CDP Apache County
Among the 14 employed individuals in Red Rock CDP Apache County, private company employees (8 | 57.1%), and federal government employees (6 | 42.9%) make up the most common classes of employment.
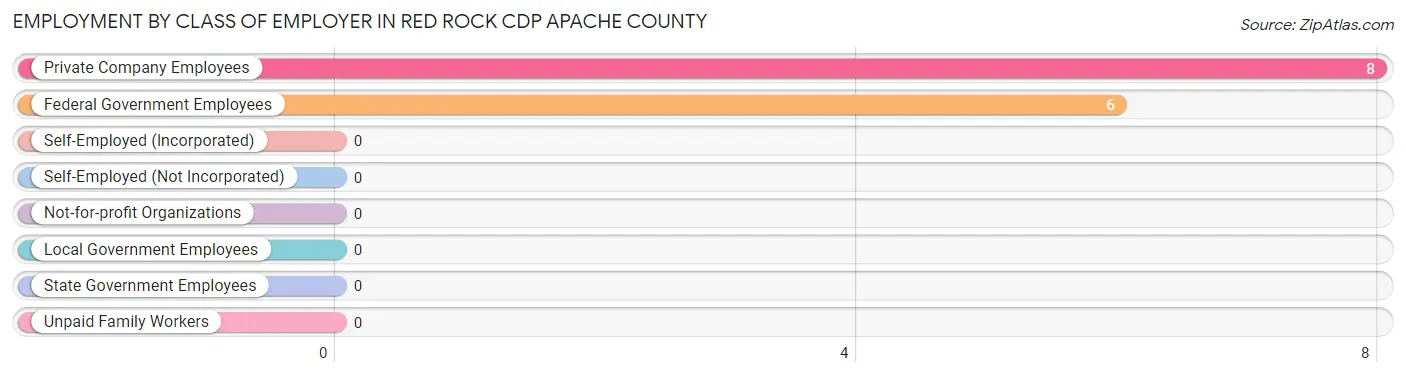
| Employer Class | # Employees | % Employees |
| Private Company Employees | 8 | 57.1% |
| Self-Employed (Incorporated) | 0 | 0.0% |
| Self-Employed (Not Incorporated) | 0 | 0.0% |
| Not-for-profit Organizations | 0 | 0.0% |
| Local Government Employees | 0 | 0.0% |
| State Government Employees | 0 | 0.0% |
| Federal Government Employees | 6 | 42.9% |
| Unpaid Family Workers | 0 | 0.0% |
| Total | 14 | 100.0% |
Employment Status by Age in Red Rock CDP Apache County
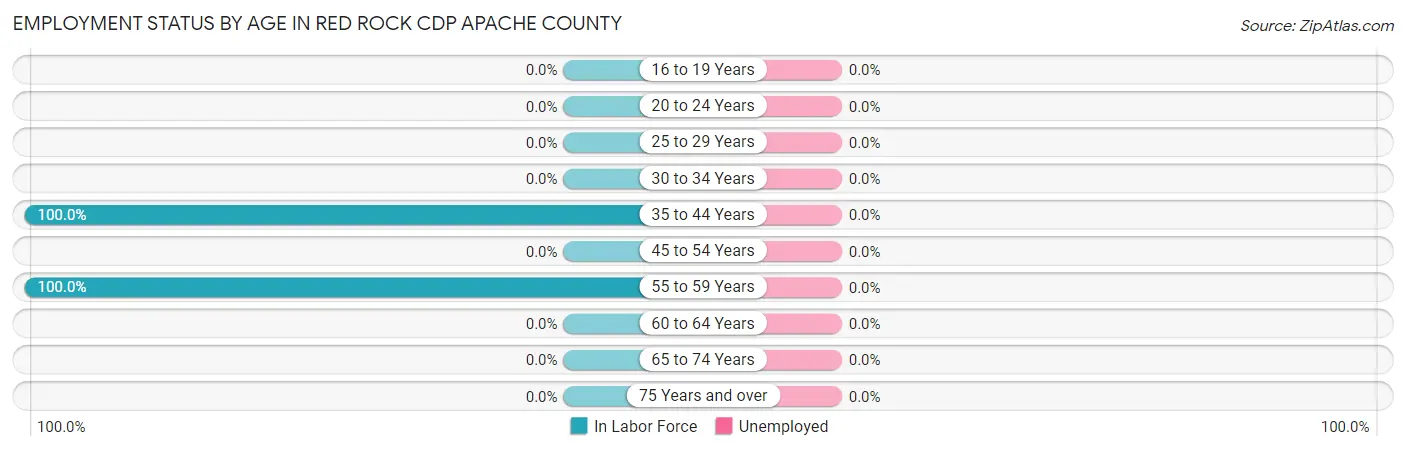
| Age Bracket | In Labor Force | Unemployed |
| 16 to 19 Years | 0 (0.0%) | 0 (0.0%) |
| 20 to 24 Years | 0 (0.0%) | 0 (0.0%) |
| 25 to 29 Years | 0 (0.0%) | 0 (0.0%) |
| 30 to 34 Years | 0 (0.0%) | 0 (0.0%) |
| 35 to 44 Years | 8 (100.0%) | 0 (0.0%) |
| 45 to 54 Years | 0 (0.0%) | 0 (0.0%) |
| 55 to 59 Years | 6 (100.0%) | 0 (0.0%) |
| 60 to 64 Years | 0 (0.0%) | 0 (0.0%) |
| 65 to 74 Years | 0 (0.0%) | 0 (0.0%) |
| 75 Years and over | 0 (0.0%) | 0 (0.0%) |
| Total | 14 (18.7%) | 0 (0.0%) |
Employment Status by Educational Attainment in Red Rock CDP Apache County
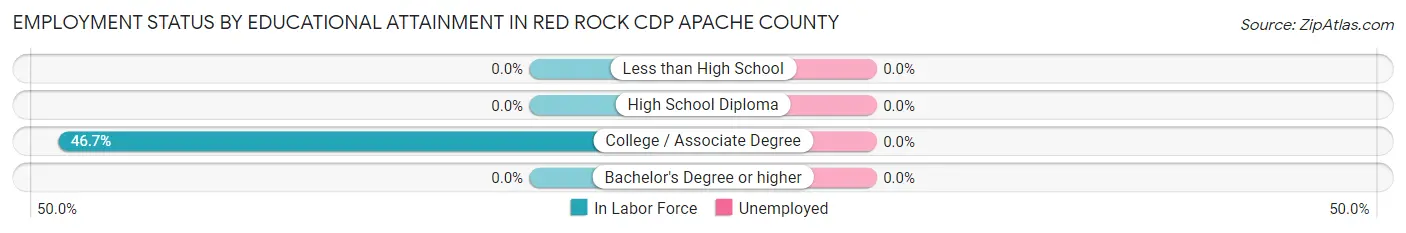
| Educational Attainment | In Labor Force | Unemployed |
| Less than High School | 0 (0.0%) | 0 (0.0%) |
| High School Diploma | 0 (0.0%) | 0 (0.0%) |
| College / Associate Degree | 14 (46.7%) | 0 (0.0%) |
| Bachelor's Degree or higher | 0 (0.0%) | 0 (0.0%) |
| Total | 14 (25.5%) | 0 (0.0%) |
Employment Occupations by Sex in Red Rock CDP Apache County
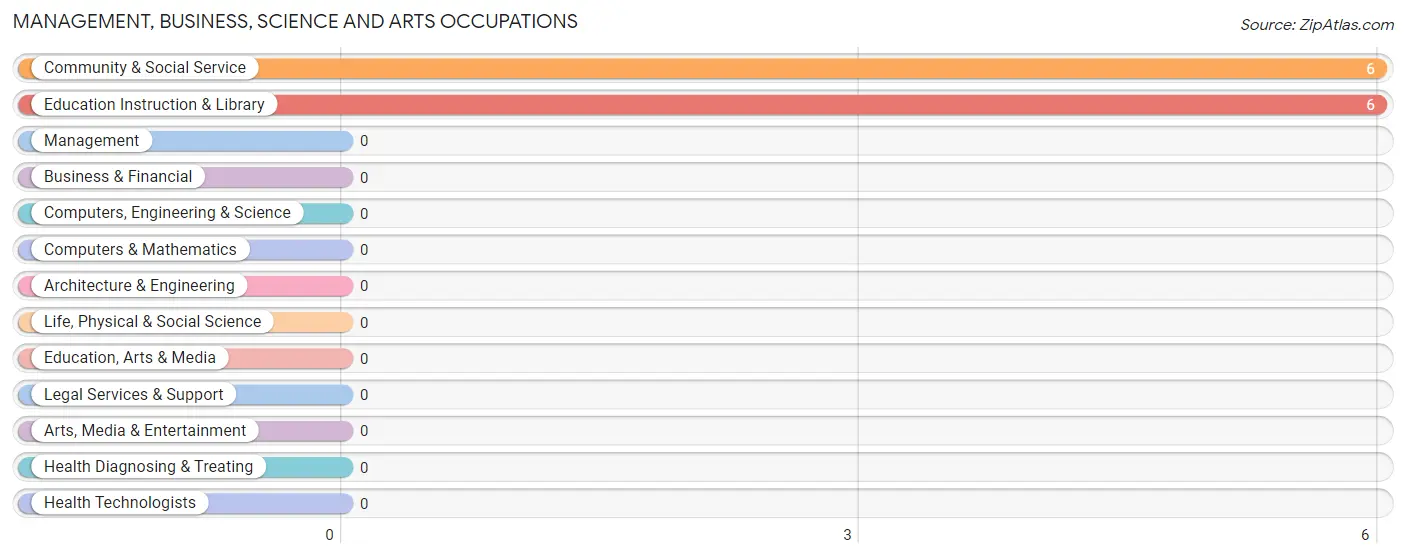
Management, Business, Science and Arts Occupations
The most common Management, Business, Science and Arts occupations in Red Rock CDP Apache County are Community & Social Service (6 | 42.9%), and Education Instruction & Library (6 | 42.9%).
Management, Business, Science and Arts Occupations by Sex
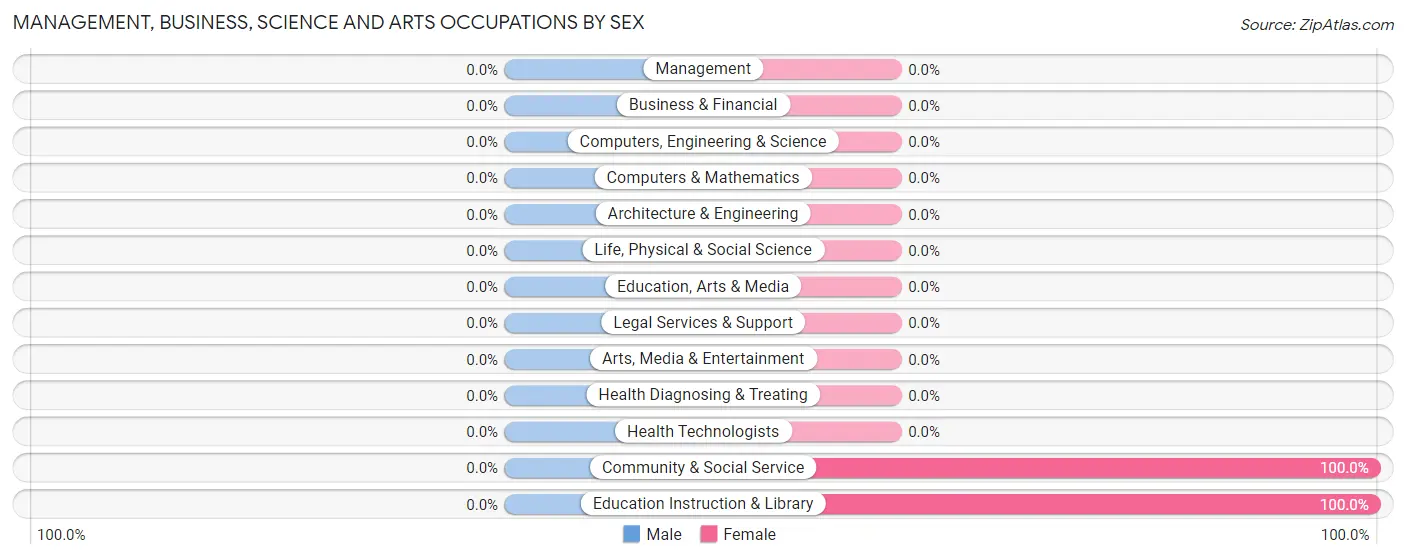
| Occupation | Male | Female |
| Management | 0 (0.0%) | 0 (0.0%) |
| Business & Financial | 0 (0.0%) | 0 (0.0%) |
| Computers, Engineering & Science | 0 (0.0%) | 0 (0.0%) |
| Computers & Mathematics | 0 (0.0%) | 0 (0.0%) |
| Architecture & Engineering | 0 (0.0%) | 0 (0.0%) |
| Life, Physical & Social Science | 0 (0.0%) | 0 (0.0%) |
| Community & Social Service | 0 (0.0%) | 6 (100.0%) |
| Education, Arts & Media | 0 (0.0%) | 0 (0.0%) |
| Legal Services & Support | 0 (0.0%) | 0 (0.0%) |
| Education Instruction & Library | 0 (0.0%) | 6 (100.0%) |
| Arts, Media & Entertainment | 0 (0.0%) | 0 (0.0%) |
| Health Diagnosing & Treating | 0 (0.0%) | 0 (0.0%) |
| Health Technologists | 0 (0.0%) | 0 (0.0%) |
| Total (Category) | 0 (0.0%) | 6 (100.0%) |
| Total (Overall) | 0 (0.0%) | 14 (100.0%) |
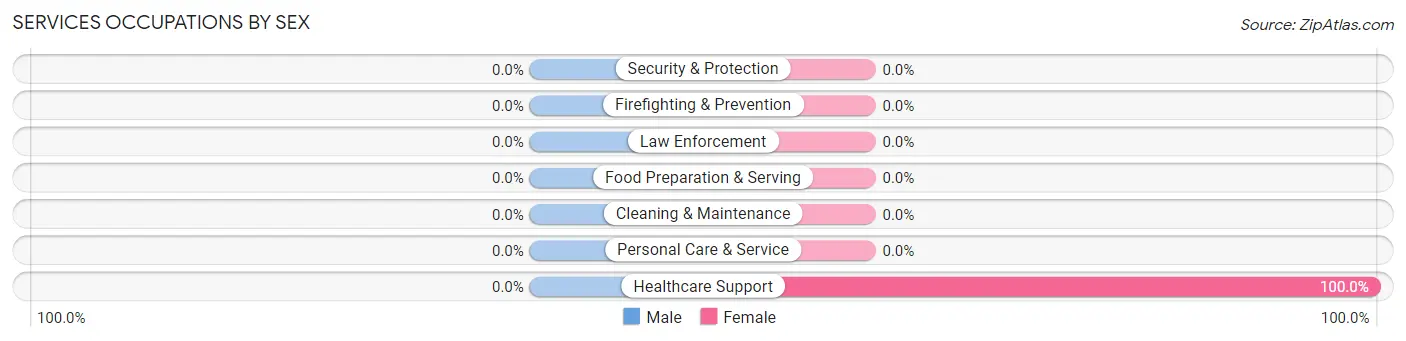
Services Occupations
The most common Services occupations in Red Rock CDP Apache County are , and Healthcare Support (8 | 57.1%).
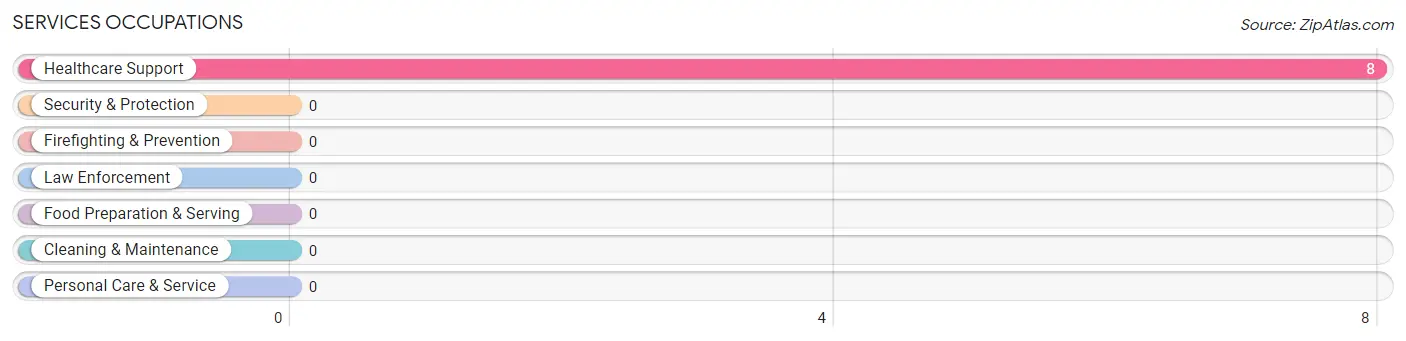
Services Occupations by Sex
| Occupation | Male | Female |
| Healthcare Support | 0 (0.0%) | 8 (100.0%) |
| Security & Protection | 0 (0.0%) | 0 (0.0%) |
| Firefighting & Prevention | 0 (0.0%) | 0 (0.0%) |
| Law Enforcement | 0 (0.0%) | 0 (0.0%) |
| Food Preparation & Serving | 0 (0.0%) | 0 (0.0%) |
| Cleaning & Maintenance | 0 (0.0%) | 0 (0.0%) |
| Personal Care & Service | 0 (0.0%) | 0 (0.0%) |
| Total (Category) | 0 (0.0%) | 8 (100.0%) |
| Total (Overall) | 0 (0.0%) | 14 (100.0%) |
Sales and Office Occupations

Sales and Office Occupations by Sex

| Occupation | Male | Female |
| Sales & Related | 0 (0.0%) | 0 (0.0%) |
| Office & Administration | 0 (0.0%) | 0 (0.0%) |
| Total (Category) | 0 (0.0%) | 0 (0.0%) |
| Total (Overall) | 0 (0.0%) | 14 (100.0%) |
Natural Resources, Construction and Maintenance Occupations
Natural Resources, Construction and Maintenance Occupations by Sex
| Occupation | Male | Female |
| Farming, Fishing & Forestry | 0 (0.0%) | 0 (0.0%) |
| Construction & Extraction | 0 (0.0%) | 0 (0.0%) |
| Installation, Maintenance & Repair | 0 (0.0%) | 0 (0.0%) |
| Total (Category) | 0 (0.0%) | 0 (0.0%) |
| Total (Overall) | 0 (0.0%) | 14 (100.0%) |
Production, Transportation and Moving Occupations
Production, Transportation and Moving Occupations by Sex
| Occupation | Male | Female |
| Production | 0 (0.0%) | 0 (0.0%) |
| Transportation | 0 (0.0%) | 0 (0.0%) |
| Material Moving | 0 (0.0%) | 0 (0.0%) |
| Total (Category) | 0 (0.0%) | 0 (0.0%) |
| Total (Overall) | 0 (0.0%) | 14 (100.0%) |
Employment Industries by Sex in Red Rock CDP Apache County
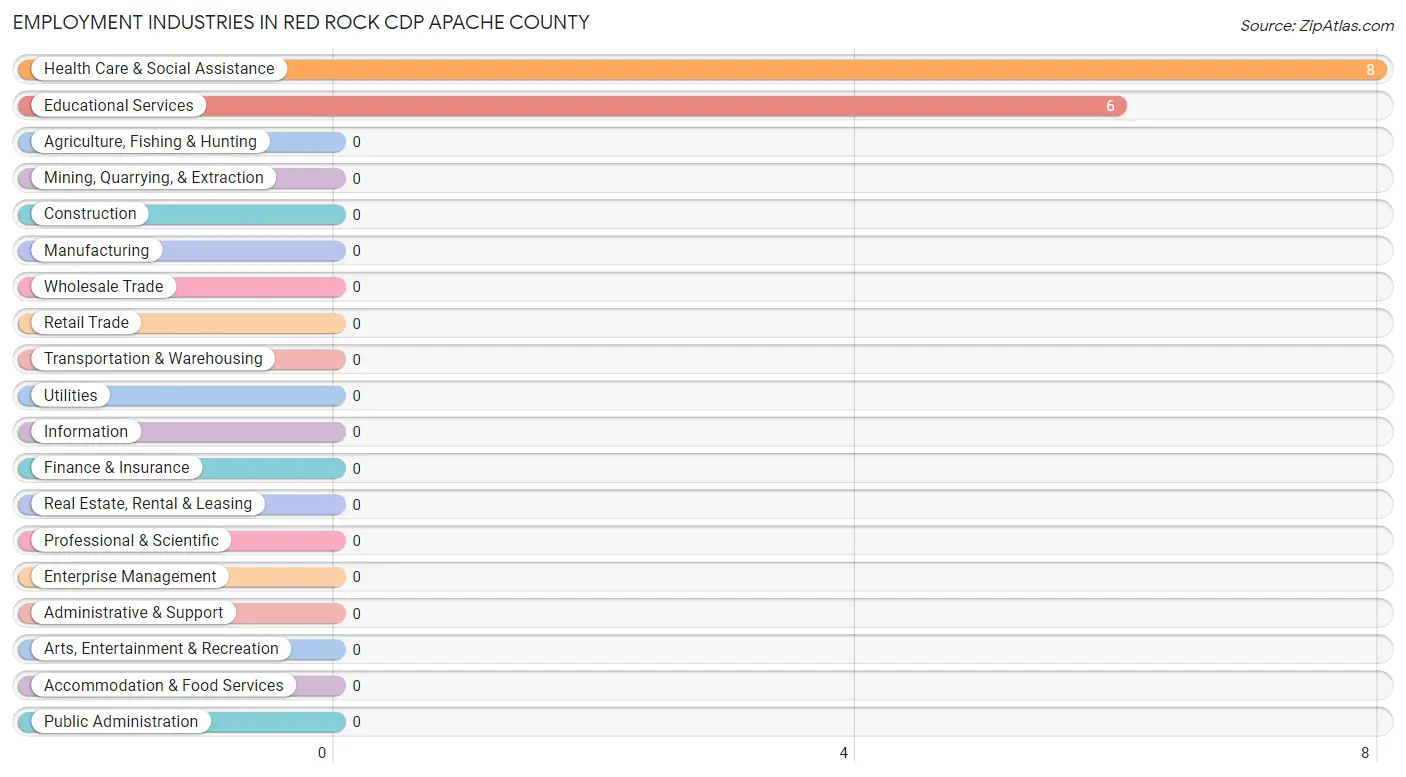
Employment Industries in Red Rock CDP Apache County
The major employment industries in Red Rock CDP Apache County include Health Care & Social Assistance (8 | 57.1%), and Educational Services (6 | 42.9%).
Employment Industries by Sex in Red Rock CDP Apache County
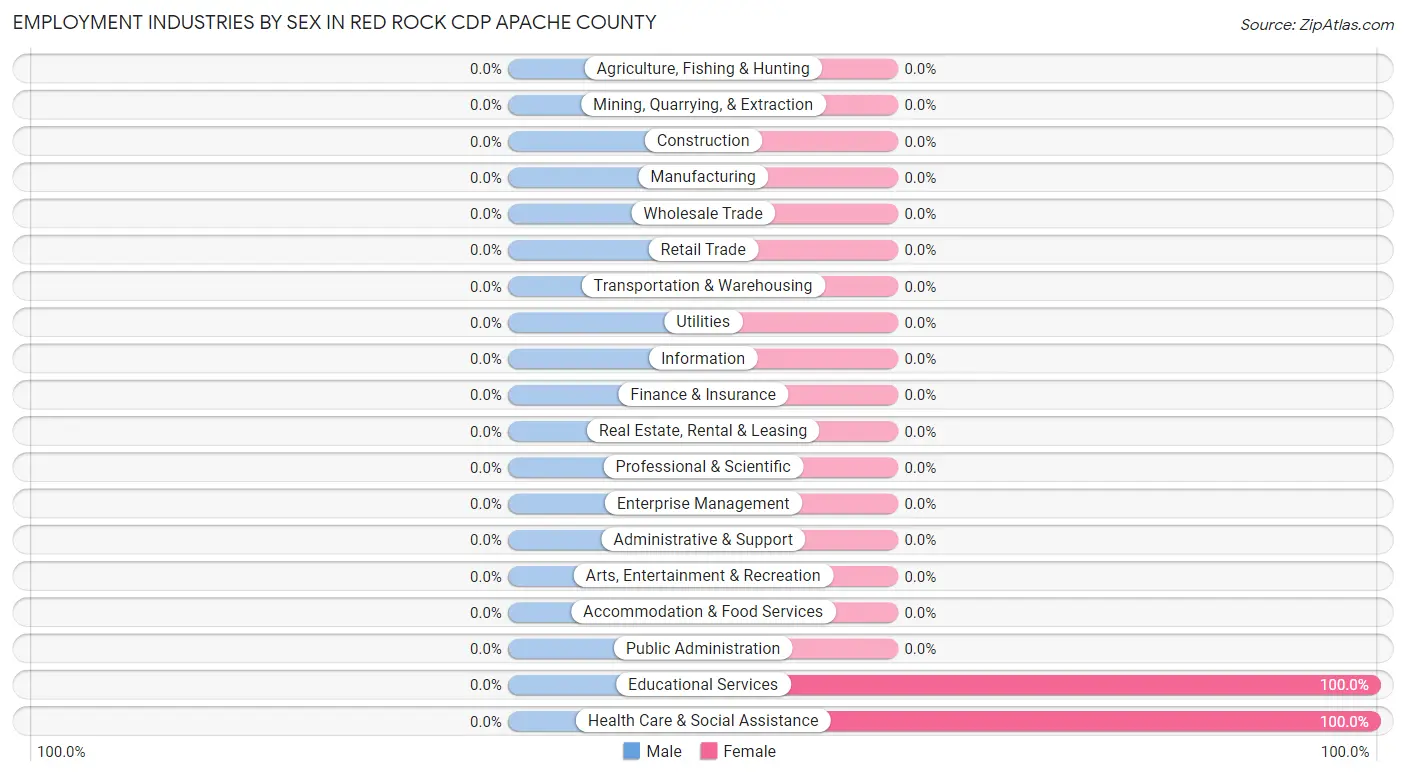
| Industry | Male | Female |
| Agriculture, Fishing & Hunting | 0 (0.0%) | 0 (0.0%) |
| Mining, Quarrying, & Extraction | 0 (0.0%) | 0 (0.0%) |
| Construction | 0 (0.0%) | 0 (0.0%) |
| Manufacturing | 0 (0.0%) | 0 (0.0%) |
| Wholesale Trade | 0 (0.0%) | 0 (0.0%) |
| Retail Trade | 0 (0.0%) | 0 (0.0%) |
| Transportation & Warehousing | 0 (0.0%) | 0 (0.0%) |
| Utilities | 0 (0.0%) | 0 (0.0%) |
| Information | 0 (0.0%) | 0 (0.0%) |
| Finance & Insurance | 0 (0.0%) | 0 (0.0%) |
| Real Estate, Rental & Leasing | 0 (0.0%) | 0 (0.0%) |
| Professional & Scientific | 0 (0.0%) | 0 (0.0%) |
| Enterprise Management | 0 (0.0%) | 0 (0.0%) |
| Administrative & Support | 0 (0.0%) | 0 (0.0%) |
| Educational Services | 0 (0.0%) | 6 (100.0%) |
| Health Care & Social Assistance | 0 (0.0%) | 8 (100.0%) |
| Arts, Entertainment & Recreation | 0 (0.0%) | 0 (0.0%) |
| Accommodation & Food Services | 0 (0.0%) | 0 (0.0%) |
| Public Administration | 0 (0.0%) | 0 (0.0%) |
| Total | 0 (0.0%) | 14 (100.0%) |
Education in Red Rock CDP Apache County
School Enrollment in Red Rock CDP Apache County
| School Level | # Students | % Students |
| Nursery / Preschool | 0 | 0.0% |
| Kindergarten | 0 | 0.0% |
| Elementary School | 0 | 0.0% |
| Middle School | 0 | 0.0% |
| High School | 0 | 0.0% |
| College / Undergraduate | 0 | 0.0% |
| Graduate / Professional | 0 | 0.0% |
| Total | 0 | 0.0% |
School Enrollment by Age by Funding Source in Red Rock CDP Apache County
| Age Bracket | Public School | Private School |
| 3 to 4 Year Olds | 0 (0.0%) | 0 (0.0%) |
| 5 to 9 Year Old | 0 (0.0%) | 0 (0.0%) |
| 10 to 14 Year Olds | 0 (0.0%) | 0 (0.0%) |
| 15 to 17 Year Olds | 0 (0.0%) | 0 (0.0%) |
| 18 to 19 Year Olds | 0 (0.0%) | 0 (0.0%) |
| 20 to 24 Year Olds | 0 (0.0%) | 0 (0.0%) |
| 25 to 34 Year Olds | 0 (0.0%) | 0 (0.0%) |
| 35 Years and over | 0 (0.0%) | 0 (0.0%) |
| Total | 0 (0.0%) | 0 (0.0%) |
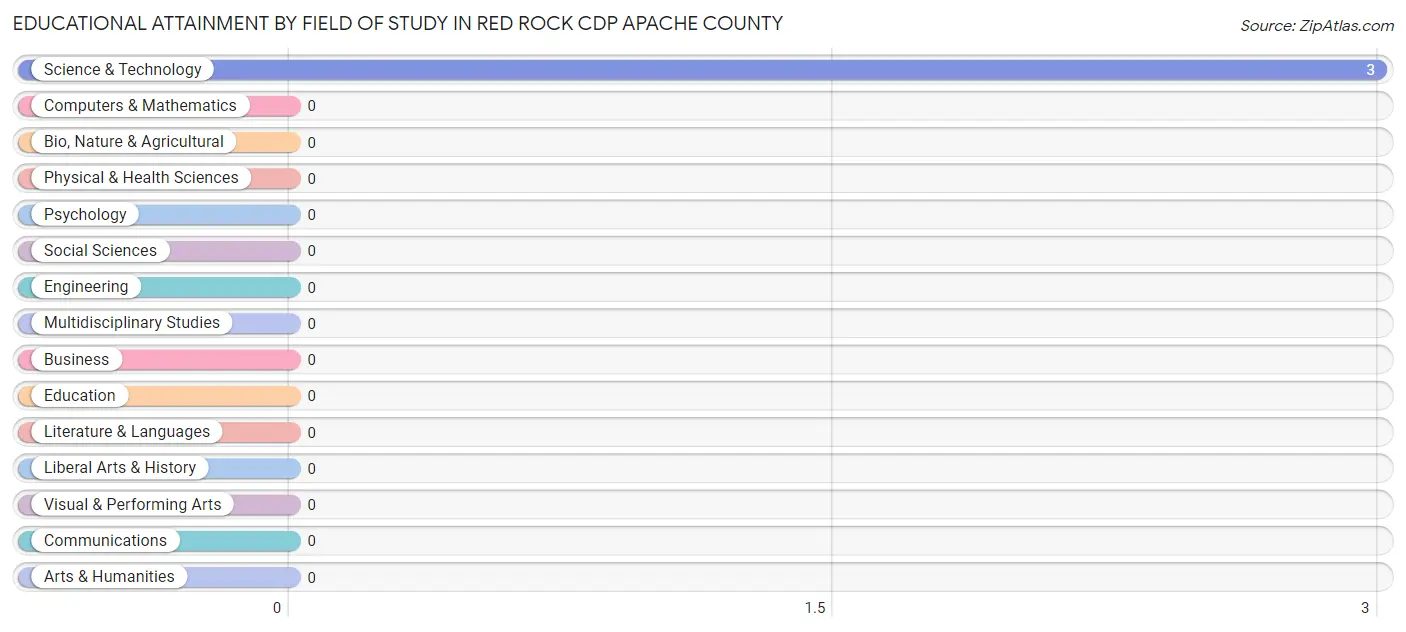
Educational Attainment by Field of Study in Red Rock CDP Apache County
, and science & technology (3 | 100.0%) are the most common fields of study among 3 individuals in Red Rock CDP Apache County who have obtained a bachelor's degree or higher.
| Field of Study | # Graduates | % Graduates |
| Computers & Mathematics | 0 | 0.0% |
| Bio, Nature & Agricultural | 0 | 0.0% |
| Physical & Health Sciences | 0 | 0.0% |
| Psychology | 0 | 0.0% |
| Social Sciences | 0 | 0.0% |
| Engineering | 0 | 0.0% |
| Multidisciplinary Studies | 0 | 0.0% |
| Science & Technology | 3 | 100.0% |
| Business | 0 | 0.0% |
| Education | 0 | 0.0% |
| Literature & Languages | 0 | 0.0% |
| Liberal Arts & History | 0 | 0.0% |
| Visual & Performing Arts | 0 | 0.0% |
| Communications | 0 | 0.0% |
| Arts & Humanities | 0 | 0.0% |
| Total | 3 | 100.0% |
Transportation & Commute in Red Rock CDP Apache County
Vehicle Availability by Sex in Red Rock CDP Apache County
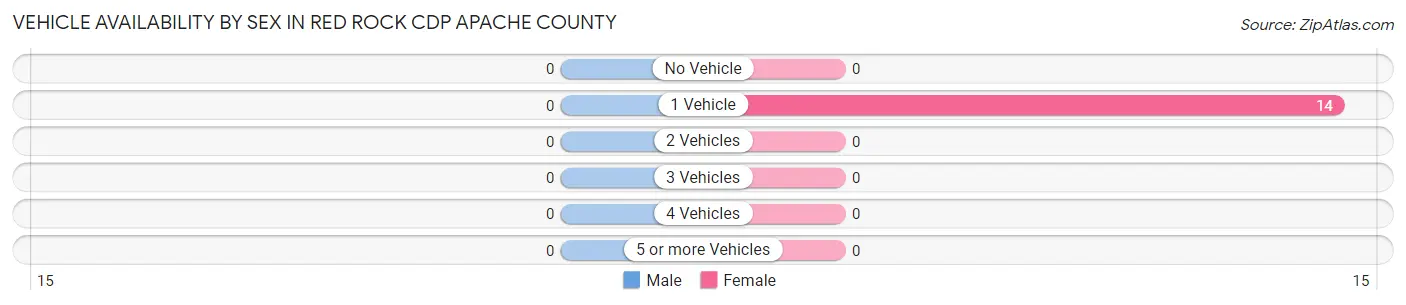
| Vehicles Available | Male | Female |
| No Vehicle | 0 (0.0%) | 0 (0.0%) |
| 1 Vehicle | 0 (0.0%) | 14 (100.0%) |
| 2 Vehicles | 0 (0.0%) | 0 (0.0%) |
| 3 Vehicles | 0 (0.0%) | 0 (0.0%) |
| 4 Vehicles | 0 (0.0%) | 0 (0.0%) |
| 5 or more Vehicles | 0 (0.0%) | 0 (0.0%) |
| Total | 0 (0.0%) | 14 (100.0%) |
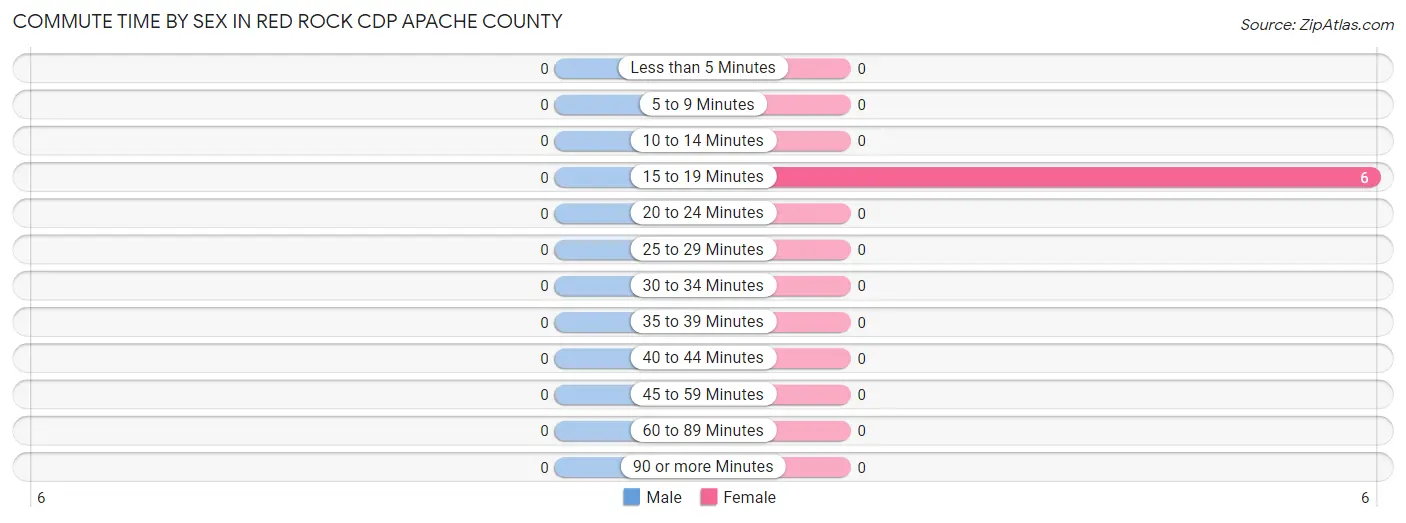
Commute Time in Red Rock CDP Apache County
The most frequently occuring commute durations in Red Rock CDP Apache County are 15 to 19 minutes (6 commuters, 100.0%), less than 5 minutes (0 commuters, 0.0%), and 5 to 9 minutes (0 commuters, 0.0%).
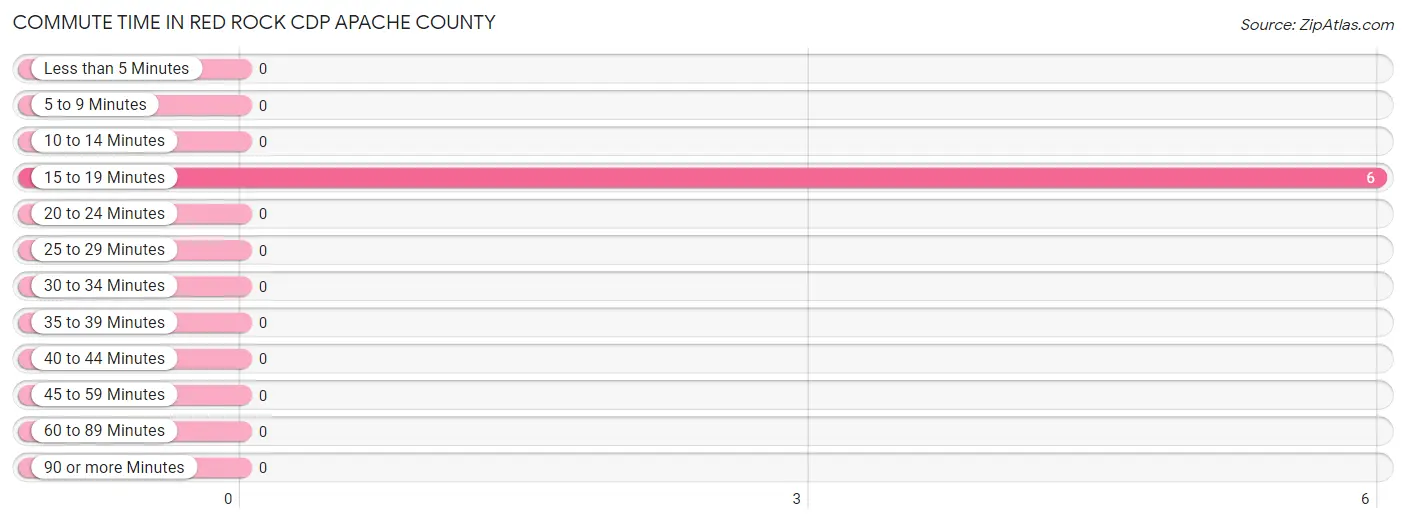
| Commute Time | # Commuters | % Commuters |
| Less than 5 Minutes | 0 | 0.0% |
| 5 to 9 Minutes | 0 | 0.0% |
| 10 to 14 Minutes | 0 | 0.0% |
| 15 to 19 Minutes | 6 | 100.0% |
| 20 to 24 Minutes | 0 | 0.0% |
| 25 to 29 Minutes | 0 | 0.0% |
| 30 to 34 Minutes | 0 | 0.0% |
| 35 to 39 Minutes | 0 | 0.0% |
| 40 to 44 Minutes | 0 | 0.0% |
| 45 to 59 Minutes | 0 | 0.0% |
| 60 to 89 Minutes | 0 | 0.0% |
| 90 or more Minutes | 0 | 0.0% |
Commute Time by Sex in Red Rock CDP Apache County
| Commute Time | Male | Female |
| Less than 5 Minutes | 0 (0.0%) | 0 (0.0%) |
| 5 to 9 Minutes | 0 (0.0%) | 0 (0.0%) |
| 10 to 14 Minutes | 0 (0.0%) | 0 (0.0%) |
| 15 to 19 Minutes | 0 (0.0%) | 6 (100.0%) |
| 20 to 24 Minutes | 0 (0.0%) | 0 (0.0%) |
| 25 to 29 Minutes | 0 (0.0%) | 0 (0.0%) |
| 30 to 34 Minutes | 0 (0.0%) | 0 (0.0%) |
| 35 to 39 Minutes | 0 (0.0%) | 0 (0.0%) |
| 40 to 44 Minutes | 0 (0.0%) | 0 (0.0%) |
| 45 to 59 Minutes | 0 (0.0%) | 0 (0.0%) |
| 60 to 89 Minutes | 0 (0.0%) | 0 (0.0%) |
| 90 or more Minutes | 0 (0.0%) | 0 (0.0%) |
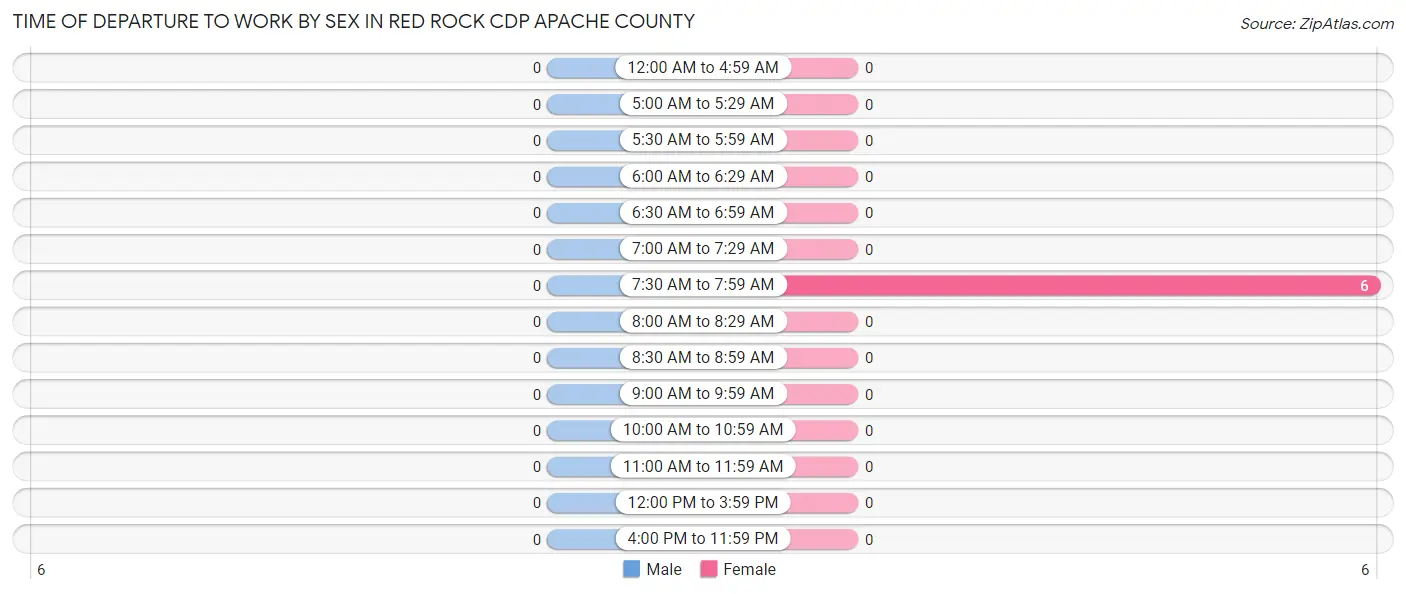
Time of Departure to Work by Sex in Red Rock CDP Apache County
| Time of Departure | Male | Female |
| 12:00 AM to 4:59 AM | 0 (0.0%) | 0 (0.0%) |
| 5:00 AM to 5:29 AM | 0 (0.0%) | 0 (0.0%) |
| 5:30 AM to 5:59 AM | 0 (0.0%) | 0 (0.0%) |
| 6:00 AM to 6:29 AM | 0 (0.0%) | 0 (0.0%) |
| 6:30 AM to 6:59 AM | 0 (0.0%) | 0 (0.0%) |
| 7:00 AM to 7:29 AM | 0 (0.0%) | 0 (0.0%) |
| 7:30 AM to 7:59 AM | 0 (0.0%) | 6 (100.0%) |
| 8:00 AM to 8:29 AM | 0 (0.0%) | 0 (0.0%) |
| 8:30 AM to 8:59 AM | 0 (0.0%) | 0 (0.0%) |
| 9:00 AM to 9:59 AM | 0 (0.0%) | 0 (0.0%) |
| 10:00 AM to 10:59 AM | 0 (0.0%) | 0 (0.0%) |
| 11:00 AM to 11:59 AM | 0 (0.0%) | 0 (0.0%) |
| 12:00 PM to 3:59 PM | 0 (0.0%) | 0 (0.0%) |
| 4:00 PM to 11:59 PM | 0 (0.0%) | 0 (0.0%) |
| Total | 0 (0.0%) | 6 (100.0%) |
Housing Occupancy in Red Rock CDP Apache County
Occupancy by Ownership in Red Rock CDP Apache County
Of the total 30 dwellings in Red Rock CDP Apache County, owner-occupied units account for 24 (80.0%), while renter-occupied units make up 6 (20.0%).
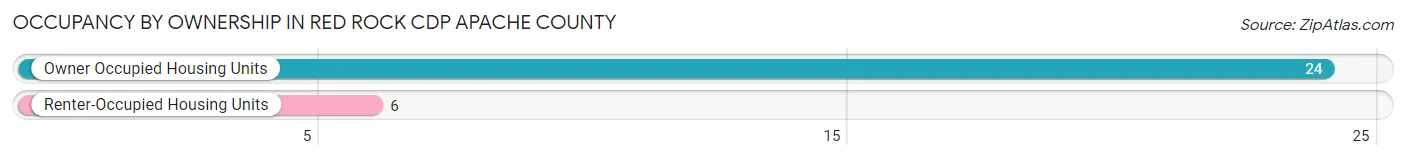
| Occupancy | # Housing Units | % Housing Units |
| Owner Occupied Housing Units | 24 | 80.0% |
| Renter-Occupied Housing Units | 6 | 20.0% |
| Total Occupied Housing Units | 30 | 100.0% |
Occupancy by Household Size in Red Rock CDP Apache County
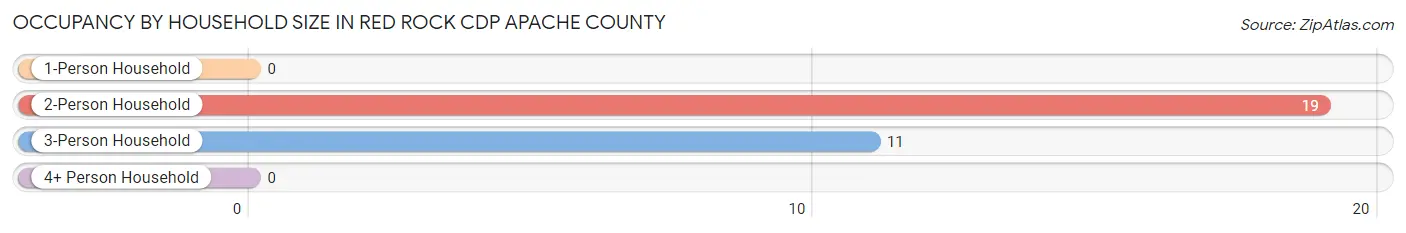
| Household Size | # Housing Units | % Housing Units |
| 1-Person Household | 0 | 0.0% |
| 2-Person Household | 19 | 63.3% |
| 3-Person Household | 11 | 36.7% |
| 4+ Person Household | 0 | 0.0% |
| Total Housing Units | 30 | 100.0% |
Occupancy by Ownership by Household Size in Red Rock CDP Apache County
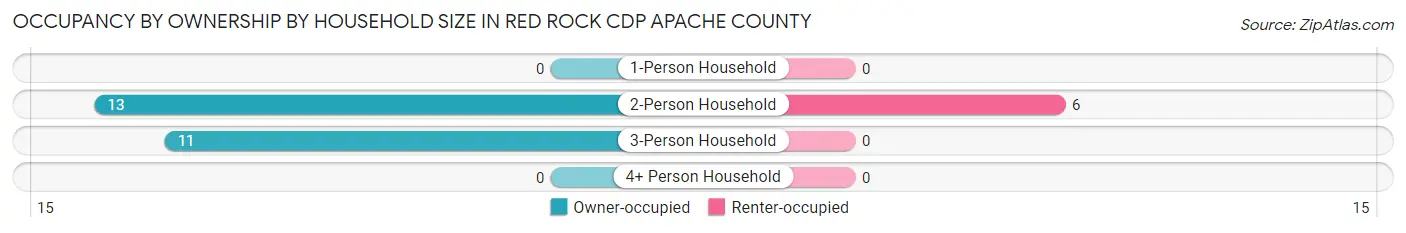
| Household Size | Owner-occupied | Renter-occupied |
| 1-Person Household | 0 (0.0%) | 0 (0.0%) |
| 2-Person Household | 13 (68.4%) | 6 (31.6%) |
| 3-Person Household | 11 (100.0%) | 0 (0.0%) |
| 4+ Person Household | 0 (0.0%) | 0 (0.0%) |
| Total Housing Units | 24 (80.0%) | 6 (20.0%) |
Occupancy by Educational Attainment in Red Rock CDP Apache County
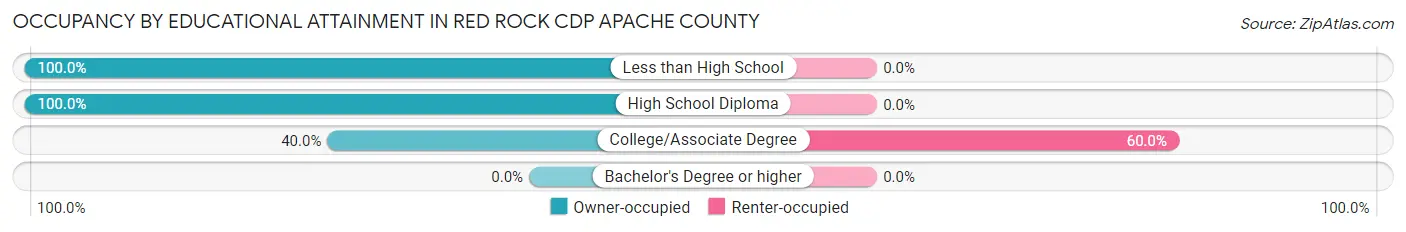
| Household Size | Owner-occupied | Renter-occupied |
| Less than High School | 14 (100.0%) | 0 (0.0%) |
| High School Diploma | 6 (100.0%) | 0 (0.0%) |
| College/Associate Degree | 4 (40.0%) | 6 (60.0%) |
| Bachelor's Degree or higher | 0 (0.0%) | 0 (0.0%) |
Occupancy by Age of Householder in Red Rock CDP Apache County
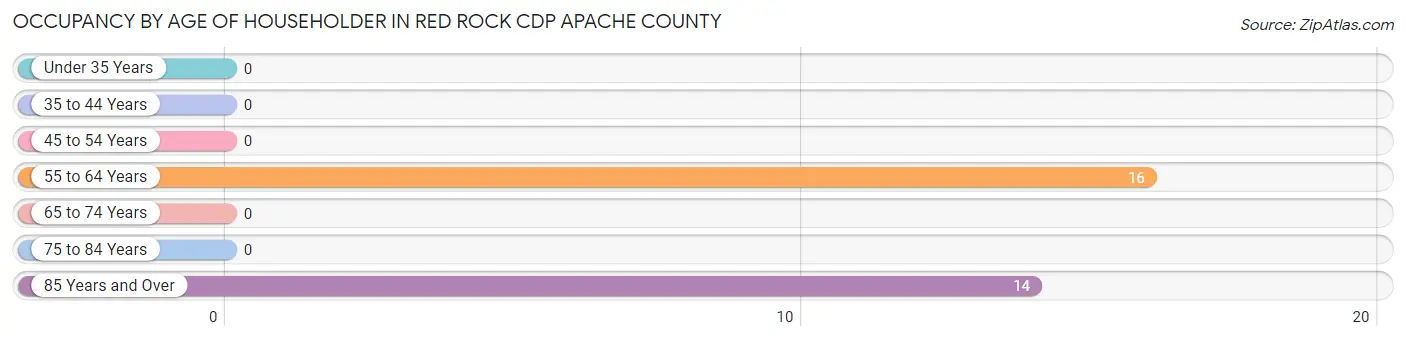
| Age Bracket | # Households | % Households |
| Under 35 Years | 0 | 0.0% |
| 35 to 44 Years | 0 | 0.0% |
| 45 to 54 Years | 0 | 0.0% |
| 55 to 64 Years | 16 | 53.3% |
| 65 to 74 Years | 0 | 0.0% |
| 75 to 84 Years | 0 | 0.0% |
| 85 Years and Over | 14 | 46.7% |
| Total | 30 | 100.0% |
Housing Finances in Red Rock CDP Apache County
Median Income by Occupancy in Red Rock CDP Apache County
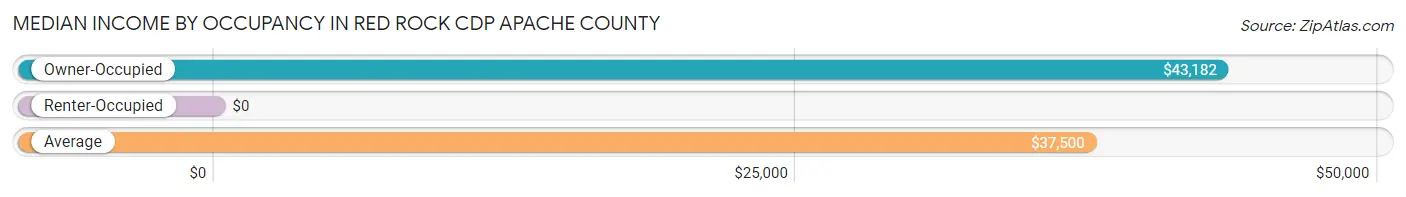
| Occupancy Type | # Households | Median Income |
| Owner-Occupied | 24 (80.0%) | $43,182 |
| Renter-Occupied | 6 (20.0%) | $0 |
| Average | 30 (100.0%) | $37,500 |
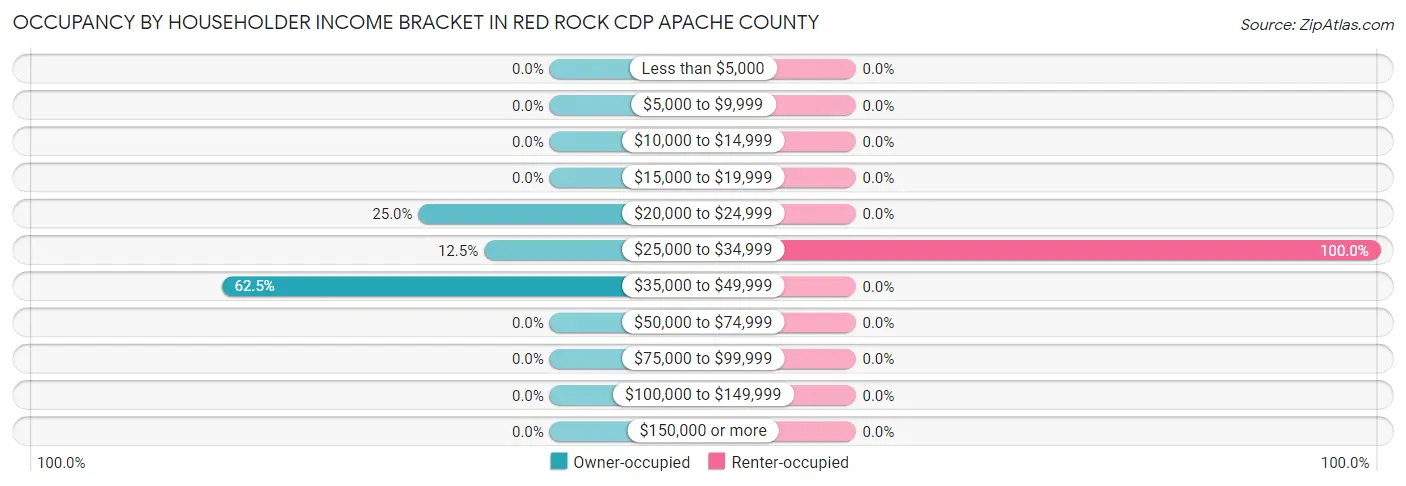
Occupancy by Householder Income Bracket in Red Rock CDP Apache County
| Income Bracket | Owner-occupied | Renter-occupied |
| Less than $5,000 | 0 (0.0%) | 0 (0.0%) |
| $5,000 to $9,999 | 0 (0.0%) | 0 (0.0%) |
| $10,000 to $14,999 | 0 (0.0%) | 0 (0.0%) |
| $15,000 to $19,999 | 0 (0.0%) | 0 (0.0%) |
| $20,000 to $24,999 | 6 (25.0%) | 0 (0.0%) |
| $25,000 to $34,999 | 3 (12.5%) | 6 (100.0%) |
| $35,000 to $49,999 | 15 (62.5%) | 0 (0.0%) |
| $50,000 to $74,999 | 0 (0.0%) | 0 (0.0%) |
| $75,000 to $99,999 | 0 (0.0%) | 0 (0.0%) |
| $100,000 to $149,999 | 0 (0.0%) | 0 (0.0%) |
| $150,000 or more | 0 (0.0%) | 0 (0.0%) |
| Total | 24 (100.0%) | 6 (100.0%) |
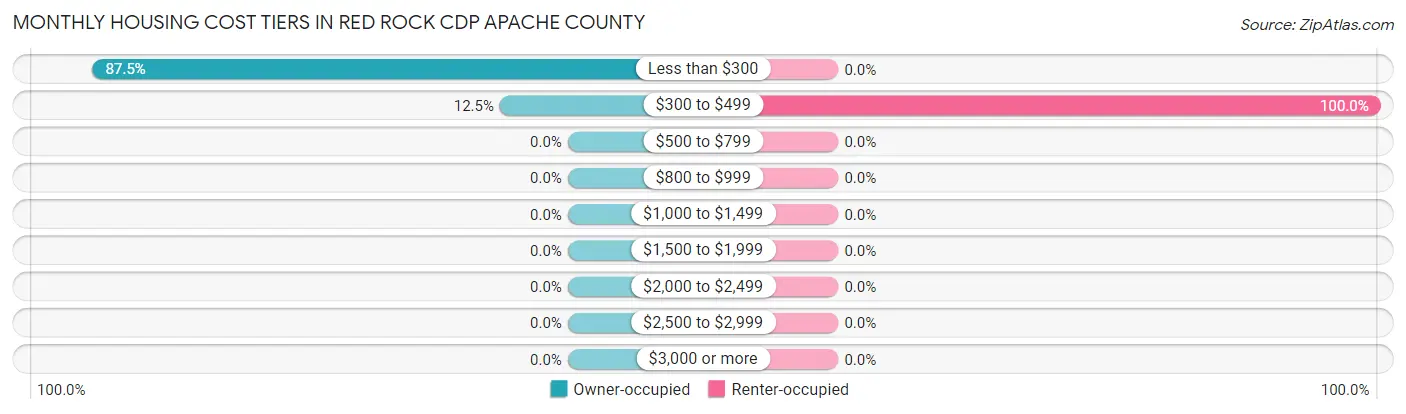
Monthly Housing Cost Tiers in Red Rock CDP Apache County
| Monthly Cost | Owner-occupied | Renter-occupied |
| Less than $300 | 21 (87.5%) | 0 (0.0%) |
| $300 to $499 | 3 (12.5%) | 6 (100.0%) |
| $500 to $799 | 0 (0.0%) | 0 (0.0%) |
| $800 to $999 | 0 (0.0%) | 0 (0.0%) |
| $1,000 to $1,499 | 0 (0.0%) | 0 (0.0%) |
| $1,500 to $1,999 | 0 (0.0%) | 0 (0.0%) |
| $2,000 to $2,499 | 0 (0.0%) | 0 (0.0%) |
| $2,500 to $2,999 | 0 (0.0%) | 0 (0.0%) |
| $3,000 or more | 0 (0.0%) | 0 (0.0%) |
| Total | 24 (100.0%) | 6 (100.0%) |
Physical Housing Characteristics in Red Rock CDP Apache County
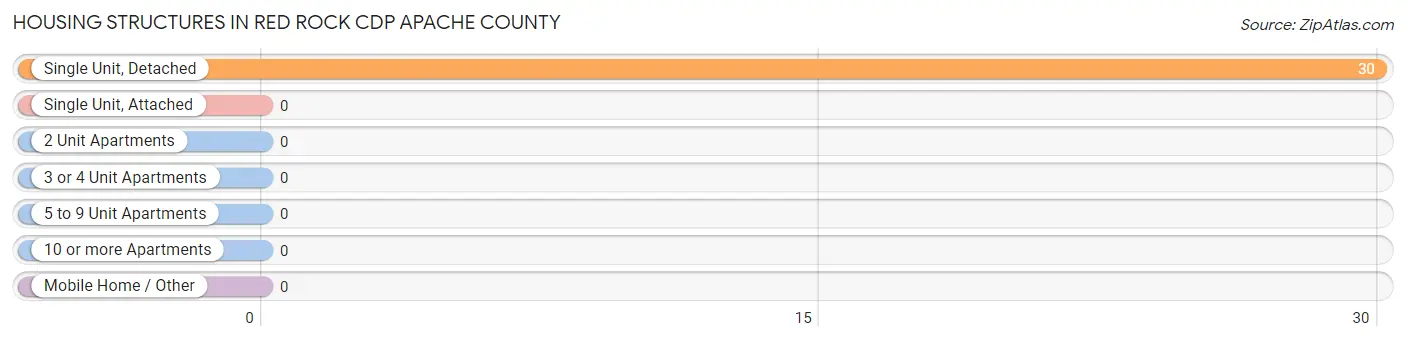
Housing Structures in Red Rock CDP Apache County
| Structure Type | # Housing Units | % Housing Units |
| Single Unit, Detached | 30 | 100.0% |
| Single Unit, Attached | 0 | 0.0% |
| 2 Unit Apartments | 0 | 0.0% |
| 3 or 4 Unit Apartments | 0 | 0.0% |
| 5 to 9 Unit Apartments | 0 | 0.0% |
| 10 or more Apartments | 0 | 0.0% |
| Mobile Home / Other | 0 | 0.0% |
| Total | 30 | 100.0% |
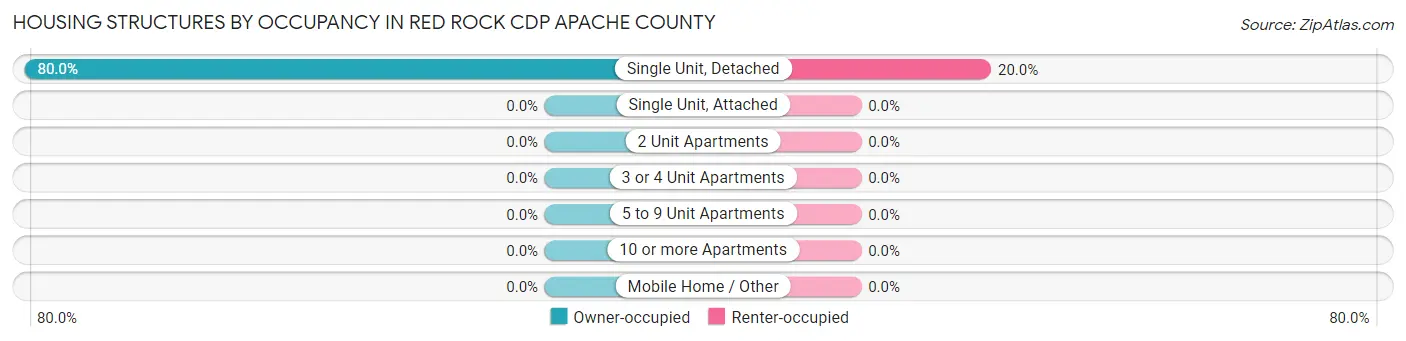
Housing Structures by Occupancy in Red Rock CDP Apache County
| Structure Type | Owner-occupied | Renter-occupied |
| Single Unit, Detached | 24 (80.0%) | 6 (20.0%) |
| Single Unit, Attached | 0 (0.0%) | 0 (0.0%) |
| 2 Unit Apartments | 0 (0.0%) | 0 (0.0%) |
| 3 or 4 Unit Apartments | 0 (0.0%) | 0 (0.0%) |
| 5 to 9 Unit Apartments | 0 (0.0%) | 0 (0.0%) |
| 10 or more Apartments | 0 (0.0%) | 0 (0.0%) |
| Mobile Home / Other | 0 (0.0%) | 0 (0.0%) |
| Total | 24 (80.0%) | 6 (20.0%) |
Housing Structures by Number of Rooms in Red Rock CDP Apache County
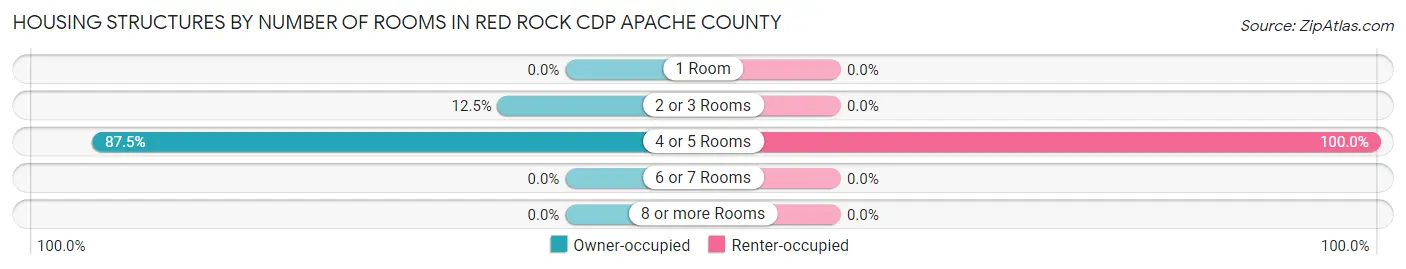
| Number of Rooms | Owner-occupied | Renter-occupied |
| 1 Room | 0 (0.0%) | 0 (0.0%) |
| 2 or 3 Rooms | 3 (12.5%) | 0 (0.0%) |
| 4 or 5 Rooms | 21 (87.5%) | 6 (100.0%) |
| 6 or 7 Rooms | 0 (0.0%) | 0 (0.0%) |
| 8 or more Rooms | 0 (0.0%) | 0 (0.0%) |
| Total | 24 (100.0%) | 6 (100.0%) |
Housing Structure by Heating Type in Red Rock CDP Apache County
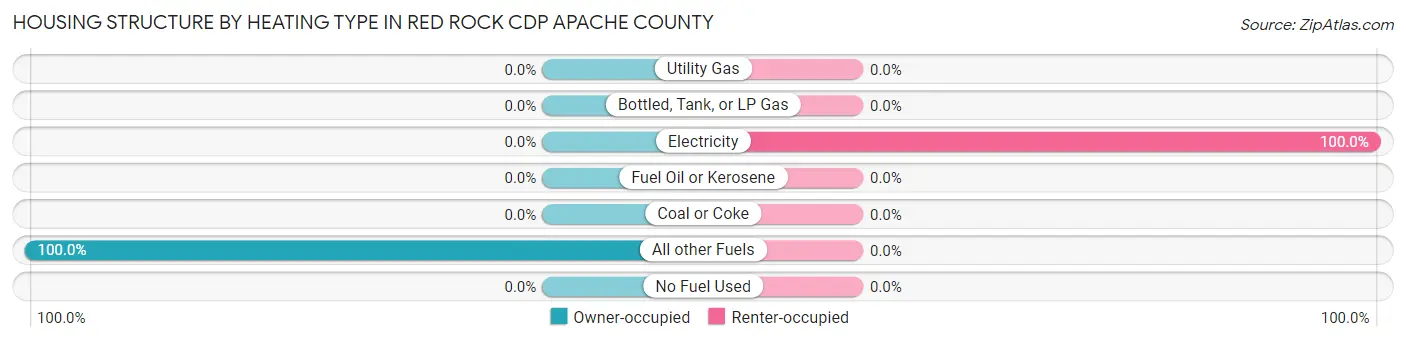
| Heating Type | Owner-occupied | Renter-occupied |
| Utility Gas | 0 (0.0%) | 0 (0.0%) |
| Bottled, Tank, or LP Gas | 0 (0.0%) | 0 (0.0%) |
| Electricity | 0 (0.0%) | 6 (100.0%) |
| Fuel Oil or Kerosene | 0 (0.0%) | 0 (0.0%) |
| Coal or Coke | 0 (0.0%) | 0 (0.0%) |
| All other Fuels | 24 (100.0%) | 0 (0.0%) |
| No Fuel Used | 0 (0.0%) | 0 (0.0%) |
| Total | 24 (100.0%) | 6 (100.0%) |
Household Vehicle Usage in Red Rock CDP Apache County
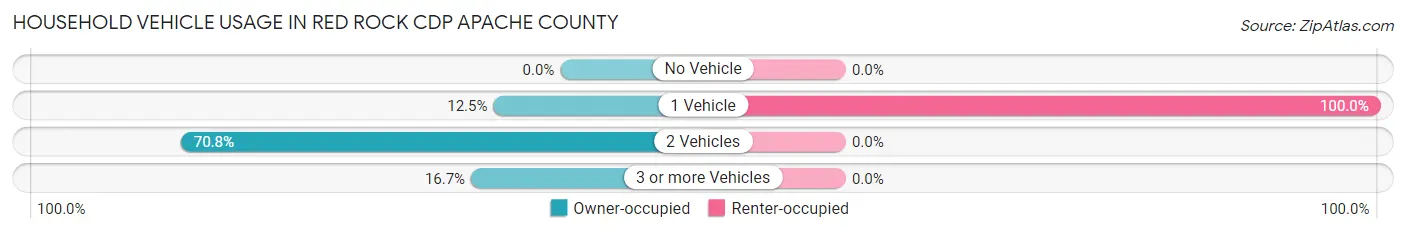
| Vehicles per Household | Owner-occupied | Renter-occupied |
| No Vehicle | 0 (0.0%) | 0 (0.0%) |
| 1 Vehicle | 3 (12.5%) | 6 (100.0%) |
| 2 Vehicles | 17 (70.8%) | 0 (0.0%) |
| 3 or more Vehicles | 4 (16.7%) | 0 (0.0%) |
| Total | 24 (100.0%) | 6 (100.0%) |
Real Estate & Mortgages in Red Rock CDP Apache County
Real Estate and Mortgage Overview in Red Rock CDP Apache County
| Characteristic | Without Mortgage | With Mortgage |
| Housing Units | 24 | 0 |
| Median Property Value | $62,700 | $0 |
| Median Household Income | $43,182 | $0 |
| Monthly Housing Costs | $177 | $0 |
| Real Estate Taxes | - | - |
Property Value by Mortgage Status in Red Rock CDP Apache County
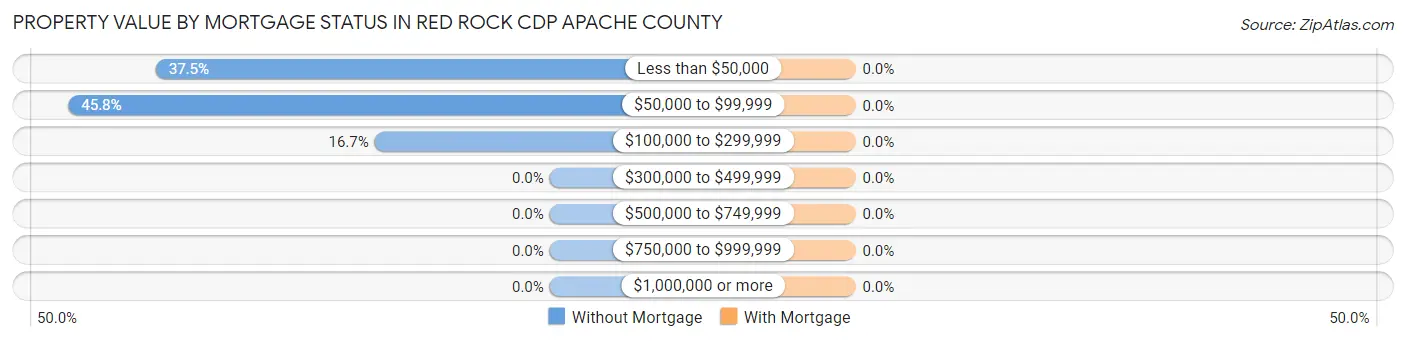
| Property Value | Without Mortgage | With Mortgage |
| Less than $50,000 | 9 (37.5%) | 0 (0.0%) |
| $50,000 to $99,999 | 11 (45.8%) | 0 (0.0%) |
| $100,000 to $299,999 | 4 (16.7%) | 0 (0.0%) |
| $300,000 to $499,999 | 0 (0.0%) | 0 (0.0%) |
| $500,000 to $749,999 | 0 (0.0%) | 0 (0.0%) |
| $750,000 to $999,999 | 0 (0.0%) | 0 (0.0%) |
| $1,000,000 or more | 0 (0.0%) | 0 (0.0%) |
| Total | 24 (100.0%) | 0 (0.0%) |
Household Income by Mortgage Status in Red Rock CDP Apache County
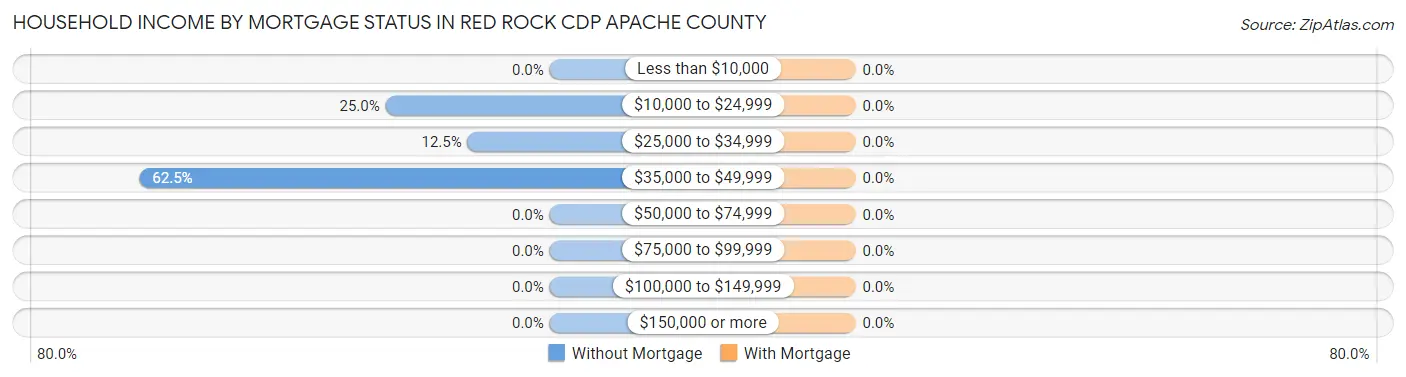
| Household Income | Without Mortgage | With Mortgage |
| Less than $10,000 | 0 (0.0%) | 0 (0.0%) |
| $10,000 to $24,999 | 6 (25.0%) | 0 (0.0%) |
| $25,000 to $34,999 | 3 (12.5%) | 0 (0.0%) |
| $35,000 to $49,999 | 15 (62.5%) | 0 (0.0%) |
| $50,000 to $74,999 | 0 (0.0%) | 0 (0.0%) |
| $75,000 to $99,999 | 0 (0.0%) | 0 (0.0%) |
| $100,000 to $149,999 | 0 (0.0%) | 0 (0.0%) |
| $150,000 or more | 0 (0.0%) | 0 (0.0%) |
| Total | 24 (100.0%) | 0 (0.0%) |
Property Value to Household Income Ratio in Red Rock CDP Apache County
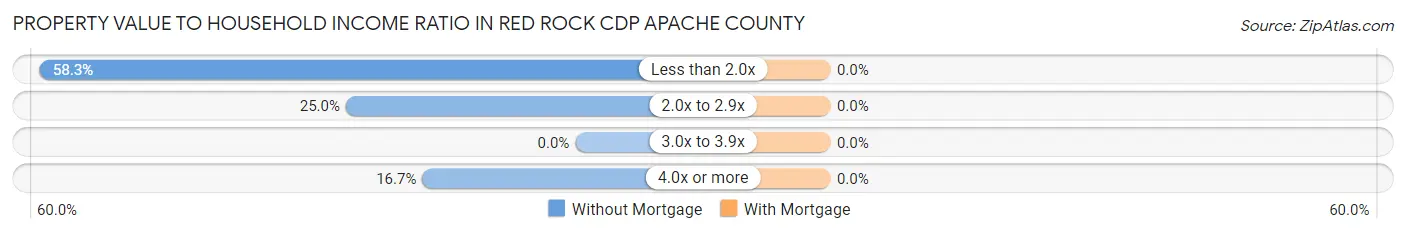
| Value-to-Income Ratio | Without Mortgage | With Mortgage |
| Less than 2.0x | 14 (58.3%) | 0 (0.0%) |
| 2.0x to 2.9x | 6 (25.0%) | 0 (0.0%) |
| 3.0x to 3.9x | 0 (0.0%) | 0 (0.0%) |
| 4.0x or more | 4 (16.7%) | 0 (0.0%) |
| Total | 24 (100.0%) | 0 (0.0%) |
Real Estate Taxes by Mortgage Status in Red Rock CDP Apache County
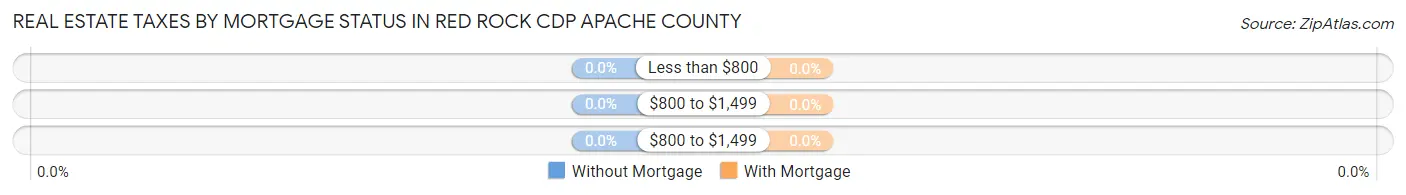
| Property Taxes | Without Mortgage | With Mortgage |
| Less than $800 | 0 (0.0%) | 0 (0.0%) |
| $800 to $1,499 | 0 (0.0%) | 0 (0.0%) |
| $800 to $1,499 | 0 (0.0%) | 0 (0.0%) |
| Total | 24 (100.0%) | 0 (0.0%) |
Health & Disability in Red Rock CDP Apache County
Health Insurance Coverage by Age in Red Rock CDP Apache County
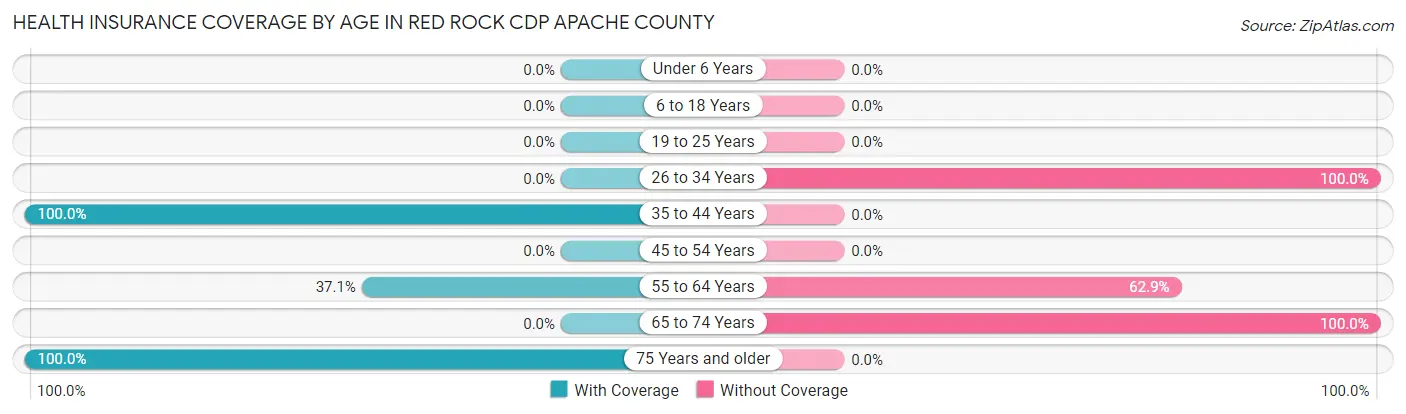
| Age Bracket | With Coverage | Without Coverage |
| Under 6 Years | 0 (0.0%) | 0 (0.0%) |
| 6 to 18 Years | 0 (0.0%) | 0 (0.0%) |
| 19 to 25 Years | 0 (0.0%) | 0 (0.0%) |
| 26 to 34 Years | 0 (0.0%) | 12 (100.0%) |
| 35 to 44 Years | 8 (100.0%) | 0 (0.0%) |
| 45 to 54 Years | 0 (0.0%) | 0 (0.0%) |
| 55 to 64 Years | 13 (37.1%) | 22 (62.9%) |
| 65 to 74 Years | 0 (0.0%) | 6 (100.0%) |
| 75 Years and older | 14 (100.0%) | 0 (0.0%) |
| Total | 35 (46.7%) | 40 (53.3%) |
Health Insurance Coverage by Citizenship Status in Red Rock CDP Apache County
| Citizenship Status | With Coverage | Without Coverage |
| Native Born | 0 (0.0%) | 0 (0.0%) |
| Foreign Born, Citizen | 0 (0.0%) | 0 (0.0%) |
| Foreign Born, not a Citizen | 0 (0.0%) | 0 (0.0%) |
Health Insurance Coverage by Household Income in Red Rock CDP Apache County
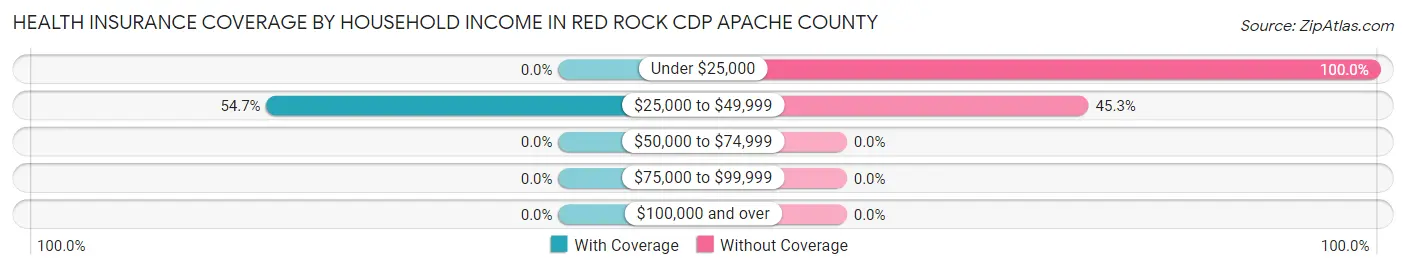
| Household Income | With Coverage | Without Coverage |
| Under $25,000 | 0 (0.0%) | 11 (100.0%) |
| $25,000 to $49,999 | 35 (54.7%) | 29 (45.3%) |
| $50,000 to $74,999 | 0 (0.0%) | 0 (0.0%) |
| $75,000 to $99,999 | 0 (0.0%) | 0 (0.0%) |
| $100,000 and over | 0 (0.0%) | 0 (0.0%) |
Public vs Private Health Insurance Coverage by Age in Red Rock CDP Apache County
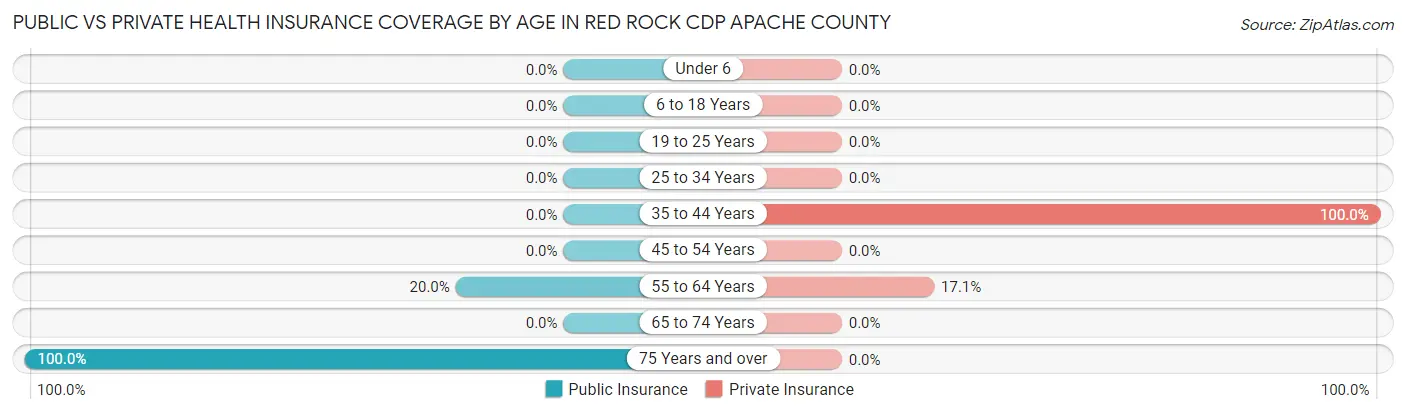
| Age Bracket | Public Insurance | Private Insurance |
| Under 6 | 0 (0.0%) | 0 (0.0%) |
| 6 to 18 Years | 0 (0.0%) | 0 (0.0%) |
| 19 to 25 Years | 0 (0.0%) | 0 (0.0%) |
| 25 to 34 Years | 0 (0.0%) | 0 (0.0%) |
| 35 to 44 Years | 0 (0.0%) | 8 (100.0%) |
| 45 to 54 Years | 0 (0.0%) | 0 (0.0%) |
| 55 to 64 Years | 7 (20.0%) | 6 (17.1%) |
| 65 to 74 Years | 0 (0.0%) | 0 (0.0%) |
| 75 Years and over | 14 (100.0%) | 0 (0.0%) |
| Total | 21 (28.0%) | 14 (18.7%) |
Disability Status by Sex by Age in Red Rock CDP Apache County
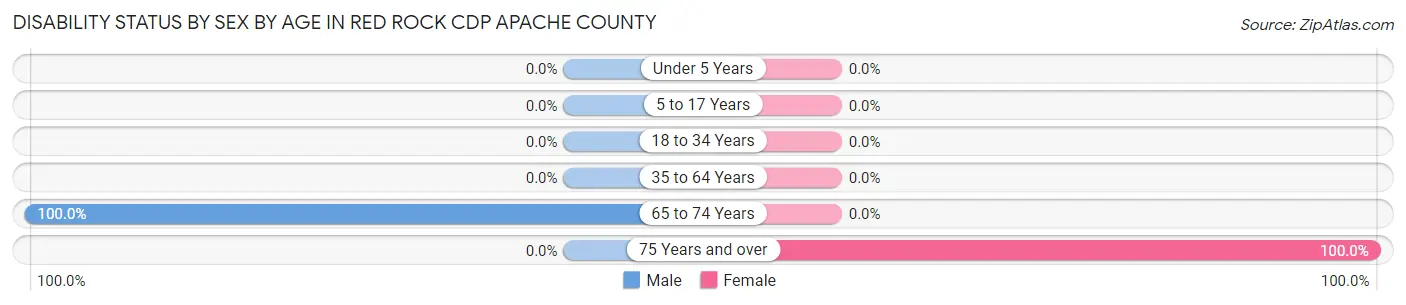
| Age Bracket | Male | Female |
| Under 5 Years | 0 (0.0%) | 0 (0.0%) |
| 5 to 17 Years | 0 (0.0%) | 0 (0.0%) |
| 18 to 34 Years | 0 (0.0%) | 0 (0.0%) |
| 35 to 64 Years | 0 (0.0%) | 0 (0.0%) |
| 65 to 74 Years | 6 (100.0%) | 0 (0.0%) |
| 75 Years and over | 0 (0.0%) | 11 (100.0%) |
Disability Class by Sex by Age in Red Rock CDP Apache County
Disability Class: Hearing Difficulty
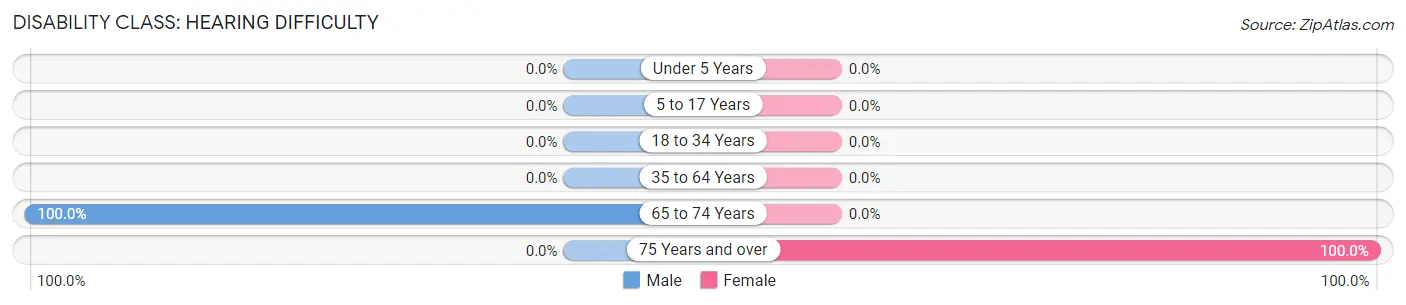
| Age Bracket | Male | Female |
| Under 5 Years | 0 (0.0%) | 0 (0.0%) |
| 5 to 17 Years | 0 (0.0%) | 0 (0.0%) |
| 18 to 34 Years | 0 (0.0%) | 0 (0.0%) |
| 35 to 64 Years | 0 (0.0%) | 0 (0.0%) |
| 65 to 74 Years | 6 (100.0%) | 0 (0.0%) |
| 75 Years and over | 0 (0.0%) | 11 (100.0%) |
Disability Class: Vision Difficulty
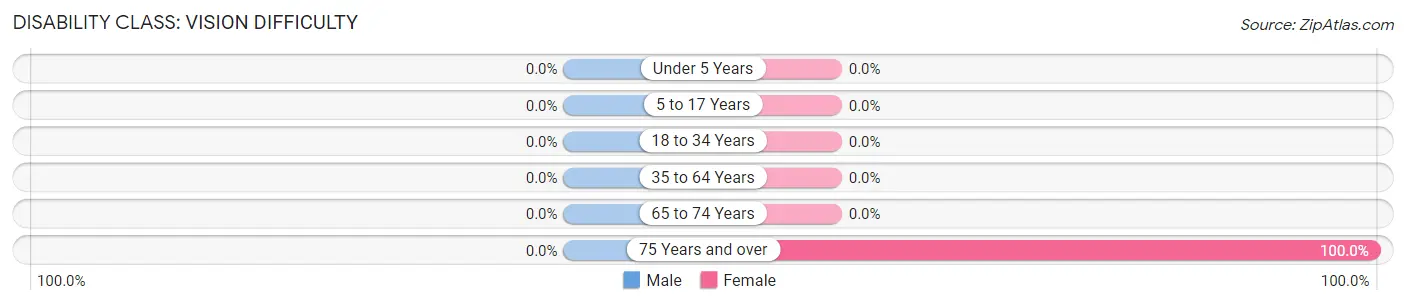
| Age Bracket | Male | Female |
| Under 5 Years | 0 (0.0%) | 0 (0.0%) |
| 5 to 17 Years | 0 (0.0%) | 0 (0.0%) |
| 18 to 34 Years | 0 (0.0%) | 0 (0.0%) |
| 35 to 64 Years | 0 (0.0%) | 0 (0.0%) |
| 65 to 74 Years | 0 (0.0%) | 0 (0.0%) |
| 75 Years and over | 0 (0.0%) | 11 (100.0%) |
Disability Class: Cognitive Difficulty
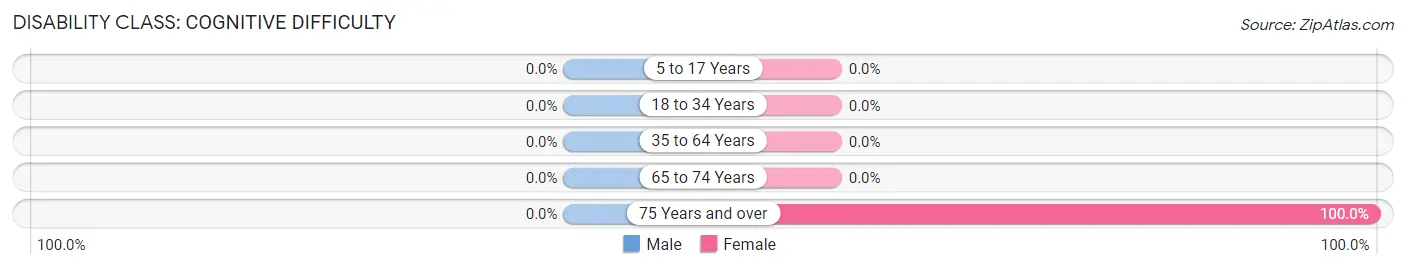
| Age Bracket | Male | Female |
| 5 to 17 Years | 0 (0.0%) | 0 (0.0%) |
| 18 to 34 Years | 0 (0.0%) | 0 (0.0%) |
| 35 to 64 Years | 0 (0.0%) | 0 (0.0%) |
| 65 to 74 Years | 0 (0.0%) | 0 (0.0%) |
| 75 Years and over | 0 (0.0%) | 11 (100.0%) |
Disability Class: Ambulatory Difficulty
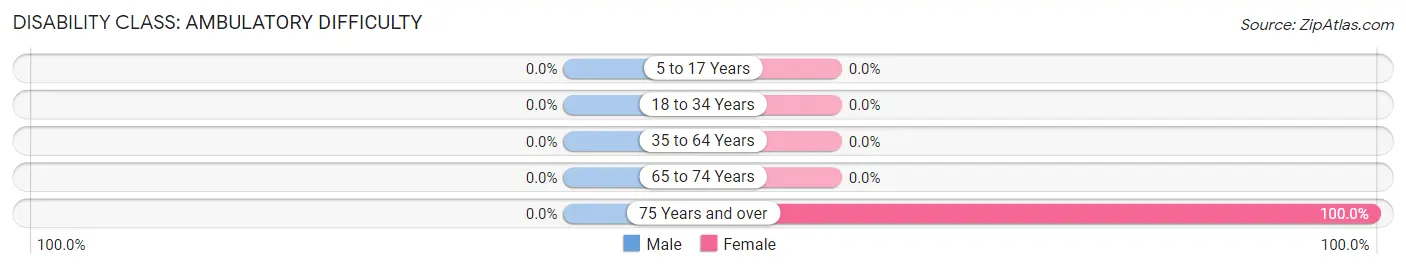
| Age Bracket | Male | Female |
| 5 to 17 Years | 0 (0.0%) | 0 (0.0%) |
| 18 to 34 Years | 0 (0.0%) | 0 (0.0%) |
| 35 to 64 Years | 0 (0.0%) | 0 (0.0%) |
| 65 to 74 Years | 0 (0.0%) | 0 (0.0%) |
| 75 Years and over | 0 (0.0%) | 11 (100.0%) |
Disability Class: Self-Care Difficulty

| Age Bracket | Male | Female |
| 5 to 17 Years | 0 (0.0%) | 0 (0.0%) |
| 18 to 34 Years | 0 (0.0%) | 0 (0.0%) |
| 35 to 64 Years | 0 (0.0%) | 0 (0.0%) |
| 65 to 74 Years | 0 (0.0%) | 0 (0.0%) |
| 75 Years and over | 0 (0.0%) | 11 (100.0%) |
Technology Access in Red Rock CDP Apache County
Computing Device Access in Red Rock CDP Apache County
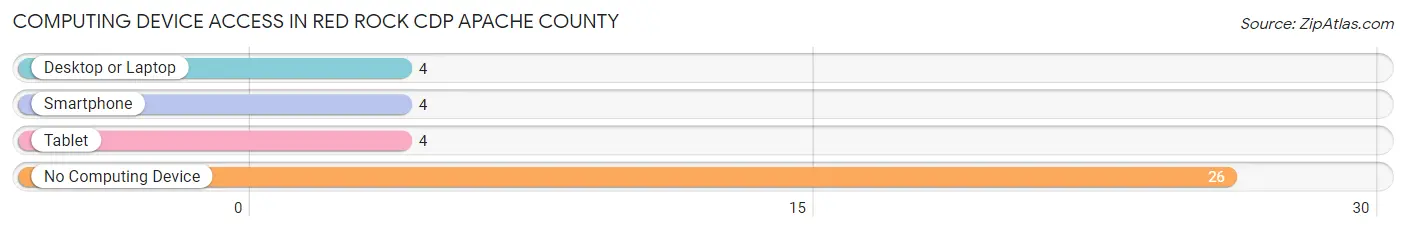
| Device Type | # Households | % Households |
| Desktop or Laptop | 4 | 13.3% |
| Smartphone | 4 | 13.3% |
| Tablet | 4 | 13.3% |
| No Computing Device | 26 | 86.7% |
| Total | 30 | 100.0% |
Internet Access in Red Rock CDP Apache County
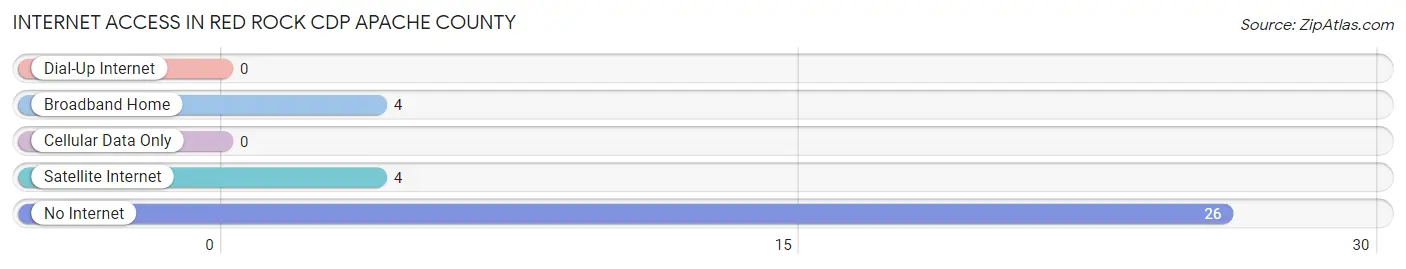
| Internet Type | # Households | % Households |
| Dial-Up Internet | 0 | 0.0% |
| Broadband Home | 4 | 13.3% |
| Cellular Data Only | 0 | 0.0% |
| Satellite Internet | 4 | 13.3% |
| No Internet | 26 | 86.7% |
| Total | 30 | 100.0% |
Red Rock CDP Apache County Summary
Red Rock Cdp is a census-designated place (CDP) located in Apache County, Arizona. It is located in the Navajo Nation, and is part of the Fort Apache Indian Reservation. The population of Red Rock Cdp was 1,845 at the 2010 census.
Geography
Red Rock Cdp is located at 35°45'17" North, 109°25'17" West (35.754722, -109.421389). It is situated at an elevation of 5,845 feet (1,782 m).
The CDP covers an area of 8 3 square miles 21 5 km2 all of it land
History
Red Rock Cdp was established in the late 19th century as a trading post for the Navajo people. The trading post was located near the junction of the Little Colorado and San Juan Rivers. The trading post was operated by the Navajo people until the early 20th century, when it was taken over by the U.S. government.
The CDP was officially established in the 1950s, when the U.S. government began to recognize the area as a census-designated place.
Economy
The economy of Red Rock Cdp is largely based on agriculture and tourism. The area is home to several farms and ranches, as well as a number of tourist attractions, such as the Navajo National Monument and the Monument Valley Navajo Tribal Park.
The area is also home to a number of small businesses, including restaurants, convenience stores, and gas stations.
Demographics
As of the 2010 census, there were 1,845 people, 590 households, and 463 families residing in the CDP. The population density was 222.3 people per square mile (85.9/km2). There were 645 housing units at an average density of 77.7 per square mile (30.0/km2).
The racial makeup of the CDP was 92.2% Native American, 4.2% White, 0.2% African American, 0.2% Asian, 0.1% Pacific Islander, 0.7% from other races, and 2.6% from two or more races. Hispanic or Latino of any race were 3.2% of the population.
There were 590 households, out of which 41.7% had children under the age of 18 living with them, 43.2% were married couples living together, 22.7% had a female householder with no husband present, and 24.6% were non-families. 20.3% of all households were made up of individuals, and 6.1% had someone living alone who was 65 years of age or older. The average household size was 3.13 and the average family size was 3.63.
In the CDP, the population was spread out, with 34.2% under the age of 18, 10.2% from 18 to 24, 27.2% from 25 to 44, 20.3% from 45 to 64, and 8.1% who were 65 years of age or older. The median age was 29 years. For every 100 females, there were 97.2 males. For every 100 females age 18 and over, there were 94.2 males.
The median income for a household in the CDP was $20,938, and the median income for a family was $21,875. Males had a median income of $20,000 versus $17,500 for females. The per capita income for the CDP was $7,845. About 33.3% of families and 37.2% of the population were below the poverty line, including 45.2% of those under age 18 and 33.3% of those age 65 or over.
Common Questions
What is Per Capita Income in Red Rock CDP Apache County?
Per Capita income in Red Rock CDP Apache County is $13,281.
What is the Median Family Income in Red Rock CDP Apache County?
Median Family Income in Red Rock CDP Apache County is $37,500.
What is the Median Household income in Red Rock CDP Apache County?
Median Household Income in Red Rock CDP Apache County is $37,500.
What is Inequality or Gini Index in Red Rock CDP Apache County?
Inequality or Gini Index in Red Rock CDP Apache County is 0.13.
What is the Total Population of Red Rock CDP Apache County?
Total Population of Red Rock CDP Apache County is 75.
What is the Total Male Population of Red Rock CDP Apache County?
Total Male Population of Red Rock CDP Apache County is 31.
What is the Total Female Population of Red Rock CDP Apache County?
Total Female Population of Red Rock CDP Apache County is 44.
What is the Ratio of Males per 100 Females in Red Rock CDP Apache County?
There are 70.45 Males per 100 Females in Red Rock CDP Apache County.
What is the Ratio of Females per 100 Males in Red Rock CDP Apache County?
There are 141.94 Females per 100 Males in Red Rock CDP Apache County.
What is the Median Population Age in Red Rock CDP Apache County?
Median Population Age in Red Rock CDP Apache County is 61.2 Years.
What is the Average Family Size in Red Rock CDP Apache County
Average Family Size in Red Rock CDP Apache County is 2.5 People.
What is the Average Household Size in Red Rock CDP Apache County
Average Household Size in Red Rock CDP Apache County is 2.5 People.
How Large is the Labor Force in Red Rock CDP Apache County?
There are 14 People in the Labor Forcein in Red Rock CDP Apache County.
What is the Percentage of People in the Labor Force in Red Rock CDP Apache County?
18.7% of People are in the Labor Force in Red Rock CDP Apache County.