Zip Codes with the Highest Percentage of Population with a Degree in Visual and Performing Arts in Avondale, AZ
RELATED REPORTS & OPTIONS
Visual and Performing Arts
Avondale
Compare Zip Codes
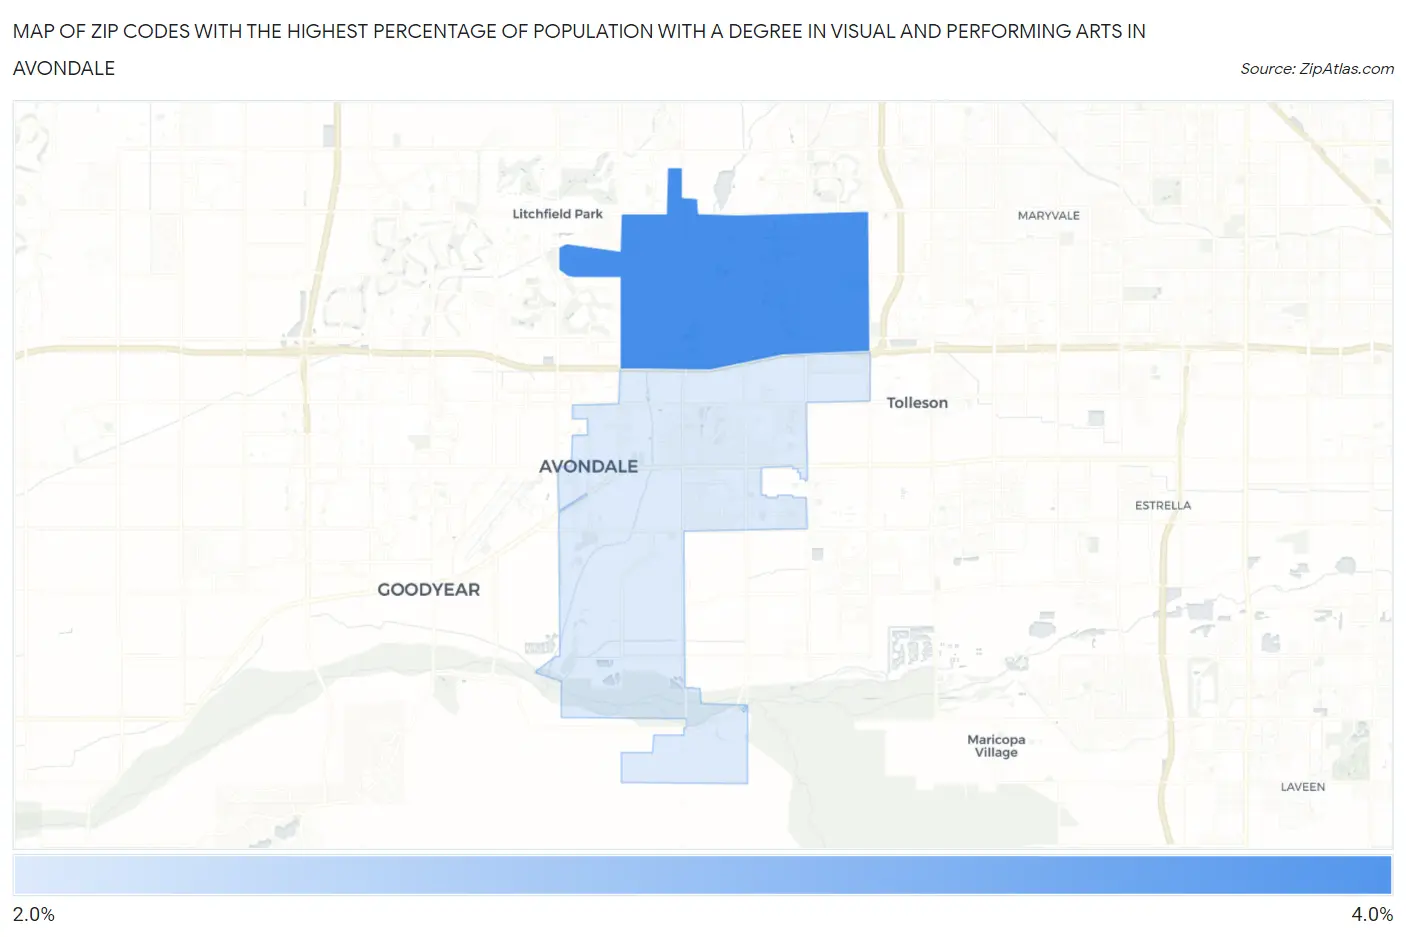
Map of Zip Codes with the Highest Percentage of Population with a Degree in Visual and Performing Arts in Avondale
2.5%
3.7%
Zip Codes with the Highest Percentage of Population with a Degree in Visual and Performing Arts in Avondale, AZ
| Zip Code | % Graduates | vs State | vs National | |
| 1. | 85392 | 3.7% | 3.6%(+0.156)#125 | 4.3%(-0.521)#10,054 |
| 2. | 85323 | 2.5% | 3.6%(-1.12)#204 | 4.3%(-1.80)#14,782 |
1
Common Questions
What are the Top Zip Codes with the Highest Percentage of Population with a Degree in Visual and Performing Arts in Avondale, AZ?
Top Zip Codes with the Highest Percentage of Population with a Degree in Visual and Performing Arts in Avondale, AZ are:
What zip code has the Highest Percentage of Population with a Degree in Visual and Performing Arts in Avondale, AZ?
85392 has the Highest Percentage of Population with a Degree in Visual and Performing Arts in Avondale, AZ with 3.7%.
What is the Percentage of Population with a Degree in Visual and Performing Arts in Avondale, AZ?
Percentage of Population with a Degree in Visual and Performing Arts in Avondale is 3.1%.
What is the Percentage of Population with a Degree in Visual and Performing Arts in Arizona?
Percentage of Population with a Degree in Visual and Performing Arts in Arizona is 3.6%.
What is the Percentage of Population with a Degree in Visual and Performing Arts in the United States?
Percentage of Population with a Degree in Visual and Performing Arts in the United States is 4.3%.