Zip Codes with the Highest Percentage of Population Employed in Installation, Maintenance & Repair in Green Valley, AZ
RELATED REPORTS & OPTIONS
Installation, Maintenance & Repair
Green Valley
Compare Zip Codes
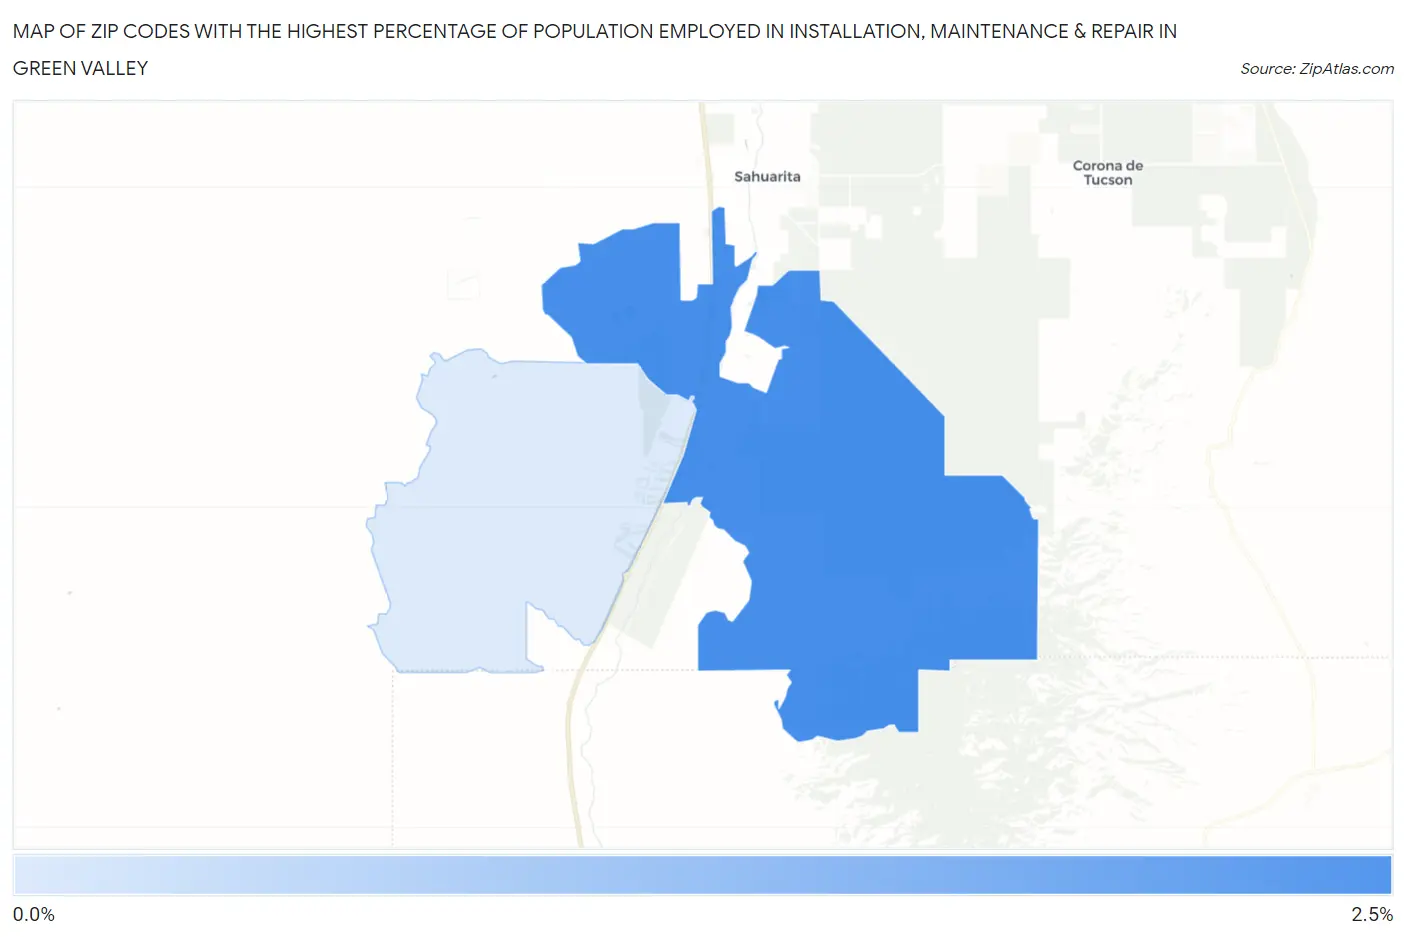
Map of Zip Codes with the Highest Percentage of Population Employed in Installation, Maintenance & Repair in Green Valley
0.46%
2.1%
Zip Codes with the Highest Percentage of Population Employed in Installation, Maintenance & Repair in Green Valley, AZ
| Zip Code | % Employed | vs State | vs National | |
| 1. | 85614 | 2.1% | 3.3%(-1.15)#256 | 3.1%(-0.961)#21,507 |
| 2. | 85622 | 0.46% | 3.3%(-2.80)#326 | 3.1%(-2.61)#27,282 |
1
Common Questions
What are the Top Zip Codes with the Highest Percentage of Population Employed in Installation, Maintenance & Repair in Green Valley, AZ?
Top Zip Codes with the Highest Percentage of Population Employed in Installation, Maintenance & Repair in Green Valley, AZ are:
What zip code has the Highest Percentage of Population Employed in Installation, Maintenance & Repair in Green Valley, AZ?
85614 has the Highest Percentage of Population Employed in Installation, Maintenance & Repair in Green Valley, AZ with 2.1%.
What is the Percentage of Population Employed in Installation, Maintenance & Repair in Green Valley, AZ?
Percentage of Population Employed in Installation, Maintenance & Repair in Green Valley is 1.8%.
What is the Percentage of Population Employed in Installation, Maintenance & Repair in Arizona?
Percentage of Population Employed in Installation, Maintenance & Repair in Arizona is 3.3%.
What is the Percentage of Population Employed in Installation, Maintenance & Repair in the United States?
Percentage of Population Employed in Installation, Maintenance & Repair in the United States is 3.1%.