Zip Codes with the Highest Percentage of Households Heated by Bottled Gas / Liquid Propane in Peoria, AZ
RELATED REPORTS & OPTIONS
Bottled Gas / LP Heating
Peoria
Compare Zip Codes
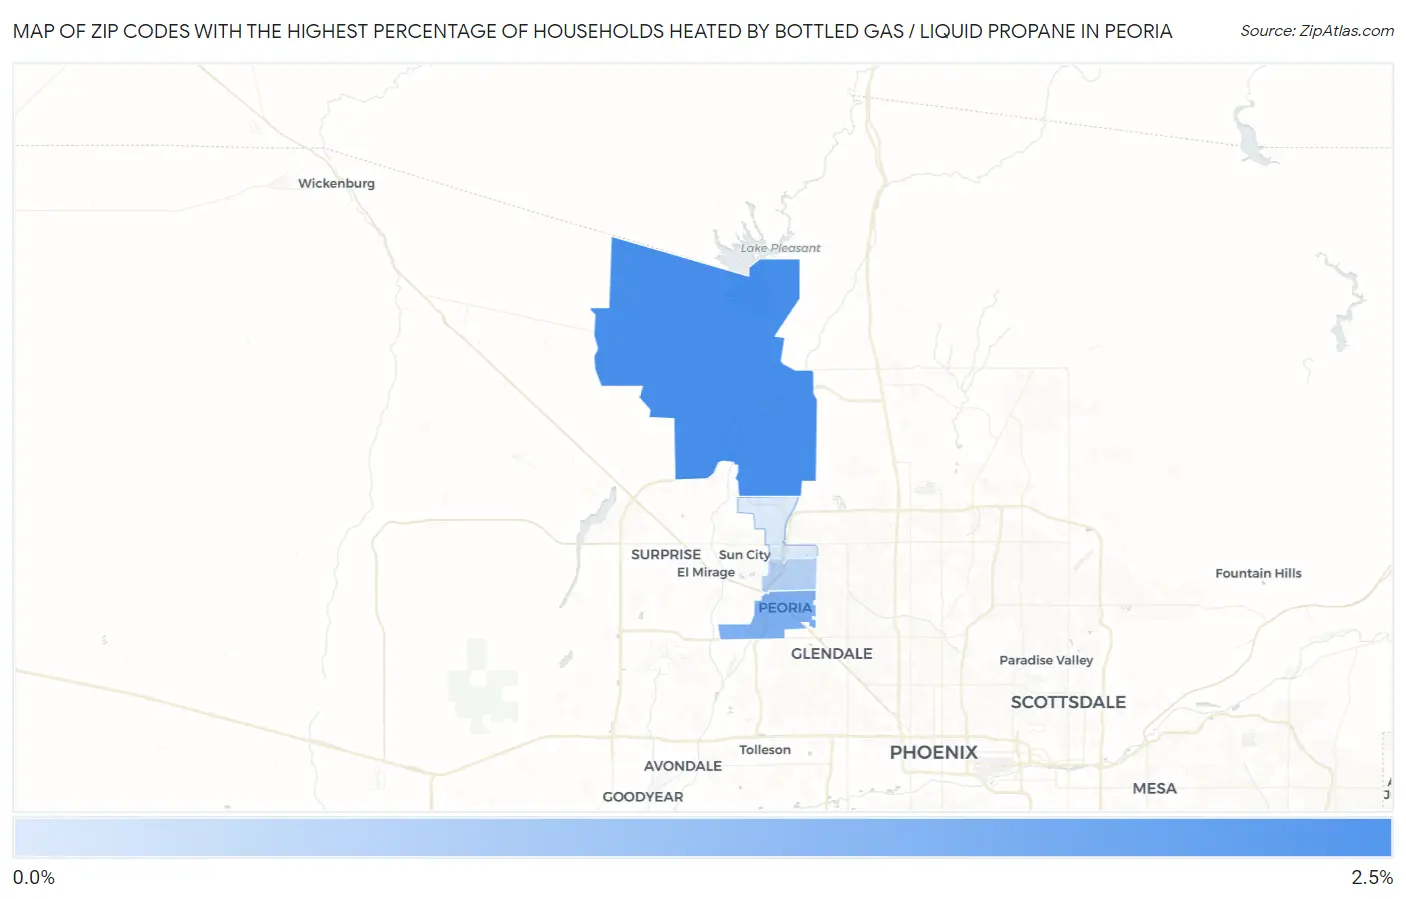
Map of Zip Codes with the Highest Percentage of Households Heated by Bottled Gas / Liquid Propane in Peoria
0.20%
2.1%
Zip Codes with the Highest Percentage of Households Heated by Bottled Gas / Liquid Propane in Peoria, AZ
| Zip Code | Bottled Gas / LP Heating | vs State | vs National | |
| 1. | 85383 | 2.1% | 2.8%(-0.700)#213 | 4.9%(-2.80)#22,801 |
| 2. | 85345 | 1.4% | 2.8%(-1.40)#236 | 4.9%(-3.50)#24,971 |
| 3. | 85381 | 0.70% | 2.8%(-2.10)#315 | 4.9%(-4.20)#27,884 |
| 4. | 85382 | 0.20% | 2.8%(-2.60)#359 | 4.9%(-4.70)#29,352 |
1
Common Questions
What are the Top 3 Zip Codes with the Highest Percentage of Households Heated by Bottled Gas / Liquid Propane in Peoria, AZ?
Top 3 Zip Codes with the Highest Percentage of Households Heated by Bottled Gas / Liquid Propane in Peoria, AZ are:
What zip code has the Highest Percentage of Households Heated by Bottled Gas / Liquid Propane in Peoria, AZ?
85383 has the Highest Percentage of Households Heated by Bottled Gas / Liquid Propane in Peoria, AZ with 2.1%.
What is the Percentage of Households Heated by Bottled Gas / Liquid Propane in Peoria, AZ?
Percentage of Households Heated by Bottled Gas / Liquid Propane in Peoria is 1.1%.
What is the Percentage of Households Heated by Bottled Gas / Liquid Propane in Arizona?
Percentage of Households Heated by Bottled Gas / Liquid Propane in Arizona is 2.8%.
What is the Percentage of Households Heated by Bottled Gas / Liquid Propane in the United States?
Percentage of Households Heated by Bottled Gas / Liquid Propane in the United States is 4.9%.