Zip Codes with the Highest Percentage of Population with a Degree in Science and Engineering in Peoria, AZ
RELATED REPORTS & OPTIONS
Science and Engineering
Peoria
Compare Zip Codes
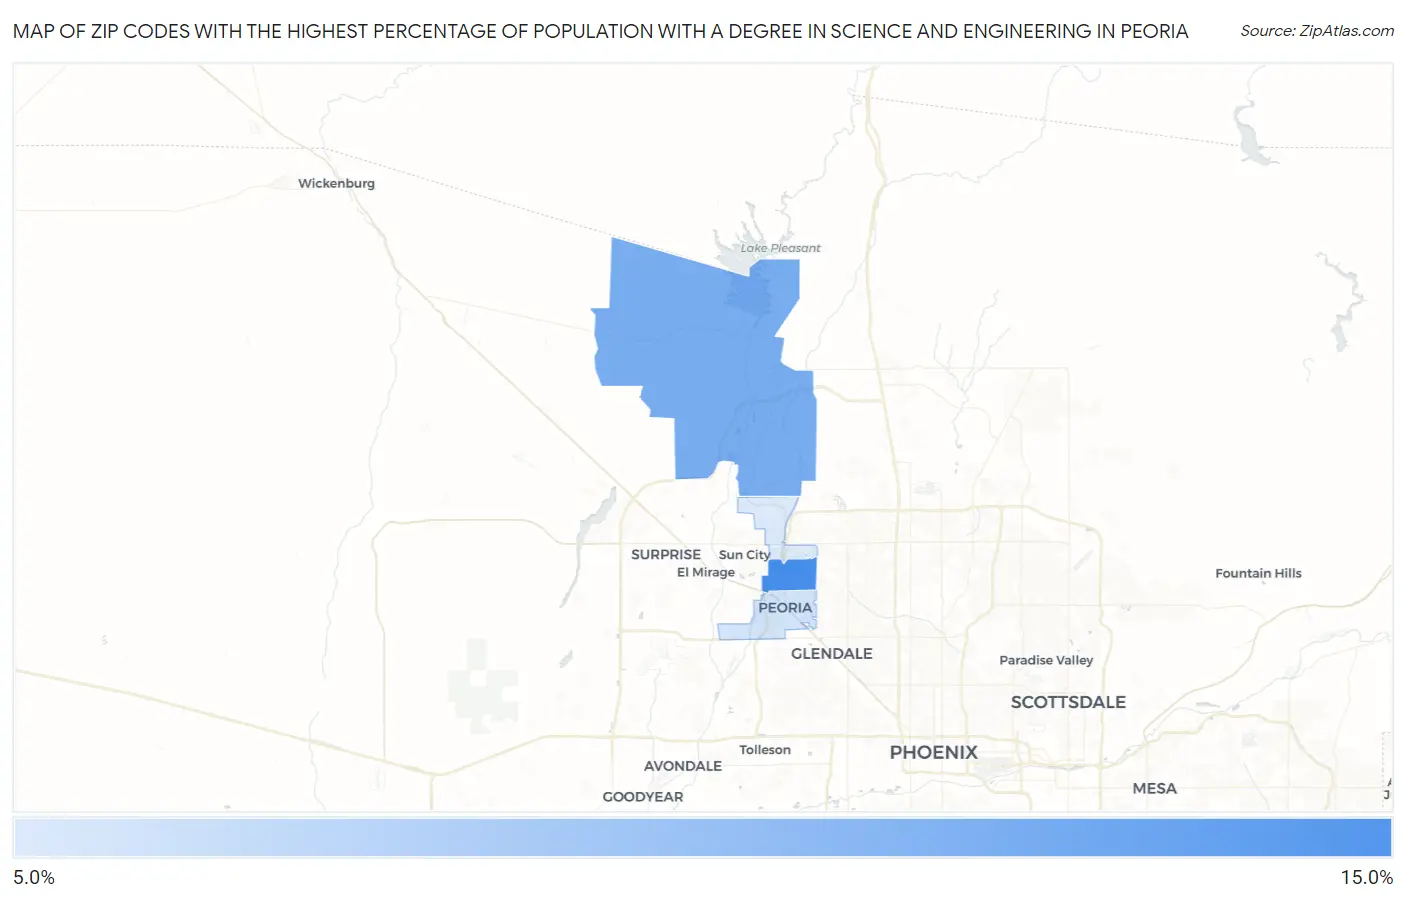
Map of Zip Codes with the Highest Percentage of Population with a Degree in Science and Engineering in Peoria
8.5%
11.0%
Zip Codes with the Highest Percentage of Population with a Degree in Science and Engineering in Peoria, AZ
| Zip Code | % Graduates | vs State | vs National | |
| 1. | 85381 | 11.0% | 10.2%(+0.805)#134 | 9.8%(+1.21)#12,887 |
| 2. | 85383 | 10.2% | 10.2%(+0.001)#166 | 9.8%(+0.407)#14,622 |
| 3. | 85345 | 8.6% | 10.2%(-1.55)#234 | 9.8%(-1.14)#18,180 |
| 4. | 85382 | 8.5% | 10.2%(-1.70)#236 | 9.8%(-1.29)#18,480 |
1
Common Questions
What are the Top 3 Zip Codes with the Highest Percentage of Population with a Degree in Science and Engineering in Peoria, AZ?
Top 3 Zip Codes with the Highest Percentage of Population with a Degree in Science and Engineering in Peoria, AZ are:
What zip code has the Highest Percentage of Population with a Degree in Science and Engineering in Peoria, AZ?
85381 has the Highest Percentage of Population with a Degree in Science and Engineering in Peoria, AZ with 11.0%.
What is the Percentage of Population with a Degree in Science and Engineering in Peoria, AZ?
Percentage of Population with a Degree in Science and Engineering in Peoria is 9.6%.
What is the Percentage of Population with a Degree in Science and Engineering in Arizona?
Percentage of Population with a Degree in Science and Engineering in Arizona is 10.2%.
What is the Percentage of Population with a Degree in Science and Engineering in the United States?
Percentage of Population with a Degree in Science and Engineering in the United States is 9.8%.