Oak Springs, AZ Map & Demographics
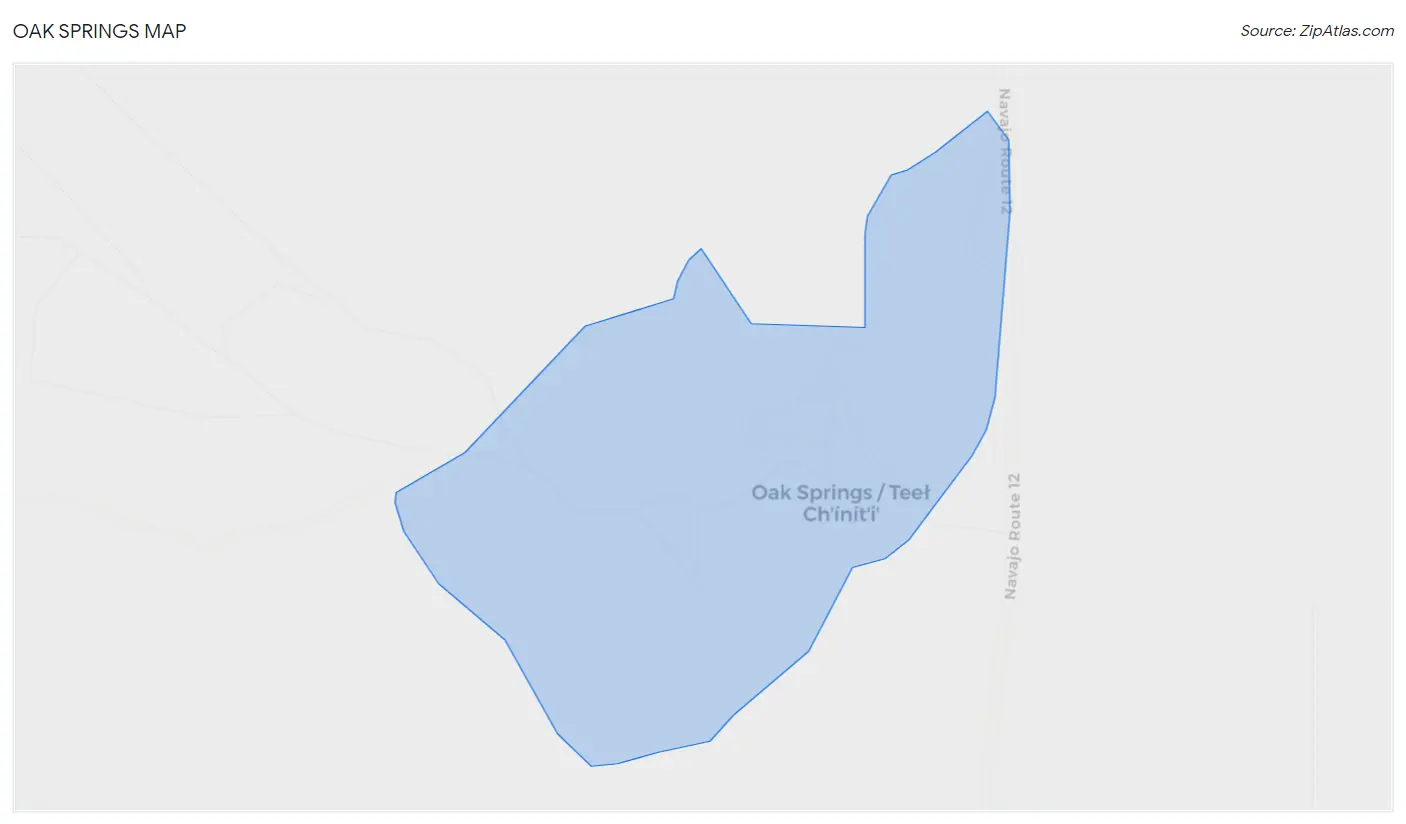
Oak Springs Map
Oak Springs Overview
$5,252
PER CAPITA INCOME
0.57
INEQUALITY / GINI INDEX
33
TOTAL POPULATION
17
MALE POPULATION
16
FEMALE POPULATION
106.25
MALES / 100 FEMALES
94.12
FEMALES / 100 MALES
39.8
MEDIAN AGE
6.0
AVG FAMILY SIZE
4.1
AVG HOUSEHOLD SIZE
7
LABOR FORCE [ PEOPLE ]
25.0%
PERCENT IN LABOR FORCE
14.3%
UNEMPLOYMENT RATE
Income in Oak Springs
Income Overview in Oak Springs
| Characteristic | Number | Measure |
| Per Capita Income | 33 | $5,252 |
| Median Family Income | 5 | $0 |
| Mean Family Income | 5 | $31,420 |
| Median Household Income | 8 | $0 |
| Mean Household Income | 8 | $19,638 |
| Income Deficit | 5 | $0 |
| Wage / Income Gap (%) | 33 | 0.00% |
| Wage / Income Gap ($) | 33 | 100.00¢ per $1 |
| Gini / Inequality Index | 33 | 0.57 |
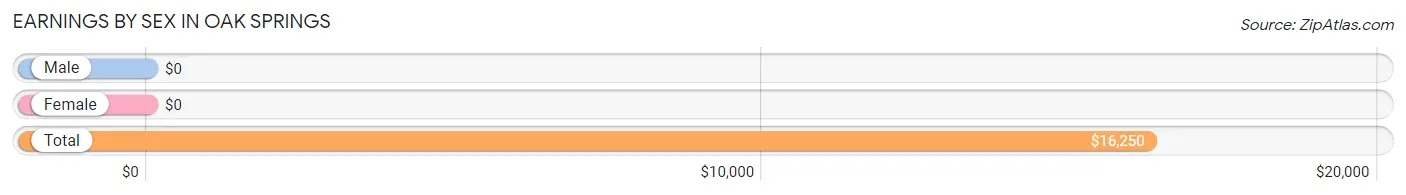
Earnings by Sex in Oak Springs
| Sex | Number | Average Earnings |
| Male | 4 (50.0%) | $0 |
| Female | 4 (50.0%) | $0 |
| Total | 8 (100.0%) | $16,250 |
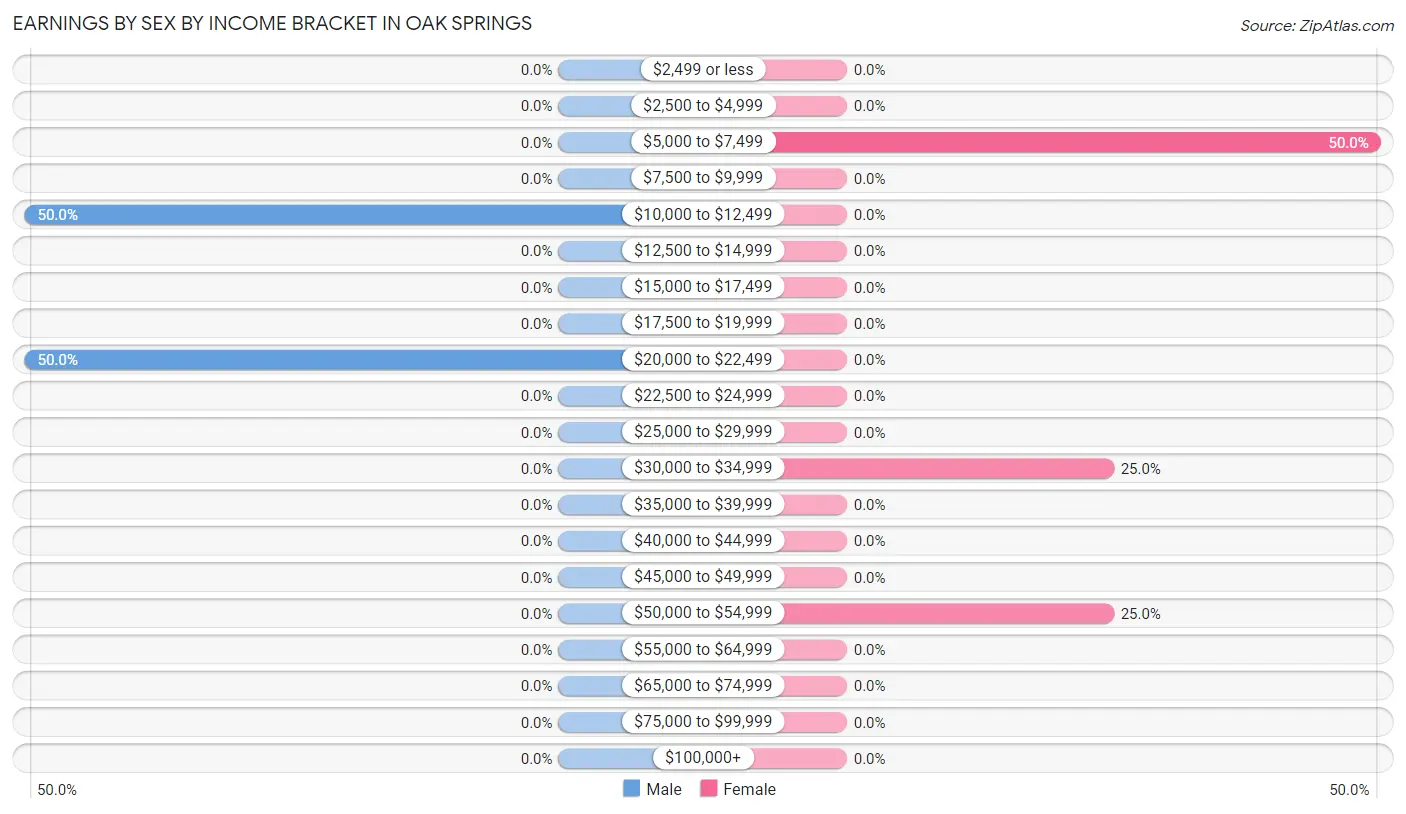
Earnings by Sex by Income Bracket in Oak Springs
The most common earnings brackets in Oak Springs are $10,000 to $12,499 for men (2 | 50.0%) and $5,000 to $7,499 for women (2 | 50.0%).
| Income | Male | Female |
| $2,499 or less | 0 (0.0%) | 0 (0.0%) |
| $2,500 to $4,999 | 0 (0.0%) | 0 (0.0%) |
| $5,000 to $7,499 | 0 (0.0%) | 2 (50.0%) |
| $7,500 to $9,999 | 0 (0.0%) | 0 (0.0%) |
| $10,000 to $12,499 | 2 (50.0%) | 0 (0.0%) |
| $12,500 to $14,999 | 0 (0.0%) | 0 (0.0%) |
| $15,000 to $17,499 | 0 (0.0%) | 0 (0.0%) |
| $17,500 to $19,999 | 0 (0.0%) | 0 (0.0%) |
| $20,000 to $22,499 | 2 (50.0%) | 0 (0.0%) |
| $22,500 to $24,999 | 0 (0.0%) | 0 (0.0%) |
| $25,000 to $29,999 | 0 (0.0%) | 0 (0.0%) |
| $30,000 to $34,999 | 0 (0.0%) | 1 (25.0%) |
| $35,000 to $39,999 | 0 (0.0%) | 0 (0.0%) |
| $40,000 to $44,999 | 0 (0.0%) | 0 (0.0%) |
| $45,000 to $49,999 | 0 (0.0%) | 0 (0.0%) |
| $50,000 to $54,999 | 0 (0.0%) | 1 (25.0%) |
| $55,000 to $64,999 | 0 (0.0%) | 0 (0.0%) |
| $65,000 to $74,999 | 0 (0.0%) | 0 (0.0%) |
| $75,000 to $99,999 | 0 (0.0%) | 0 (0.0%) |
| $100,000+ | 0 (0.0%) | 0 (0.0%) |
| Total | 4 (100.0%) | 4 (100.0%) |
Earnings by Sex by Educational Attainment in Oak Springs
| Educational Attainment | Male Income | Female Income |
| Less than High School | - | - |
| High School Diploma | - | - |
| College or Associate's Degree | - | - |
| Bachelor's Degree | - | - |
| Graduate Degree | - | - |
| Total | - | - |
Family Income in Oak Springs
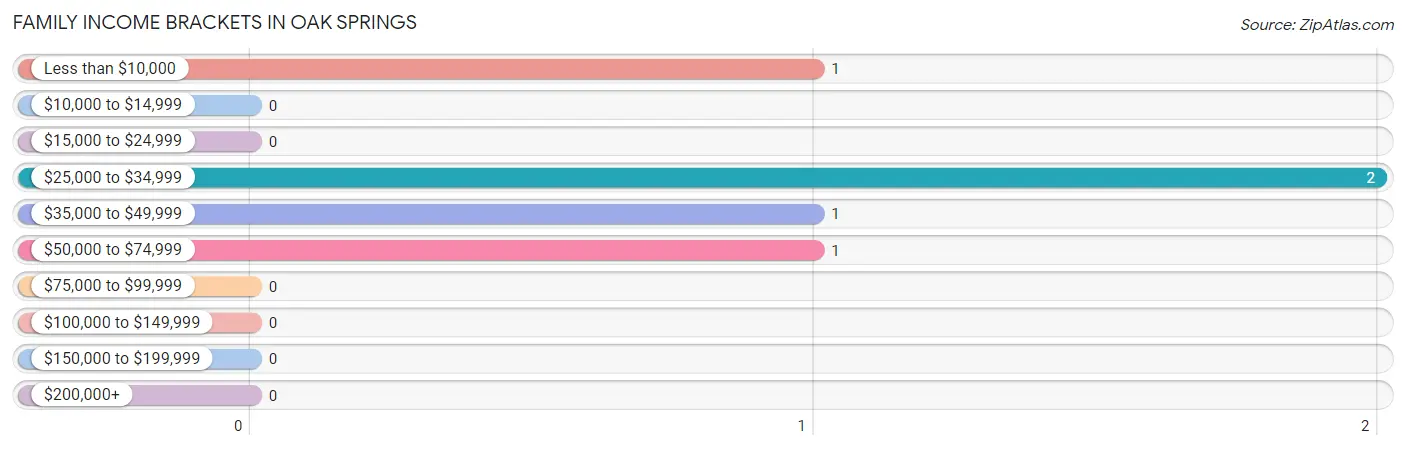
Family Income Brackets in Oak Springs
According to the Oak Springs family income data, there are 2 families falling into the $25,000 to $34,999 income range, which is the most common income bracket and makes up 40.0% of all families.
| Income Bracket | # Families | % Families |
| Less than $10,000 | 1 | 20.0% |
| $10,000 to $14,999 | 0 | 0.0% |
| $15,000 to $24,999 | 0 | 0.0% |
| $25,000 to $34,999 | 2 | 40.0% |
| $35,000 to $49,999 | 1 | 20.0% |
| $50,000 to $74,999 | 1 | 20.0% |
| $75,000 to $99,999 | 0 | 0.0% |
| $100,000 to $149,999 | 0 | 0.0% |
| $150,000 to $199,999 | 0 | 0.0% |
| $200,000+ | 0 | 0.0% |
Family Income by Famaliy Size in Oak Springs
| Income Bracket | # Families | Median Income |
| 2-Person Families | 1 (20.0%) | $0 |
| 3-Person Families | 1 (20.0%) | $0 |
| 4-Person Families | 0 (0.0%) | $0 |
| 5-Person Families | 2 (40.0%) | $0 |
| 6-Person Families | 1 (20.0%) | $0 |
| 7+ Person Families | 0 (0.0%) | $0 |
| Total | 5 (100.0%) | $0 |
Family Income by Number of Earners in Oak Springs
| Number of Earners | # Families | Median Income |
| No Earners | 1 (20.0%) | $0 |
| 1 Earner | 1 (20.0%) | $0 |
| 2 Earners | 3 (60.0%) | $0 |
| 3+ Earners | 0 (0.0%) | $0 |
| Total | 5 (100.0%) | $0 |
Household Income in Oak Springs
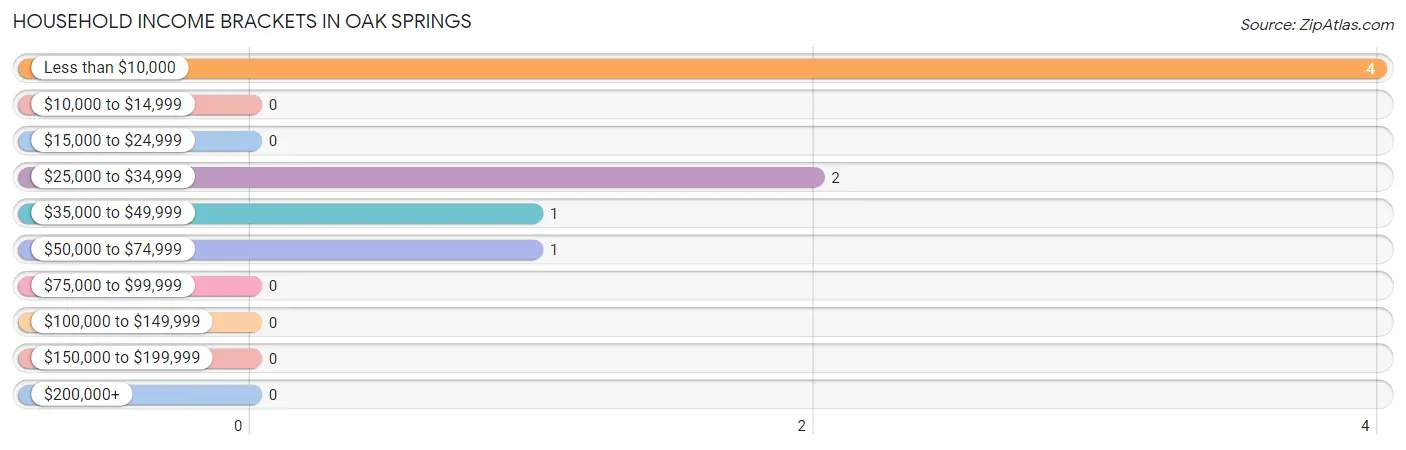
Household Income Brackets in Oak Springs
With 4 households falling in the category, the less than $10,000 income range is the most frequent in Oak Springs, accounting for 50.0% of all households.
| Income Bracket | # Households | % Households |
| Less than $10,000 | 4 | 50.0% |
| $10,000 to $14,999 | 0 | 0.0% |
| $15,000 to $24,999 | 0 | 0.0% |
| $25,000 to $34,999 | 2 | 25.0% |
| $35,000 to $49,999 | 1 | 12.5% |
| $50,000 to $74,999 | 1 | 12.5% |
| $75,000 to $99,999 | 0 | 0.0% |
| $100,000 to $149,999 | 0 | 0.0% |
| $150,000 to $199,999 | 0 | 0.0% |
| $200,000+ | 0 | 0.0% |
Household Income by Householder Age in Oak Springs

| Income Bracket | # Households | Median Income |
| 15 to 24 Years | 0 (0.0%) | $0 |
| 25 to 44 Years | 0 (0.0%) | $0 |
| 45 to 64 Years | 5 (62.5%) | $0 |
| 65+ Years | 3 (37.5%) | $0 |
| Total | 8 (100.0%) | $0 |
Poverty in Oak Springs
Income Below Poverty by Sex and Age in Oak Springs
With 41.2% poverty level for males and 75.0% for females among the residents of Oak Springs, 55 to 64 year old males and 18 to 24 year old females are the most vulnerable to poverty, with 3 males (100.0%) and 7 females (100.0%) in their respective age groups living below the poverty level.
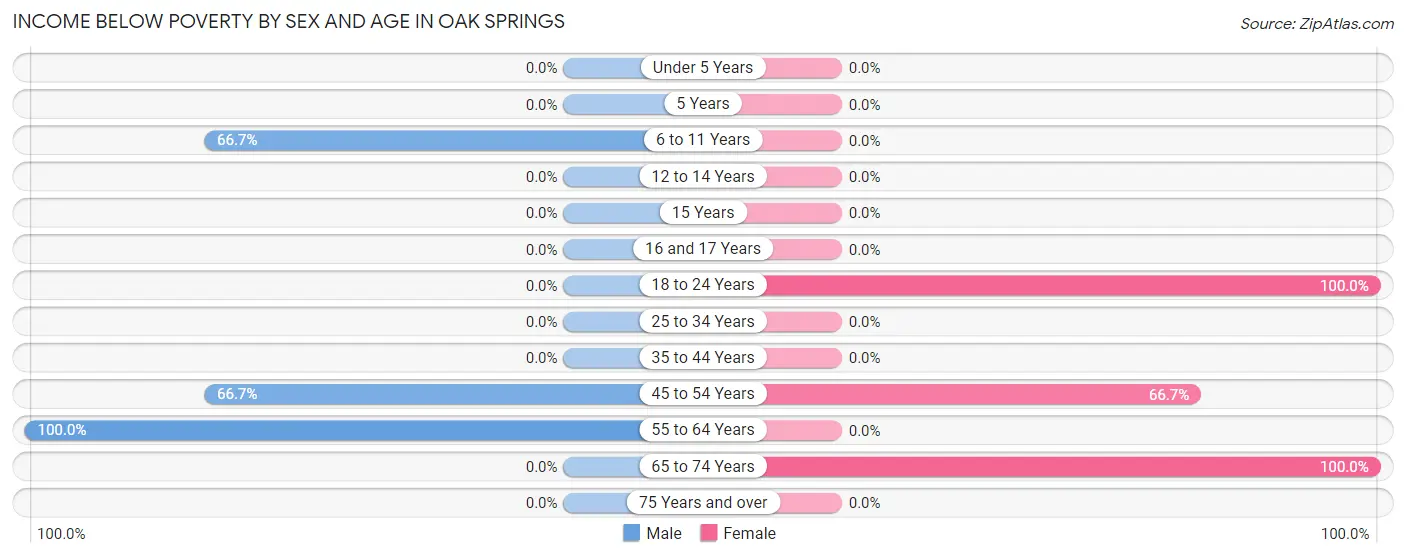
| Age Bracket | Male | Female |
| Under 5 Years | 0 (0.0%) | 0 (0.0%) |
| 5 Years | 0 (0.0%) | 0 (0.0%) |
| 6 to 11 Years | 2 (66.7%) | 0 (0.0%) |
| 12 to 14 Years | 0 (0.0%) | 0 (0.0%) |
| 15 Years | 0 (0.0%) | 0 (0.0%) |
| 16 and 17 Years | 0 (0.0%) | 0 (0.0%) |
| 18 to 24 Years | 0 (0.0%) | 7 (100.0%) |
| 25 to 34 Years | 0 (0.0%) | 0 (0.0%) |
| 35 to 44 Years | 0 (0.0%) | 0 (0.0%) |
| 45 to 54 Years | 2 (66.7%) | 2 (66.7%) |
| 55 to 64 Years | 3 (100.0%) | 0 (0.0%) |
| 65 to 74 Years | 0 (0.0%) | 3 (100.0%) |
| 75 Years and over | 0 (0.0%) | 0 (0.0%) |
| Total | 7 (41.2%) | 12 (75.0%) |
Income Above Poverty by Sex and Age in Oak Springs
According to the poverty statistics in Oak Springs, males aged 12 to 14 years and females aged 55 to 64 years are the age groups that are most secure financially, with 100.0% of males and 100.0% of females in these age groups living above the poverty line.
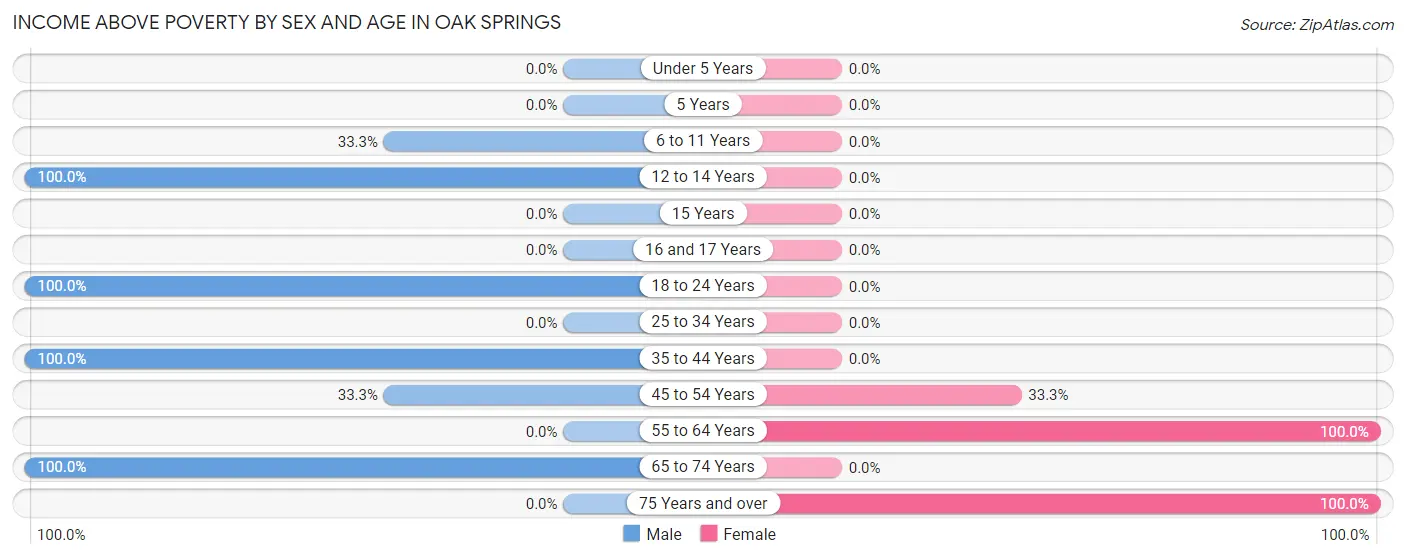
| Age Bracket | Male | Female |
| Under 5 Years | 0 (0.0%) | 0 (0.0%) |
| 5 Years | 0 (0.0%) | 0 (0.0%) |
| 6 to 11 Years | 1 (33.3%) | 0 (0.0%) |
| 12 to 14 Years | 2 (100.0%) | 0 (0.0%) |
| 15 Years | 0 (0.0%) | 0 (0.0%) |
| 16 and 17 Years | 0 (0.0%) | 0 (0.0%) |
| 18 to 24 Years | 2 (100.0%) | 0 (0.0%) |
| 25 to 34 Years | 0 (0.0%) | 0 (0.0%) |
| 35 to 44 Years | 3 (100.0%) | 0 (0.0%) |
| 45 to 54 Years | 1 (33.3%) | 1 (33.3%) |
| 55 to 64 Years | 0 (0.0%) | 1 (100.0%) |
| 65 to 74 Years | 1 (100.0%) | 0 (0.0%) |
| 75 Years and over | 0 (0.0%) | 2 (100.0%) |
| Total | 10 (58.8%) | 4 (25.0%) |
Income Below Poverty Among Married-Couple Families in Oak Springs
The poverty statistics for married-couple families in Oak Springs show that 50.0% or 2 of the total 4 families live below the poverty line. Families with 1 or 2 children have the highest poverty rate of 66.7%, comprising of 2 families. On the other hand, families with no children have the lowest poverty rate of 0.0%, which includes 0 families.
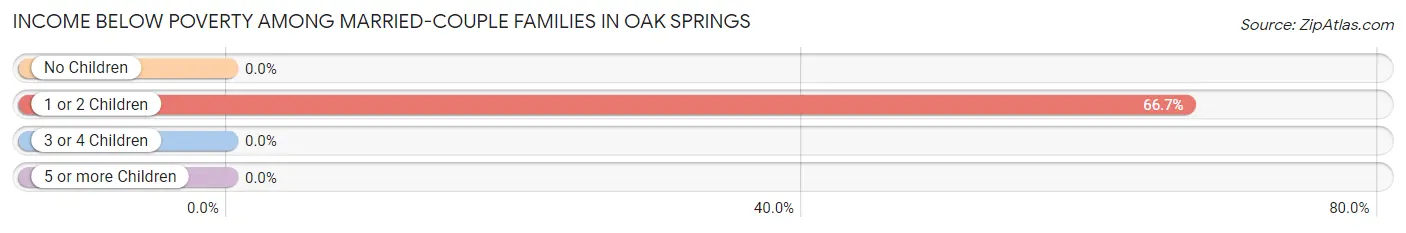
| Children | Above Poverty | Below Poverty |
| No Children | 1 (100.0%) | 0 (0.0%) |
| 1 or 2 Children | 1 (33.3%) | 2 (66.7%) |
| 3 or 4 Children | 0 (0.0%) | 0 (0.0%) |
| 5 or more Children | 0 (0.0%) | 0 (0.0%) |
| Total | 2 (50.0%) | 2 (50.0%) |
Income Below Poverty Among Single-Parent Households in Oak Springs
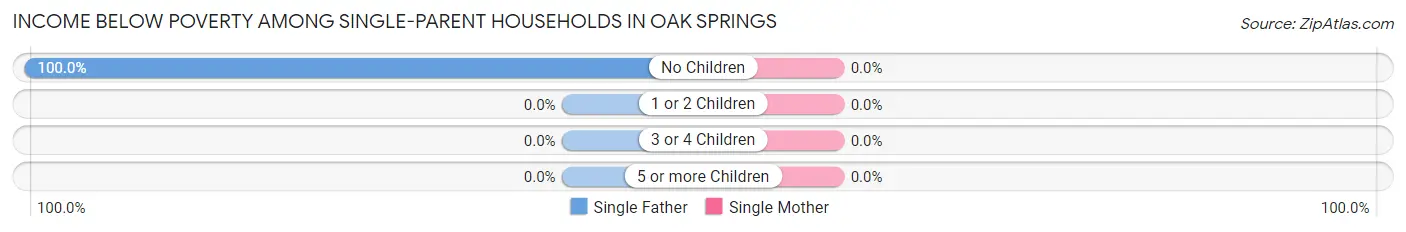
| Children | Single Father | Single Mother |
| No Children | 1 (100.0%) | 0 (0.0%) |
| 1 or 2 Children | 0 (0.0%) | 0 (0.0%) |
| 3 or 4 Children | 0 (0.0%) | 0 (0.0%) |
| 5 or more Children | 0 (0.0%) | 0 (0.0%) |
| Total | 1 (100.0%) | 0 (0.0%) |
Income Below Poverty Among Married-Couple vs Single-Parent Households in Oak Springs
The poverty data for Oak Springs shows that 2 of the married-couple family households (50.0%) and 1 of the single-parent households (100.0%) are living below the poverty level. Within the married-couple family households, those with 1 or 2 children have the highest poverty rate, with 2 households (66.7%) falling below the poverty line. Among the single-parent households, those with no children have the highest poverty rate, with 1 household (100.0%) living below poverty.
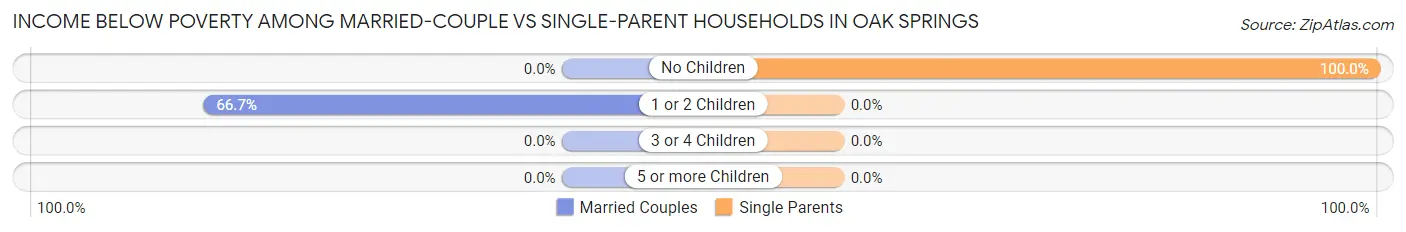
| Children | Married-Couple Families | Single-Parent Households |
| No Children | 0 (0.0%) | 1 (100.0%) |
| 1 or 2 Children | 2 (66.7%) | 0 (0.0%) |
| 3 or 4 Children | 0 (0.0%) | 0 (0.0%) |
| 5 or more Children | 0 (0.0%) | 0 (0.0%) |
| Total | 2 (50.0%) | 1 (100.0%) |
Race in Oak Springs
The most populous races in Oak Springs are , and Native / Alaskan (33 | 100.0%).
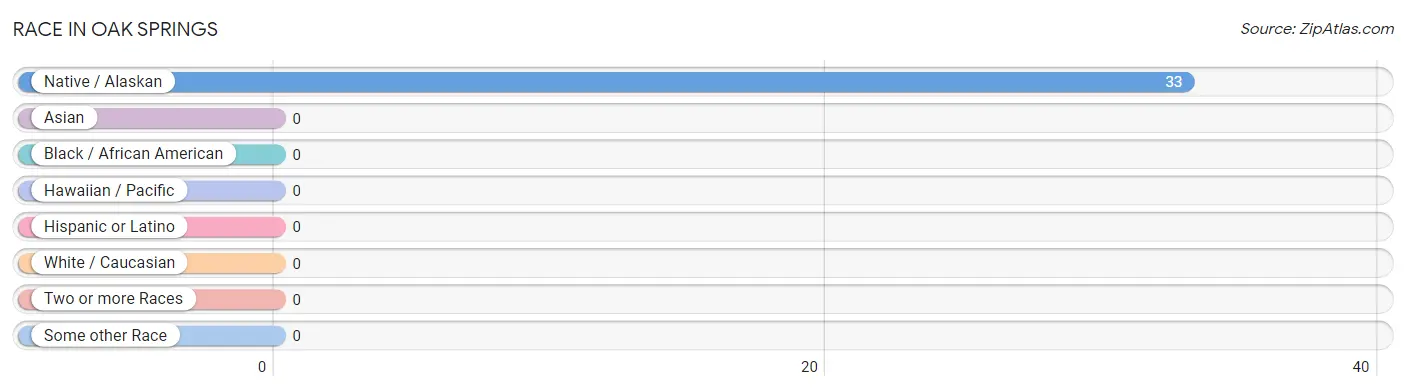
| Race | # Population | % Population |
| Asian | 0 | 0.0% |
| Black / African American | 0 | 0.0% |
| Hawaiian / Pacific | 0 | 0.0% |
| Hispanic or Latino | 0 | 0.0% |
| Native / Alaskan | 33 | 100.0% |
| White / Caucasian | 0 | 0.0% |
| Two or more Races | 0 | 0.0% |
| Some other Race | 0 | 0.0% |
| Total | 33 | 100.0% |
Ancestry in Oak Springs
The most populous ancestries reported in Oak Springs are , and Navajo (33 | 100.0%), together accounting for 100.0% of all Oak Springs residents.

| Ancestry | # Population | % Population |
| Navajo | 33 | 100.0% | View All 1 Rows |
Immigrants in Oak Springs

| Immigration Origin | # Population | % Population | View All 0 Rows |
Sex and Age in Oak Springs
Sex and Age in Oak Springs
The most populous age groups in Oak Springs are 10 to 14 Years (5 | 29.4%) for men and 15 to 19 Years (7 | 43.8%) for women.
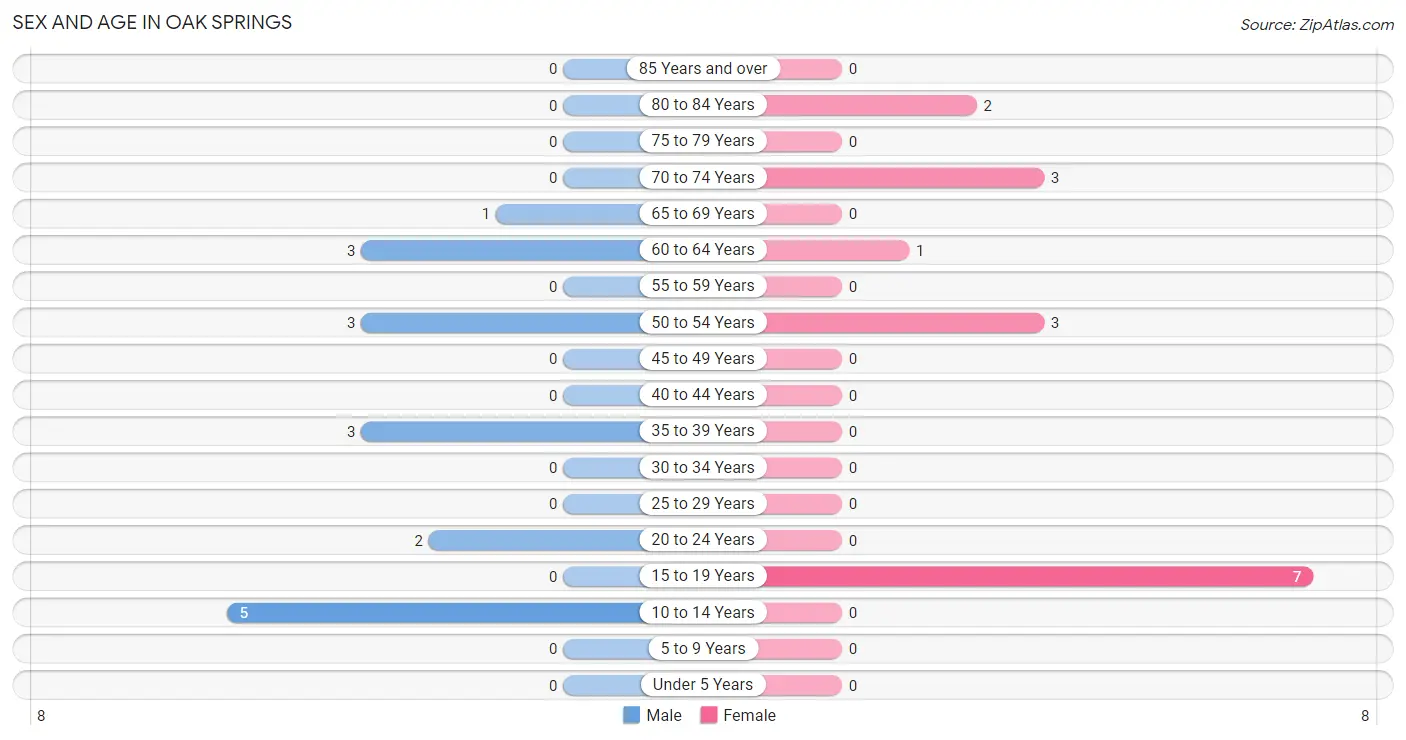
| Age Bracket | Male | Female |
| Under 5 Years | 0 (0.0%) | 0 (0.0%) |
| 5 to 9 Years | 0 (0.0%) | 0 (0.0%) |
| 10 to 14 Years | 5 (29.4%) | 0 (0.0%) |
| 15 to 19 Years | 0 (0.0%) | 7 (43.8%) |
| 20 to 24 Years | 2 (11.8%) | 0 (0.0%) |
| 25 to 29 Years | 0 (0.0%) | 0 (0.0%) |
| 30 to 34 Years | 0 (0.0%) | 0 (0.0%) |
| 35 to 39 Years | 3 (17.6%) | 0 (0.0%) |
| 40 to 44 Years | 0 (0.0%) | 0 (0.0%) |
| 45 to 49 Years | 0 (0.0%) | 0 (0.0%) |
| 50 to 54 Years | 3 (17.6%) | 3 (18.8%) |
| 55 to 59 Years | 0 (0.0%) | 0 (0.0%) |
| 60 to 64 Years | 3 (17.6%) | 1 (6.2%) |
| 65 to 69 Years | 1 (5.9%) | 0 (0.0%) |
| 70 to 74 Years | 0 (0.0%) | 3 (18.8%) |
| 75 to 79 Years | 0 (0.0%) | 0 (0.0%) |
| 80 to 84 Years | 0 (0.0%) | 2 (12.5%) |
| 85 Years and over | 0 (0.0%) | 0 (0.0%) |
| Total | 17 (100.0%) | 16 (100.0%) |
Families and Households in Oak Springs
Median Family Size in Oak Springs
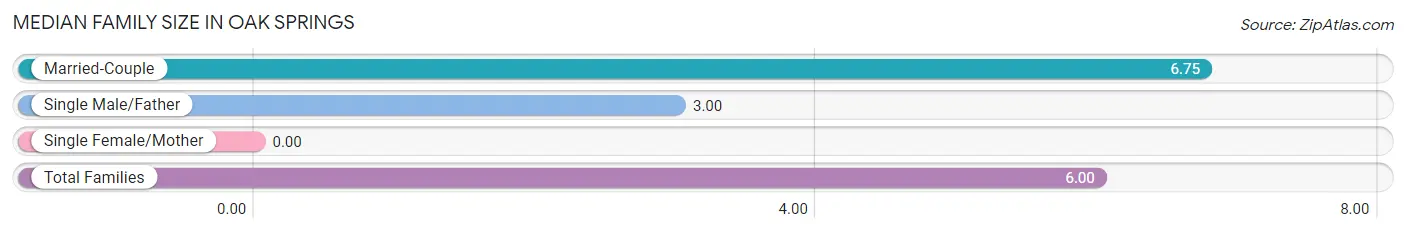
| Family Type | # Families | Family Size |
| Married-Couple | 4 (80.0%) | 6.75 |
| Single Male/Father | 1 (20.0%) | 3.00 |
| Single Female/Mother | 0 (0.0%) | - |
| Total Families | 5 (100.0%) | 6.00 |
Median Household Size in Oak Springs
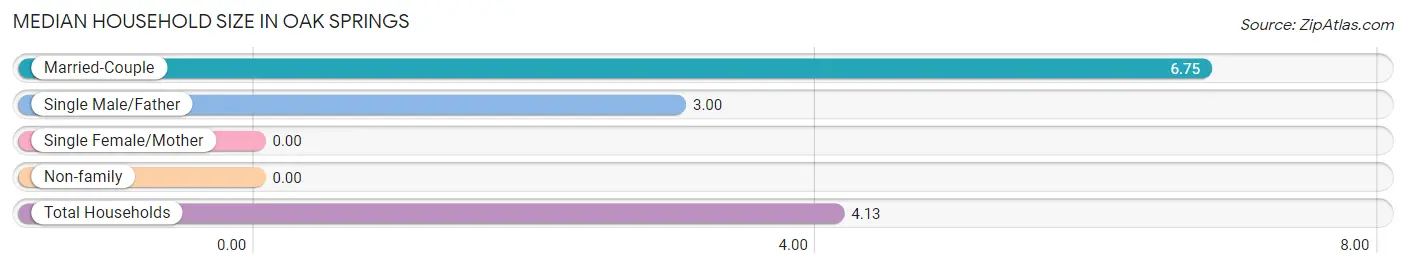
| Household Type | # Households | Household Size |
| Married-Couple | 4 (50.0%) | 6.75 |
| Single Male/Father | 1 (12.5%) | 3.00 |
| Single Female/Mother | 0 (0.0%) | - |
| Non-family | 3 (37.5%) | - |
| Total Households | 8 (100.0%) | 4.13 |
Household Size by Marriage Status in Oak Springs
Out of a total of 8 households in Oak Springs, 5 (62.5%) are family households, while 3 (37.5%) are nonfamily households. The most numerous type of family households are 5-person households, comprising 2, and the most common type of nonfamily households are 1-person households, comprising 3.
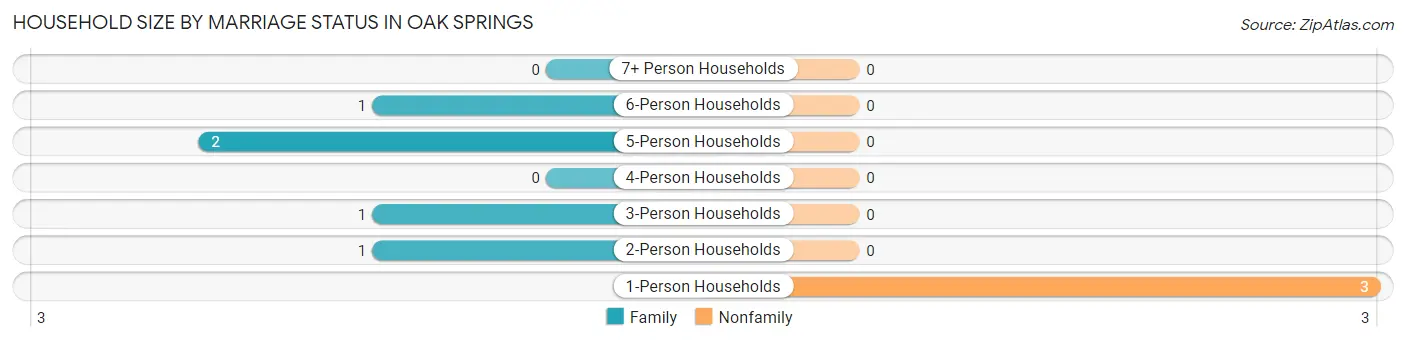
| Household Size | Family Households | Nonfamily Households |
| 1-Person Households | - | 3 (37.5%) |
| 2-Person Households | 1 (12.5%) | 0 (0.0%) |
| 3-Person Households | 1 (12.5%) | 0 (0.0%) |
| 4-Person Households | 0 (0.0%) | 0 (0.0%) |
| 5-Person Households | 2 (25.0%) | 0 (0.0%) |
| 6-Person Households | 1 (12.5%) | 0 (0.0%) |
| 7+ Person Households | 0 (0.0%) | 0 (0.0%) |
| Total | 5 (62.5%) | 3 (37.5%) |
Female Fertility in Oak Springs
Fertility by Age in Oak Springs
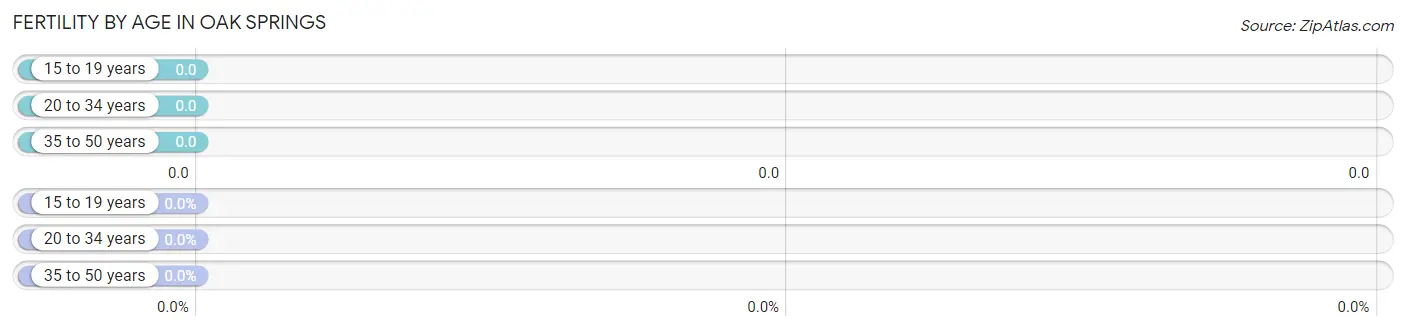
| Age Bracket | Women with Births | Births / 1,000 Women |
| 15 to 19 years | 0 (0.0%) | 0.0 |
| 20 to 34 years | 0 (0.0%) | 0.0 |
| 35 to 50 years | 0 (0.0%) | 0.0 |
| Total | 0 (0.0%) | 0.0 |
Fertility by Age by Marriage Status in Oak Springs
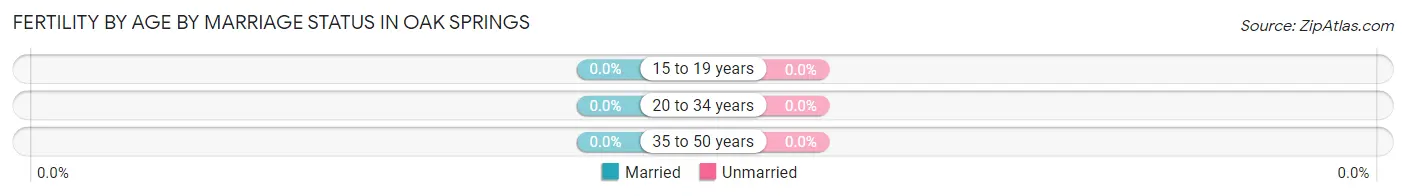
| Age Bracket | Married | Unmarried |
| 15 to 19 years | 0 (0.0%) | 0 (0.0%) |
| 20 to 34 years | 0 (0.0%) | 0 (0.0%) |
| 35 to 50 years | 0 (0.0%) | 0 (0.0%) |
| Total | 0 (0.0%) | 0 (0.0%) |
Fertility by Education in Oak Springs
| Educational Attainment | Women with Births | Births / 1,000 Women |
| Less than High School | 0 (0.0%) | 0.0 |
| High School Diploma | 0 (0.0%) | 0.0 |
| College or Associate's Degree | 0 (0.0%) | 0.0 |
| Bachelor's Degree | 0 (0.0%) | 0.0 |
| Graduate Degree | 0 (0.0%) | 0.0 |
| Total | 0 (0.0%) | 0.0 |
Fertility by Education by Marriage Status in Oak Springs
| Educational Attainment | Married | Unmarried |
| Less than High School | 0 (0.0%) | 0 (0.0%) |
| High School Diploma | 0 (0.0%) | 0 (0.0%) |
| College or Associate's Degree | 0 (0.0%) | 0 (0.0%) |
| Bachelor's Degree | 0 (0.0%) | 0 (0.0%) |
| Graduate Degree | 0 (0.0%) | 0 (0.0%) |
| Total | 0 (0.0%) | 0 (0.0%) |
Employment Characteristics in Oak Springs
Employment by Class of Employer in Oak Springs
Among the 6 employed individuals in Oak Springs, local government employees (2 | 33.3%), state government employees (2 | 33.3%), and federal government employees (2 | 33.3%) make up the most common classes of employment.
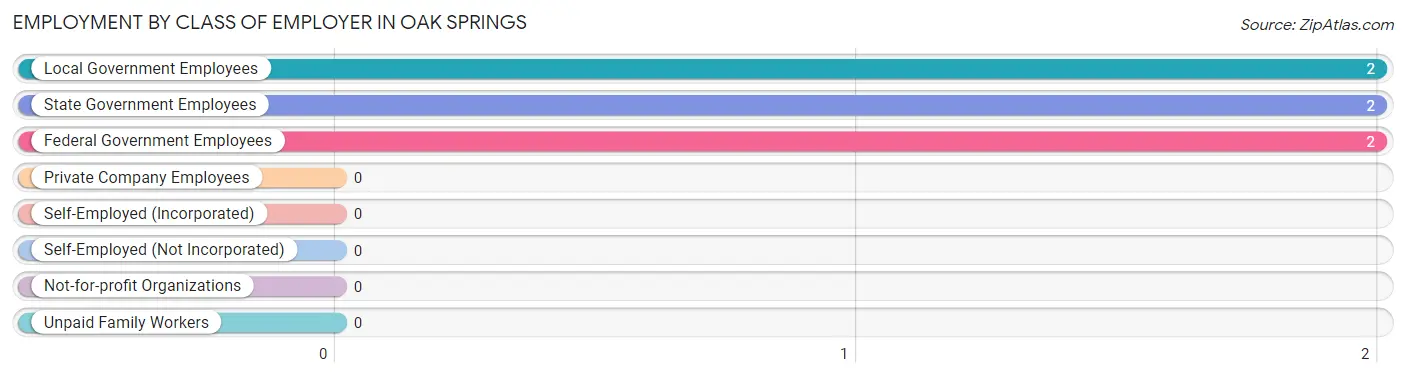
| Employer Class | # Employees | % Employees |
| Private Company Employees | 0 | 0.0% |
| Self-Employed (Incorporated) | 0 | 0.0% |
| Self-Employed (Not Incorporated) | 0 | 0.0% |
| Not-for-profit Organizations | 0 | 0.0% |
| Local Government Employees | 2 | 33.3% |
| State Government Employees | 2 | 33.3% |
| Federal Government Employees | 2 | 33.3% |
| Unpaid Family Workers | 0 | 0.0% |
| Total | 6 | 100.0% |
Employment Status by Age in Oak Springs
According to the labor force statistics for Oak Springs, out of the total population over 16 years of age (28), 25.0% or 7 individuals are in the labor force, with 14.3% or 1 of them unemployed. The age group with the highest labor force participation rate is 45 to 54 years, with 100.0% or 6 individuals in the labor force. Within the labor force, the 45 to 54 years age range has the highest percentage of unemployed individuals, with 16.7% or 1 of them being unemployed.
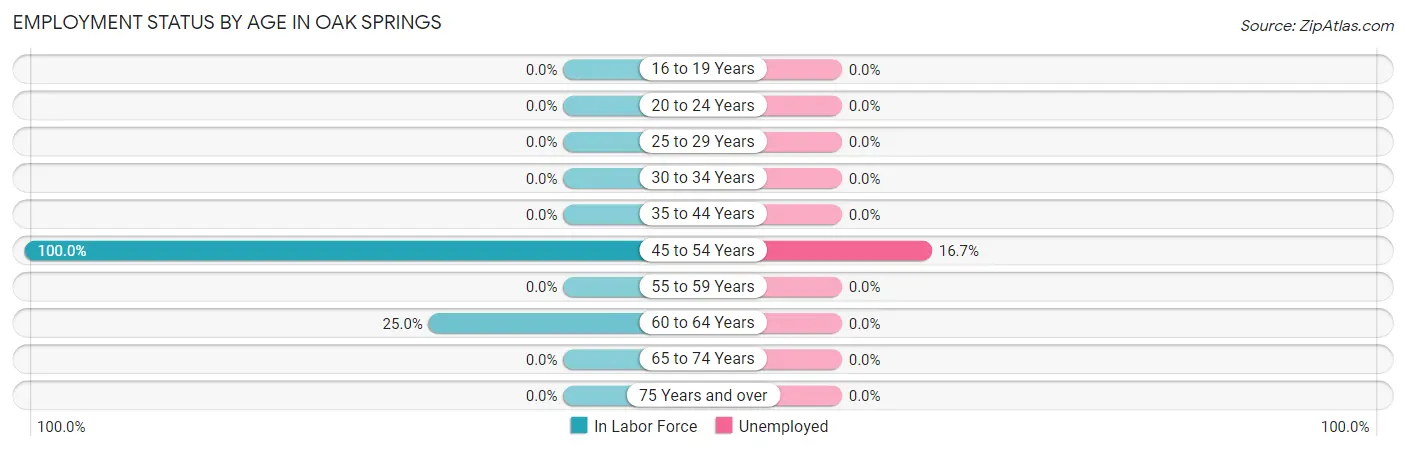
| Age Bracket | In Labor Force | Unemployed |
| 16 to 19 Years | 0 (0.0%) | 0 (0.0%) |
| 20 to 24 Years | 0 (0.0%) | 0 (0.0%) |
| 25 to 29 Years | 0 (0.0%) | 0 (0.0%) |
| 30 to 34 Years | 0 (0.0%) | 0 (0.0%) |
| 35 to 44 Years | 0 (0.0%) | 0 (0.0%) |
| 45 to 54 Years | 6 (100.0%) | 1 (16.7%) |
| 55 to 59 Years | 0 (0.0%) | 0 (0.0%) |
| 60 to 64 Years | 1 (25.0%) | 0 (0.0%) |
| 65 to 74 Years | 0 (0.0%) | 0 (0.0%) |
| 75 Years and over | 0 (0.0%) | 0 (0.0%) |
| Total | 7 (25.0%) | 1 (14.3%) |
Employment Status by Educational Attainment in Oak Springs
According to labor force statistics for Oak Springs, 53.8% of individuals (7) out of the total population between 25 and 64 years of age (13) are in the labor force, with 14.3% or 1 of them being unemployed. The group with the highest labor force participation rate are those with the educational attainment of college / associate degree, with 100.0% or 2 individuals in the labor force. Within the labor force, individuals with high school diploma education have the highest percentage of unemployment, with 20.0% or 1 of them being unemployed.
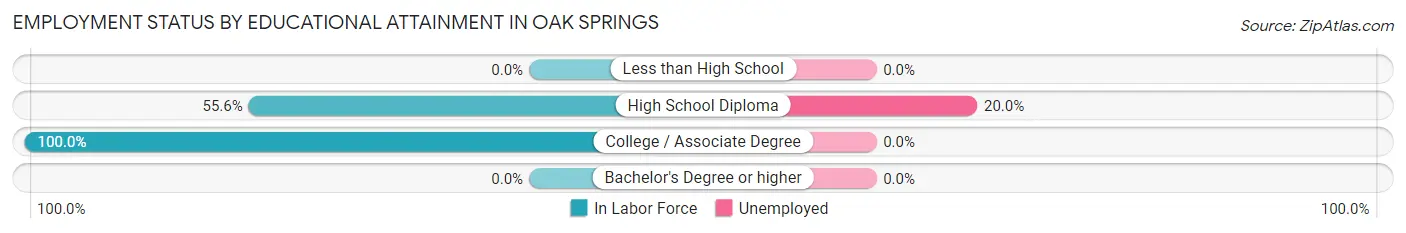
| Educational Attainment | In Labor Force | Unemployed |
| Less than High School | 0 (0.0%) | 0 (0.0%) |
| High School Diploma | 5 (55.6%) | 2 (20.0%) |
| College / Associate Degree | 2 (100.0%) | 0 (0.0%) |
| Bachelor's Degree or higher | 0 (0.0%) | 0 (0.0%) |
| Total | 7 (53.8%) | 2 (14.3%) |
Employment Occupations by Sex in Oak Springs
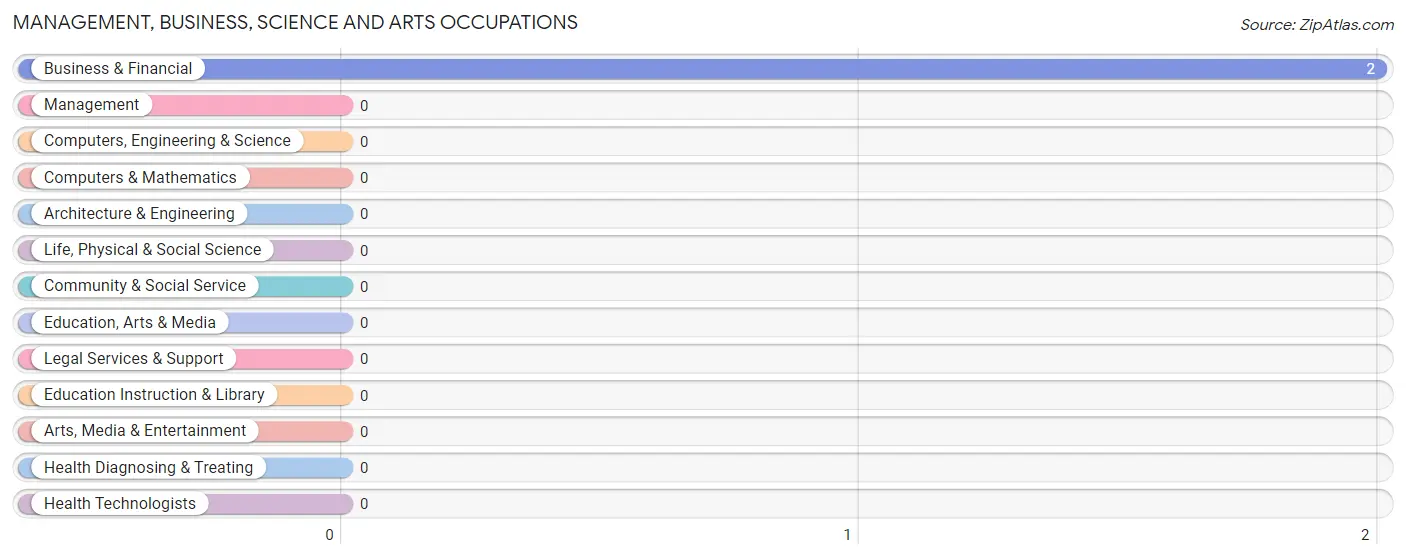
Management, Business, Science and Arts Occupations
The most common Management, Business, Science and Arts occupations in Oak Springs are , and Business & Financial (2 | 33.3%).
Management, Business, Science and Arts Occupations by Sex
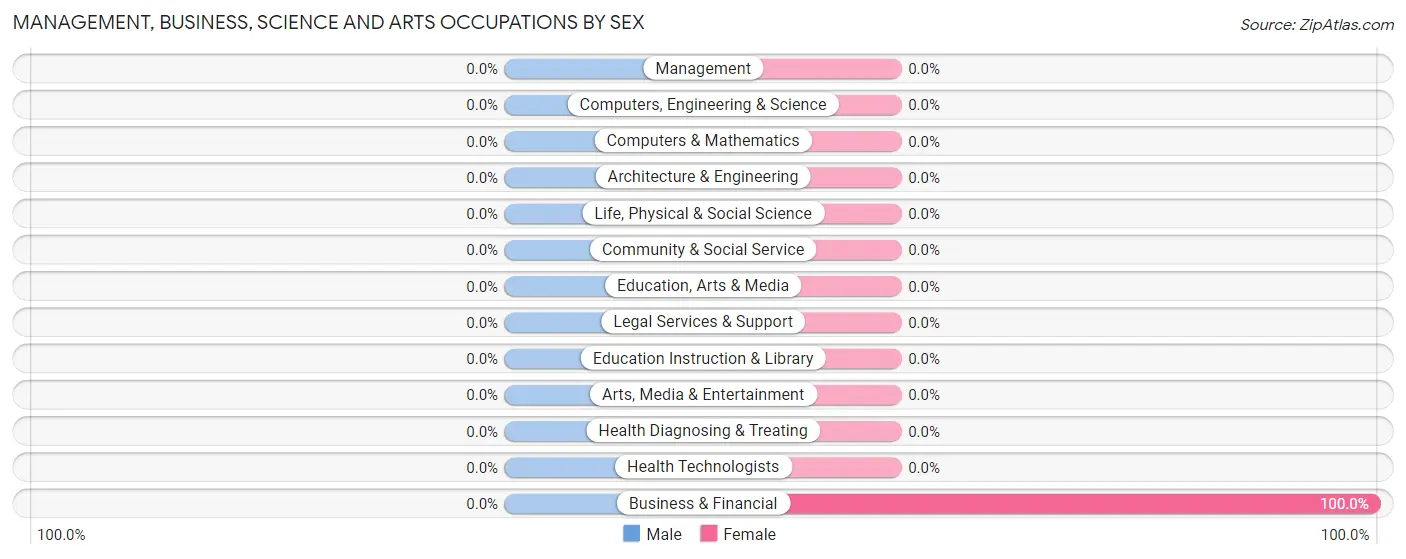
| Occupation | Male | Female |
| Management | 0 (0.0%) | 0 (0.0%) |
| Business & Financial | 0 (0.0%) | 2 (100.0%) |
| Computers, Engineering & Science | 0 (0.0%) | 0 (0.0%) |
| Computers & Mathematics | 0 (0.0%) | 0 (0.0%) |
| Architecture & Engineering | 0 (0.0%) | 0 (0.0%) |
| Life, Physical & Social Science | 0 (0.0%) | 0 (0.0%) |
| Community & Social Service | 0 (0.0%) | 0 (0.0%) |
| Education, Arts & Media | 0 (0.0%) | 0 (0.0%) |
| Legal Services & Support | 0 (0.0%) | 0 (0.0%) |
| Education Instruction & Library | 0 (0.0%) | 0 (0.0%) |
| Arts, Media & Entertainment | 0 (0.0%) | 0 (0.0%) |
| Health Diagnosing & Treating | 0 (0.0%) | 0 (0.0%) |
| Health Technologists | 0 (0.0%) | 0 (0.0%) |
| Total (Category) | 0 (0.0%) | 2 (100.0%) |
| Total (Overall) | 2 (33.3%) | 4 (66.7%) |
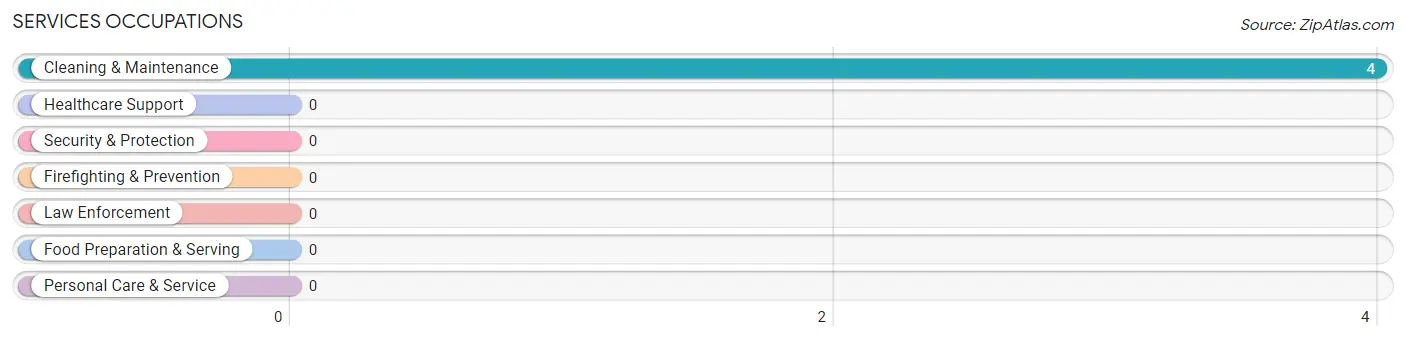
Services Occupations
The most common Services occupations in Oak Springs are , and Cleaning & Maintenance (4 | 66.7%).
Services Occupations by Sex
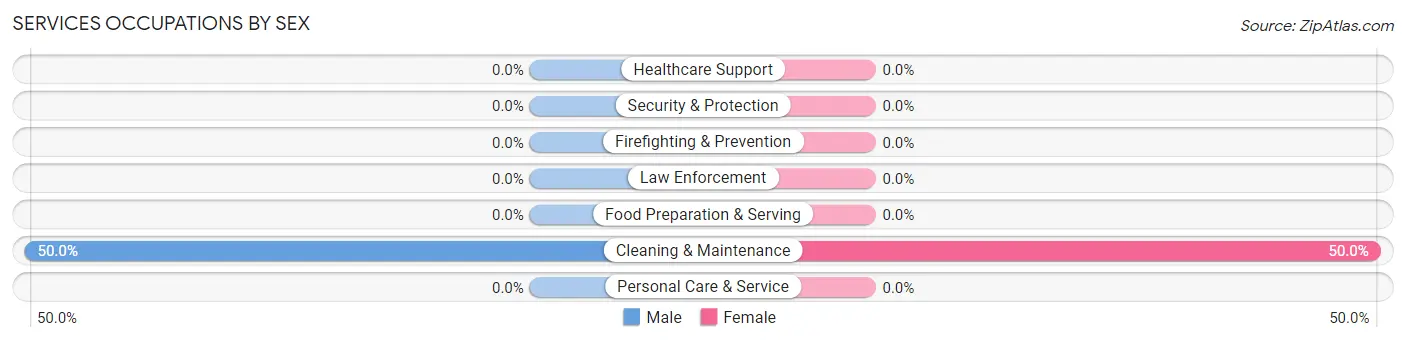
| Occupation | Male | Female |
| Healthcare Support | 0 (0.0%) | 0 (0.0%) |
| Security & Protection | 0 (0.0%) | 0 (0.0%) |
| Firefighting & Prevention | 0 (0.0%) | 0 (0.0%) |
| Law Enforcement | 0 (0.0%) | 0 (0.0%) |
| Food Preparation & Serving | 0 (0.0%) | 0 (0.0%) |
| Cleaning & Maintenance | 2 (50.0%) | 2 (50.0%) |
| Personal Care & Service | 0 (0.0%) | 0 (0.0%) |
| Total (Category) | 2 (50.0%) | 2 (50.0%) |
| Total (Overall) | 2 (33.3%) | 4 (66.7%) |
Sales and Office Occupations
Sales and Office Occupations by Sex
| Occupation | Male | Female |
| Sales & Related | 0 (0.0%) | 0 (0.0%) |
| Office & Administration | 0 (0.0%) | 0 (0.0%) |
| Total (Category) | 0 (0.0%) | 0 (0.0%) |
| Total (Overall) | 2 (33.3%) | 4 (66.7%) |
Natural Resources, Construction and Maintenance Occupations
Natural Resources, Construction and Maintenance Occupations by Sex
| Occupation | Male | Female |
| Farming, Fishing & Forestry | 0 (0.0%) | 0 (0.0%) |
| Construction & Extraction | 0 (0.0%) | 0 (0.0%) |
| Installation, Maintenance & Repair | 0 (0.0%) | 0 (0.0%) |
| Total (Category) | 0 (0.0%) | 0 (0.0%) |
| Total (Overall) | 2 (33.3%) | 4 (66.7%) |
Production, Transportation and Moving Occupations
Production, Transportation and Moving Occupations by Sex
| Occupation | Male | Female |
| Production | 0 (0.0%) | 0 (0.0%) |
| Transportation | 0 (0.0%) | 0 (0.0%) |
| Material Moving | 0 (0.0%) | 0 (0.0%) |
| Total (Category) | 0 (0.0%) | 0 (0.0%) |
| Total (Overall) | 2 (33.3%) | 4 (66.7%) |
Employment Industries by Sex in Oak Springs
Employment Industries in Oak Springs
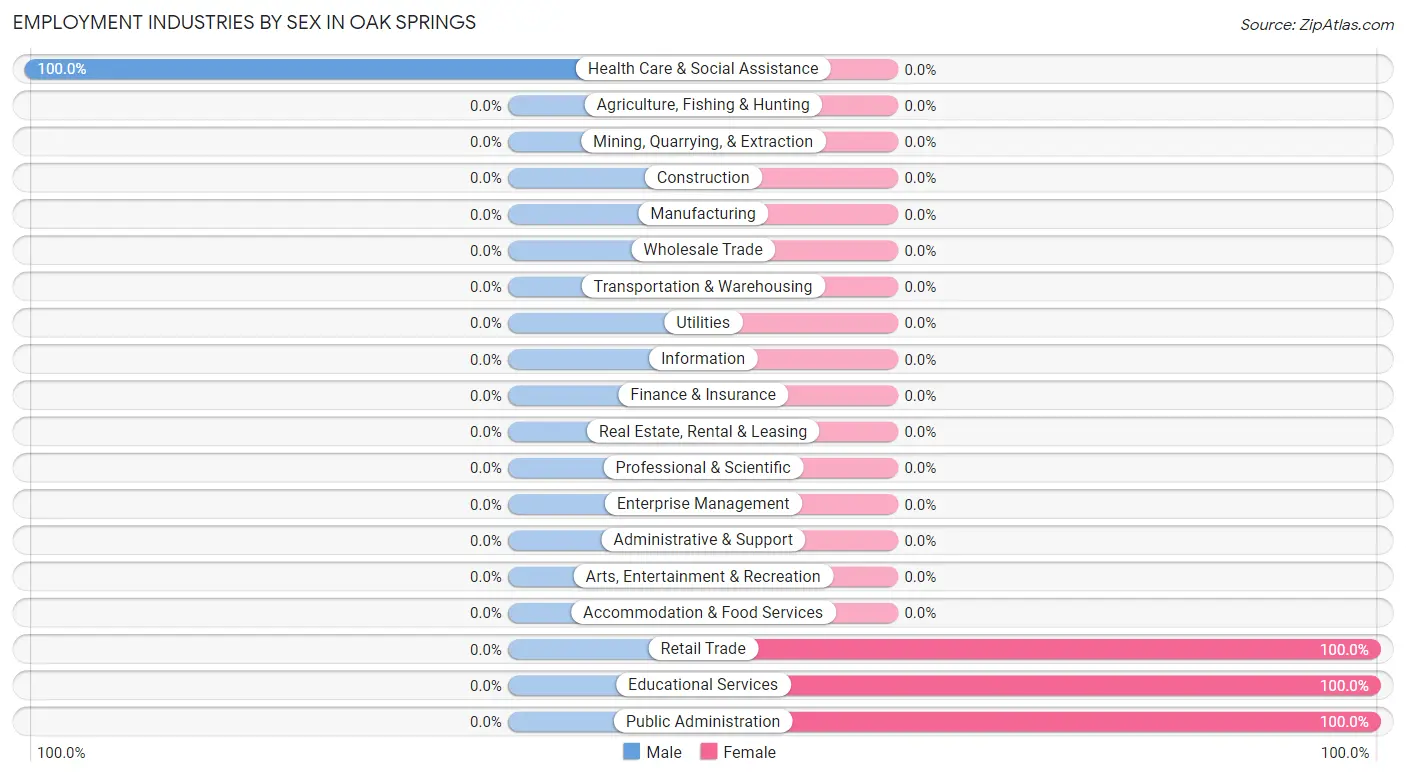
The major employment industries in Oak Springs include Educational Services (2 | 33.3%), Health Care & Social Assistance (2 | 33.3%), Retail Trade (1 | 16.7%), and Public Administration (1 | 16.7%).
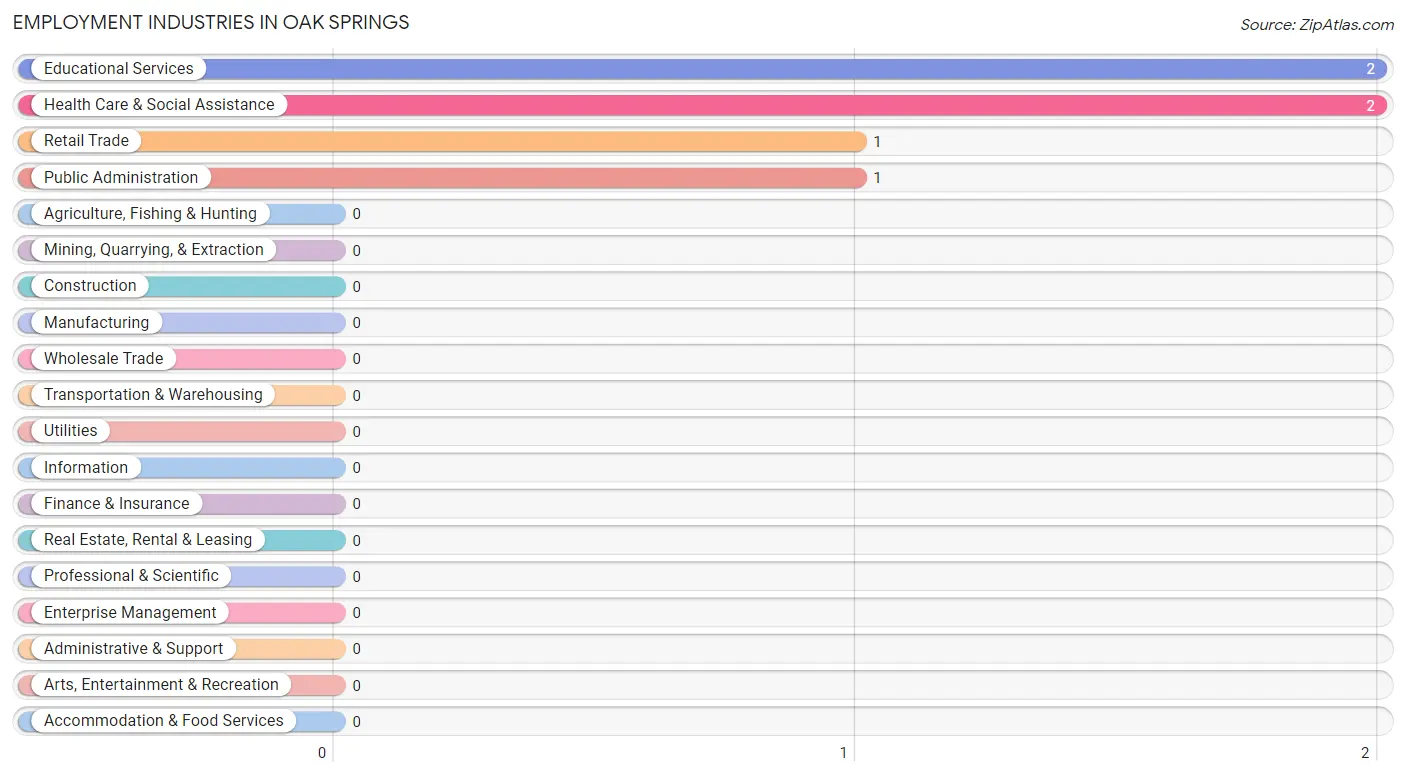
Employment Industries by Sex in Oak Springs
| Industry | Male | Female |
| Agriculture, Fishing & Hunting | 0 (0.0%) | 0 (0.0%) |
| Mining, Quarrying, & Extraction | 0 (0.0%) | 0 (0.0%) |
| Construction | 0 (0.0%) | 0 (0.0%) |
| Manufacturing | 0 (0.0%) | 0 (0.0%) |
| Wholesale Trade | 0 (0.0%) | 0 (0.0%) |
| Retail Trade | 0 (0.0%) | 1 (100.0%) |
| Transportation & Warehousing | 0 (0.0%) | 0 (0.0%) |
| Utilities | 0 (0.0%) | 0 (0.0%) |
| Information | 0 (0.0%) | 0 (0.0%) |
| Finance & Insurance | 0 (0.0%) | 0 (0.0%) |
| Real Estate, Rental & Leasing | 0 (0.0%) | 0 (0.0%) |
| Professional & Scientific | 0 (0.0%) | 0 (0.0%) |
| Enterprise Management | 0 (0.0%) | 0 (0.0%) |
| Administrative & Support | 0 (0.0%) | 0 (0.0%) |
| Educational Services | 0 (0.0%) | 2 (100.0%) |
| Health Care & Social Assistance | 2 (100.0%) | 0 (0.0%) |
| Arts, Entertainment & Recreation | 0 (0.0%) | 0 (0.0%) |
| Accommodation & Food Services | 0 (0.0%) | 0 (0.0%) |
| Public Administration | 0 (0.0%) | 1 (100.0%) |
| Total | 2 (33.3%) | 4 (66.7%) |
Education in Oak Springs
School Enrollment in Oak Springs
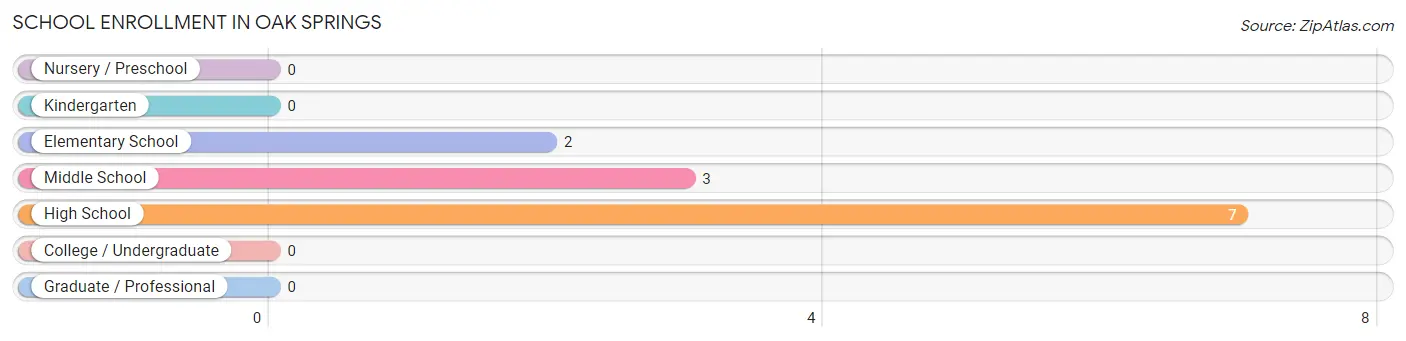
The most common levels of schooling among the 12 students in Oak Springs are high school (7 | 58.3%), middle school (3 | 25.0%), and elementary school (2 | 16.7%).
| School Level | # Students | % Students |
| Nursery / Preschool | 0 | 0.0% |
| Kindergarten | 0 | 0.0% |
| Elementary School | 2 | 16.7% |
| Middle School | 3 | 25.0% |
| High School | 7 | 58.3% |
| College / Undergraduate | 0 | 0.0% |
| Graduate / Professional | 0 | 0.0% |
| Total | 12 | 100.0% |
School Enrollment by Age by Funding Source in Oak Springs
| Age Bracket | Public School | Private School |
| 3 to 4 Year Olds | 0 (0.0%) | 0 (0.0%) |
| 5 to 9 Year Old | 0 (0.0%) | 0 (0.0%) |
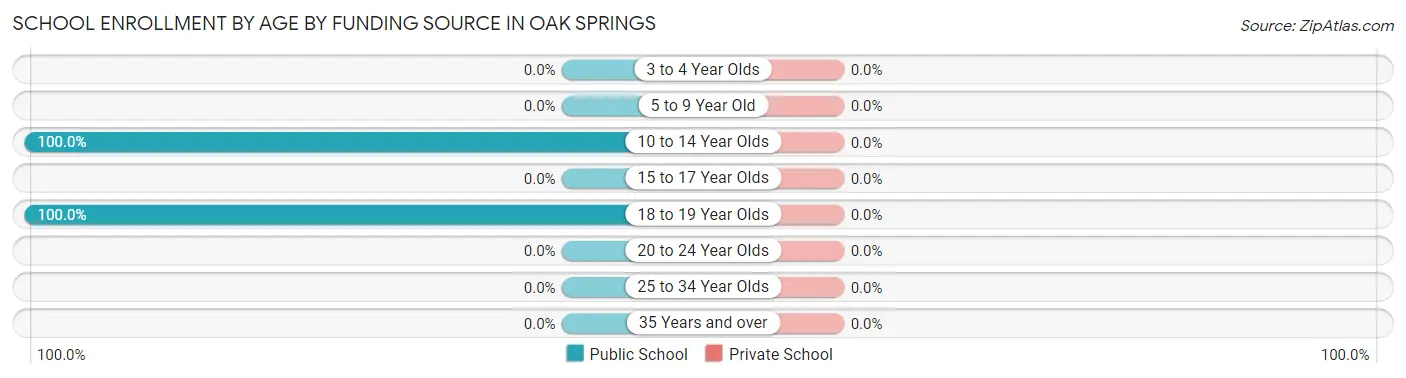
| 10 to 14 Year Olds | 5 (100.0%) | 0 (0.0%) |
| 15 to 17 Year Olds | 0 (0.0%) | 0 (0.0%) |
| 18 to 19 Year Olds | 7 (100.0%) | 0 (0.0%) |
| 20 to 24 Year Olds | 0 (0.0%) | 0 (0.0%) |
| 25 to 34 Year Olds | 0 (0.0%) | 0 (0.0%) |
| 35 Years and over | 0 (0.0%) | 0 (0.0%) |
| Total | 12 (100.0%) | 0 (0.0%) |
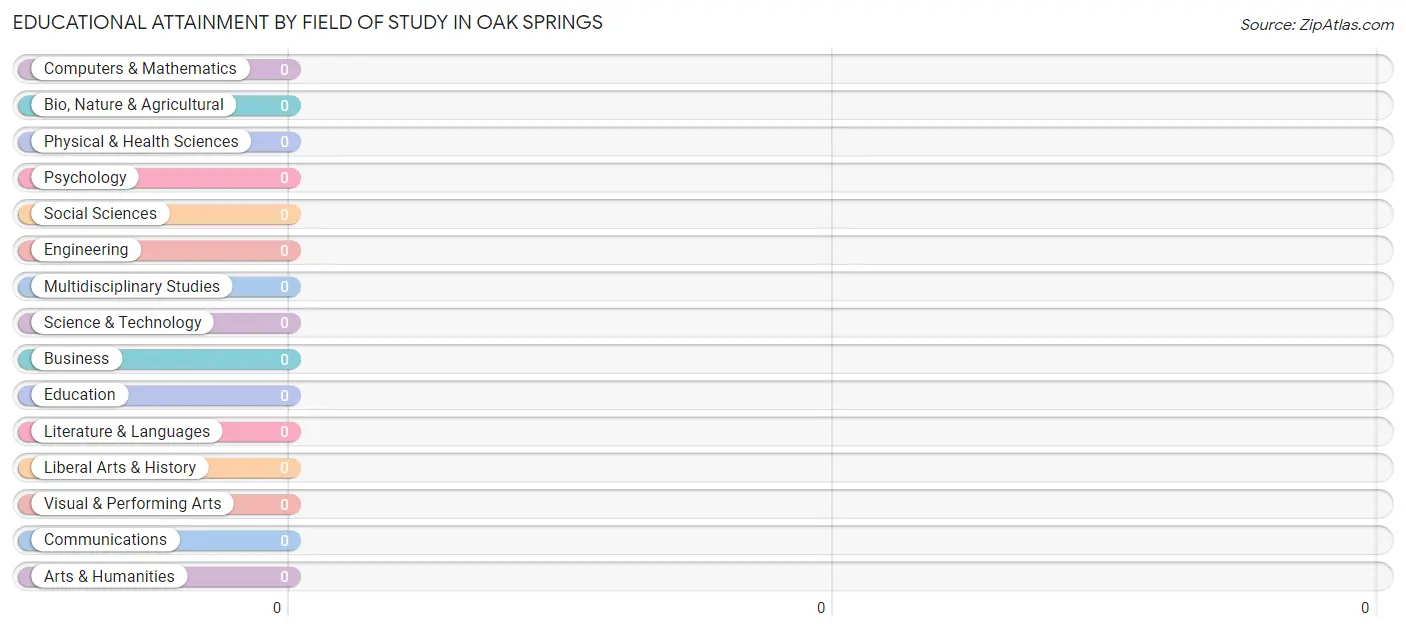
Educational Attainment by Field of Study in Oak Springs
| Field of Study | # Graduates | % Graduates |
| Computers & Mathematics | 0 | 0.0% |
| Bio, Nature & Agricultural | 0 | 0.0% |
| Physical & Health Sciences | 0 | 0.0% |
| Psychology | 0 | 0.0% |
| Social Sciences | 0 | 0.0% |
| Engineering | 0 | 0.0% |
| Multidisciplinary Studies | 0 | 0.0% |
| Science & Technology | 0 | 0.0% |
| Business | 0 | 0.0% |
| Education | 0 | 0.0% |
| Literature & Languages | 0 | 0.0% |
| Liberal Arts & History | 0 | 0.0% |
| Visual & Performing Arts | 0 | 0.0% |
| Communications | 0 | 0.0% |
| Arts & Humanities | 0 | 0.0% |
| Total | 0 | 0.0% |
Transportation & Commute in Oak Springs
Vehicle Availability by Sex in Oak Springs
The most prevalent vehicle ownership categories in Oak Springs are males with 2 vehicles (2, accounting for 100.0%) and females with 2 vehicles (3, making up 50.0%).
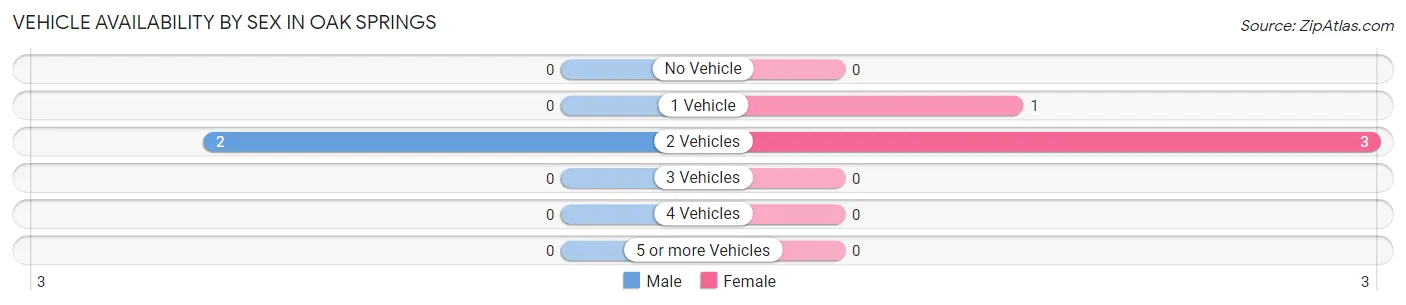
| Vehicles Available | Male | Female |
| No Vehicle | 0 (0.0%) | 0 (0.0%) |
| 1 Vehicle | 0 (0.0%) | 1 (25.0%) |
| 2 Vehicles | 2 (100.0%) | 3 (75.0%) |
| 3 Vehicles | 0 (0.0%) | 0 (0.0%) |
| 4 Vehicles | 0 (0.0%) | 0 (0.0%) |
| 5 or more Vehicles | 0 (0.0%) | 0 (0.0%) |
| Total | 2 (100.0%) | 4 (100.0%) |
Commute Time in Oak Springs
The most frequently occuring commute durations in Oak Springs are 35 to 39 minutes (4 commuters, 66.7%), 30 to 34 minutes (2 commuters, 33.3%), and less than 5 minutes (0 commuters, 0.0%).
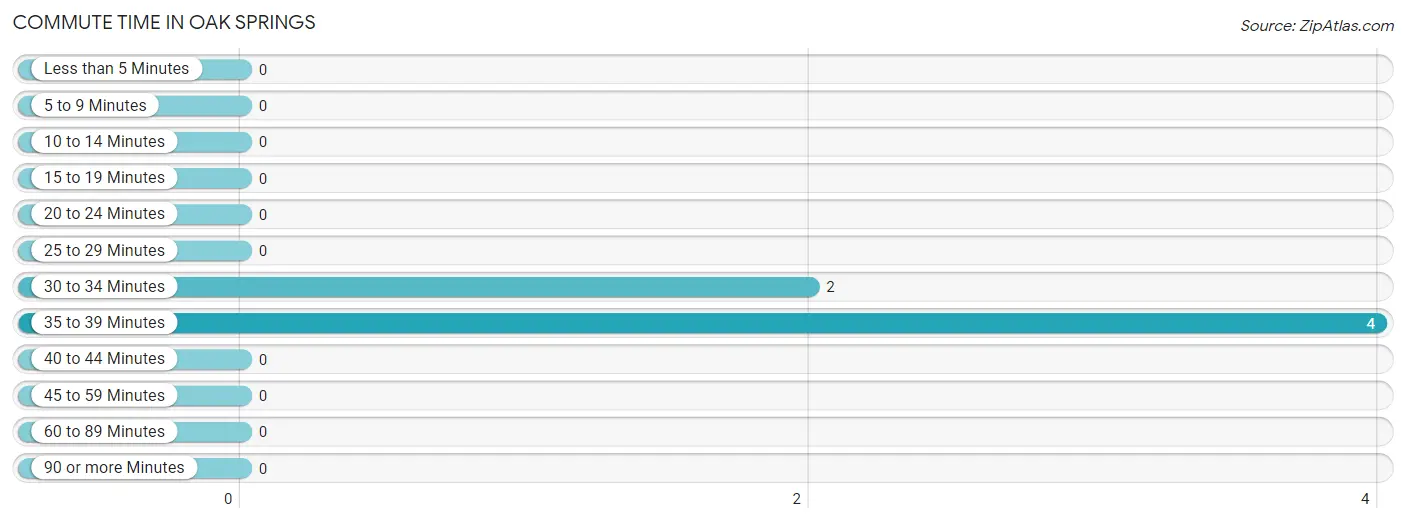
| Commute Time | # Commuters | % Commuters |
| Less than 5 Minutes | 0 | 0.0% |
| 5 to 9 Minutes | 0 | 0.0% |
| 10 to 14 Minutes | 0 | 0.0% |
| 15 to 19 Minutes | 0 | 0.0% |
| 20 to 24 Minutes | 0 | 0.0% |
| 25 to 29 Minutes | 0 | 0.0% |
| 30 to 34 Minutes | 2 | 33.3% |
| 35 to 39 Minutes | 4 | 66.7% |
| 40 to 44 Minutes | 0 | 0.0% |
| 45 to 59 Minutes | 0 | 0.0% |
| 60 to 89 Minutes | 0 | 0.0% |
| 90 or more Minutes | 0 | 0.0% |
Commute Time by Sex in Oak Springs
The most common commute times in Oak Springs are 35 to 39 minutes (2 commuters, 100.0%) for males and 30 to 34 minutes (2 commuters, 50.0%) for females.
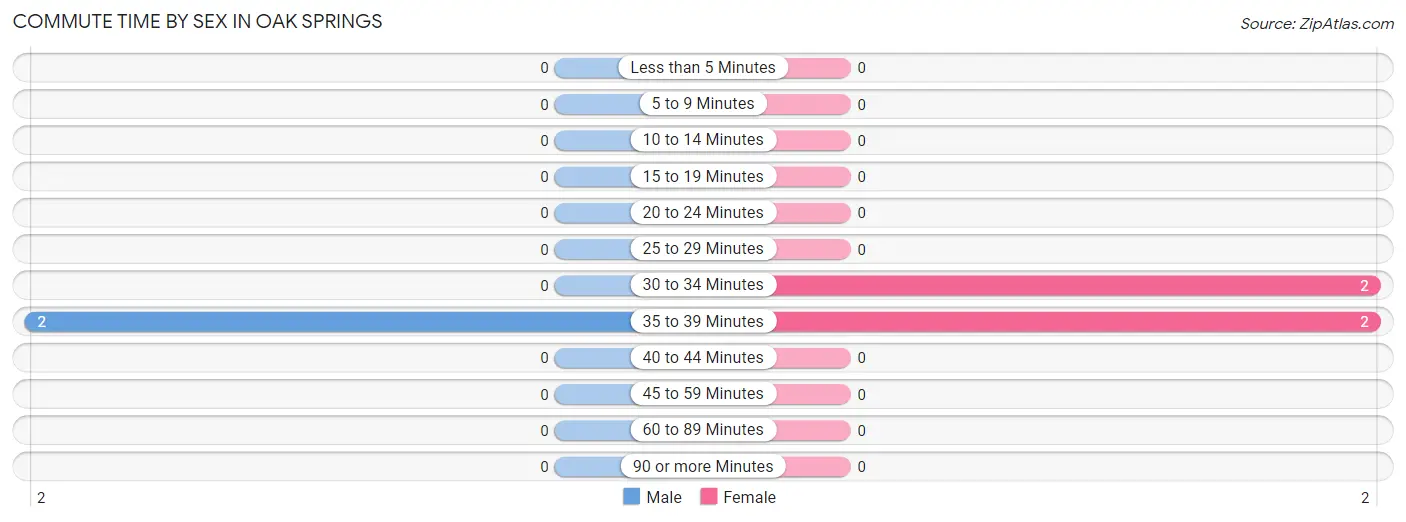
| Commute Time | Male | Female |
| Less than 5 Minutes | 0 (0.0%) | 0 (0.0%) |
| 5 to 9 Minutes | 0 (0.0%) | 0 (0.0%) |
| 10 to 14 Minutes | 0 (0.0%) | 0 (0.0%) |
| 15 to 19 Minutes | 0 (0.0%) | 0 (0.0%) |
| 20 to 24 Minutes | 0 (0.0%) | 0 (0.0%) |
| 25 to 29 Minutes | 0 (0.0%) | 0 (0.0%) |
| 30 to 34 Minutes | 0 (0.0%) | 2 (50.0%) |
| 35 to 39 Minutes | 2 (100.0%) | 2 (50.0%) |
| 40 to 44 Minutes | 0 (0.0%) | 0 (0.0%) |
| 45 to 59 Minutes | 0 (0.0%) | 0 (0.0%) |
| 60 to 89 Minutes | 0 (0.0%) | 0 (0.0%) |
| 90 or more Minutes | 0 (0.0%) | 0 (0.0%) |
Time of Departure to Work by Sex in Oak Springs
The most frequent times of departure to work in Oak Springs are 7:00 AM to 7:29 AM (2, 100.0%) for males and 6:00 AM to 6:29 AM (2, 50.0%) for females.
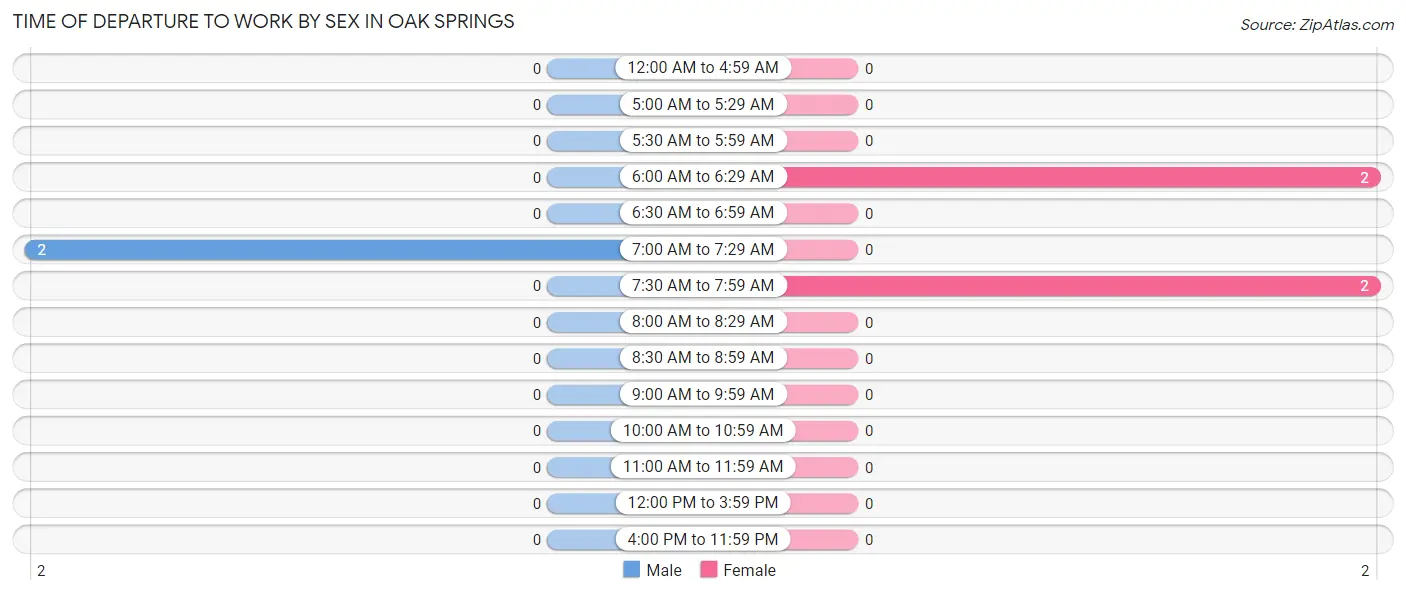
| Time of Departure | Male | Female |
| 12:00 AM to 4:59 AM | 0 (0.0%) | 0 (0.0%) |
| 5:00 AM to 5:29 AM | 0 (0.0%) | 0 (0.0%) |
| 5:30 AM to 5:59 AM | 0 (0.0%) | 0 (0.0%) |
| 6:00 AM to 6:29 AM | 0 (0.0%) | 2 (50.0%) |
| 6:30 AM to 6:59 AM | 0 (0.0%) | 0 (0.0%) |
| 7:00 AM to 7:29 AM | 2 (100.0%) | 0 (0.0%) |
| 7:30 AM to 7:59 AM | 0 (0.0%) | 2 (50.0%) |
| 8:00 AM to 8:29 AM | 0 (0.0%) | 0 (0.0%) |
| 8:30 AM to 8:59 AM | 0 (0.0%) | 0 (0.0%) |
| 9:00 AM to 9:59 AM | 0 (0.0%) | 0 (0.0%) |
| 10:00 AM to 10:59 AM | 0 (0.0%) | 0 (0.0%) |
| 11:00 AM to 11:59 AM | 0 (0.0%) | 0 (0.0%) |
| 12:00 PM to 3:59 PM | 0 (0.0%) | 0 (0.0%) |
| 4:00 PM to 11:59 PM | 0 (0.0%) | 0 (0.0%) |
| Total | 2 (100.0%) | 4 (100.0%) |
Housing Occupancy in Oak Springs
Occupancy by Ownership in Oak Springs
Of the total 8 dwellings in Oak Springs, owner-occupied units account for 8 (100.0%), while renter-occupied units make up 0 (0.0%).
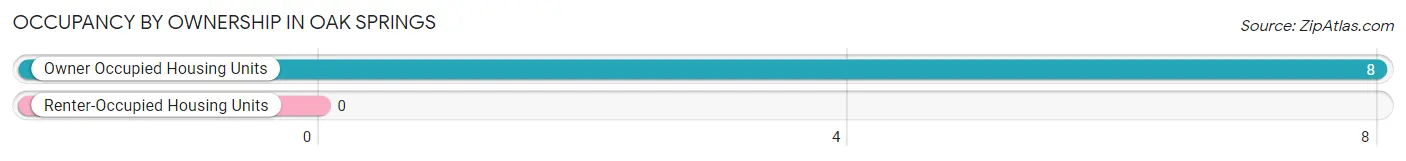
| Occupancy | # Housing Units | % Housing Units |
| Owner Occupied Housing Units | 8 | 100.0% |
| Renter-Occupied Housing Units | 0 | 0.0% |
| Total Occupied Housing Units | 8 | 100.0% |
Occupancy by Household Size in Oak Springs
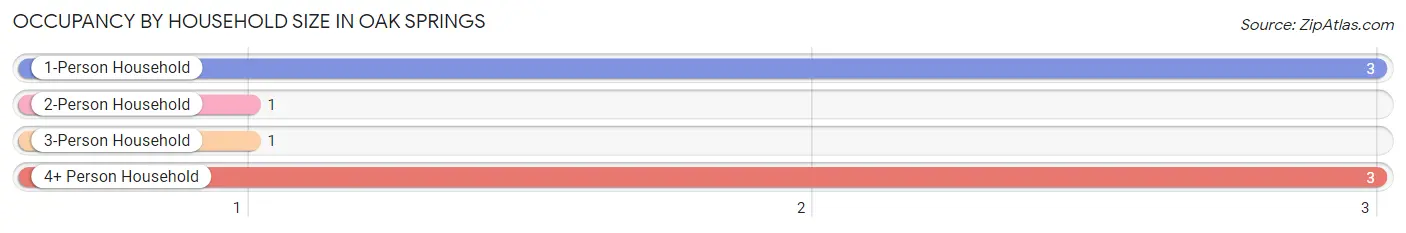
| Household Size | # Housing Units | % Housing Units |
| 1-Person Household | 3 | 37.5% |
| 2-Person Household | 1 | 12.5% |
| 3-Person Household | 1 | 12.5% |
| 4+ Person Household | 3 | 37.5% |
| Total Housing Units | 8 | 100.0% |
Occupancy by Ownership by Household Size in Oak Springs
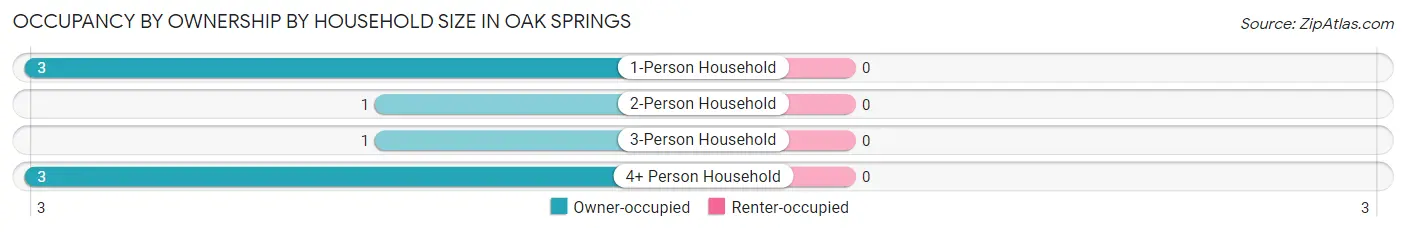
| Household Size | Owner-occupied | Renter-occupied |
| 1-Person Household | 3 (100.0%) | 0 (0.0%) |
| 2-Person Household | 1 (100.0%) | 0 (0.0%) |
| 3-Person Household | 1 (100.0%) | 0 (0.0%) |
| 4+ Person Household | 3 (100.0%) | 0 (0.0%) |
| Total Housing Units | 8 (100.0%) | 0 (0.0%) |
Occupancy by Educational Attainment in Oak Springs
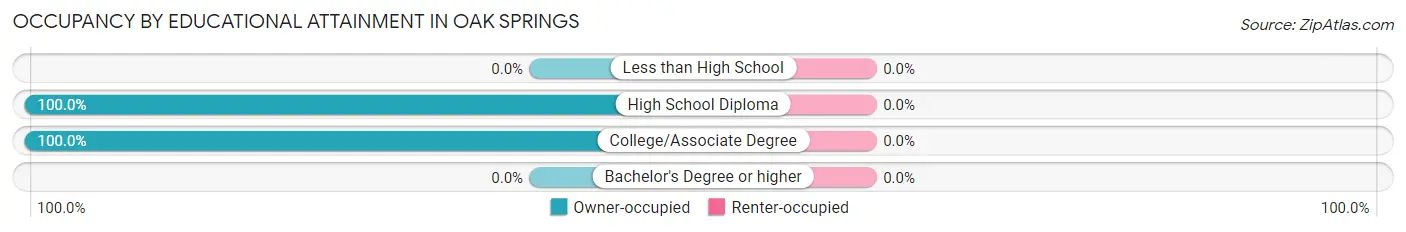
| Household Size | Owner-occupied | Renter-occupied |
| Less than High School | 0 (0.0%) | 0 (0.0%) |
| High School Diploma | 3 (100.0%) | 0 (0.0%) |
| College/Associate Degree | 5 (100.0%) | 0 (0.0%) |
| Bachelor's Degree or higher | 0 (0.0%) | 0 (0.0%) |
Occupancy by Age of Householder in Oak Springs
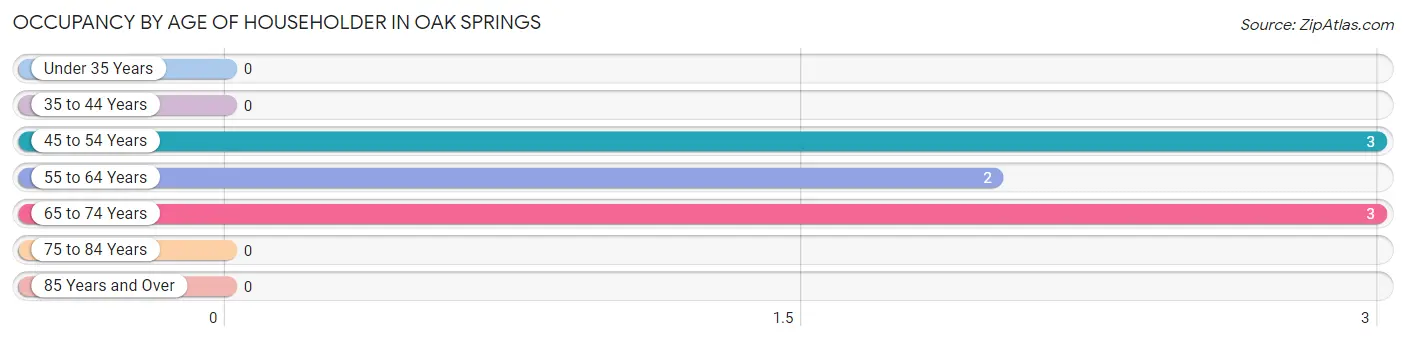
| Age Bracket | # Households | % Households |
| Under 35 Years | 0 | 0.0% |
| 35 to 44 Years | 0 | 0.0% |
| 45 to 54 Years | 3 | 37.5% |
| 55 to 64 Years | 2 | 25.0% |
| 65 to 74 Years | 3 | 37.5% |
| 75 to 84 Years | 0 | 0.0% |
| 85 Years and Over | 0 | 0.0% |
| Total | 8 | 100.0% |
Housing Finances in Oak Springs
Median Income by Occupancy in Oak Springs
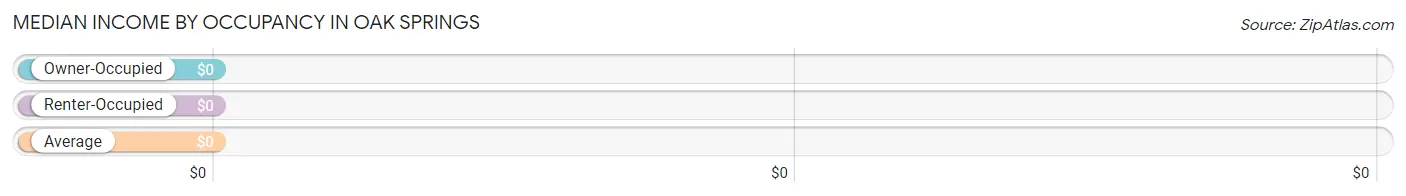
| Occupancy Type | # Households | Median Income |
| Owner-Occupied | 8 (100.0%) | $0 |
| Renter-Occupied | 0 (0.0%) | $0 |
| Average | 8 (100.0%) | $0 |
Occupancy by Householder Income Bracket in Oak Springs
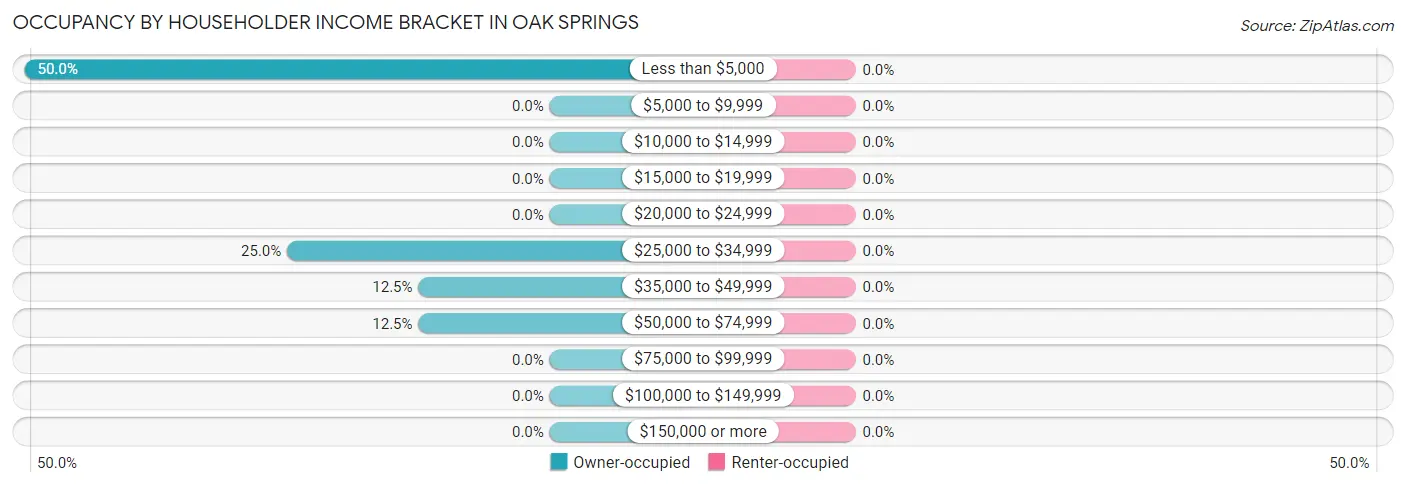
| Income Bracket | Owner-occupied | Renter-occupied |
| Less than $5,000 | 4 (50.0%) | 0 (0.0%) |
| $5,000 to $9,999 | 0 (0.0%) | 0 (0.0%) |
| $10,000 to $14,999 | 0 (0.0%) | 0 (0.0%) |
| $15,000 to $19,999 | 0 (0.0%) | 0 (0.0%) |
| $20,000 to $24,999 | 0 (0.0%) | 0 (0.0%) |
| $25,000 to $34,999 | 2 (25.0%) | 0 (0.0%) |
| $35,000 to $49,999 | 1 (12.5%) | 0 (0.0%) |
| $50,000 to $74,999 | 1 (12.5%) | 0 (0.0%) |
| $75,000 to $99,999 | 0 (0.0%) | 0 (0.0%) |
| $100,000 to $149,999 | 0 (0.0%) | 0 (0.0%) |
| $150,000 or more | 0 (0.0%) | 0 (0.0%) |
| Total | 8 (100.0%) | 0 (0.0%) |
Monthly Housing Cost Tiers in Oak Springs
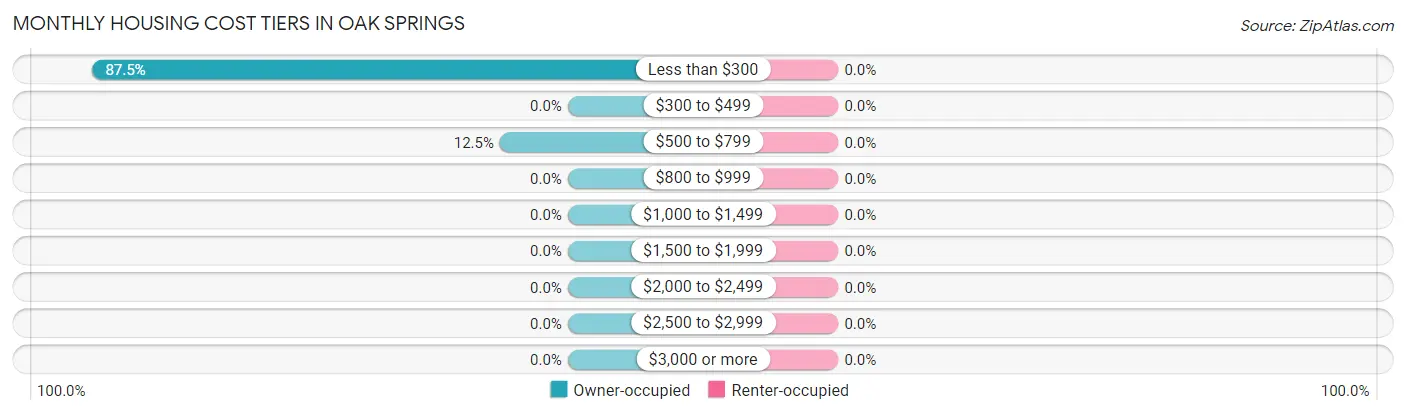
| Monthly Cost | Owner-occupied | Renter-occupied |
| Less than $300 | 7 (87.5%) | 0 (0.0%) |
| $300 to $499 | 0 (0.0%) | 0 (0.0%) |
| $500 to $799 | 1 (12.5%) | 0 (0.0%) |
| $800 to $999 | 0 (0.0%) | 0 (0.0%) |
| $1,000 to $1,499 | 0 (0.0%) | 0 (0.0%) |
| $1,500 to $1,999 | 0 (0.0%) | 0 (0.0%) |
| $2,000 to $2,499 | 0 (0.0%) | 0 (0.0%) |
| $2,500 to $2,999 | 0 (0.0%) | 0 (0.0%) |
| $3,000 or more | 0 (0.0%) | 0 (0.0%) |
| Total | 8 (100.0%) | 0 (0.0%) |
Physical Housing Characteristics in Oak Springs
Housing Structures in Oak Springs
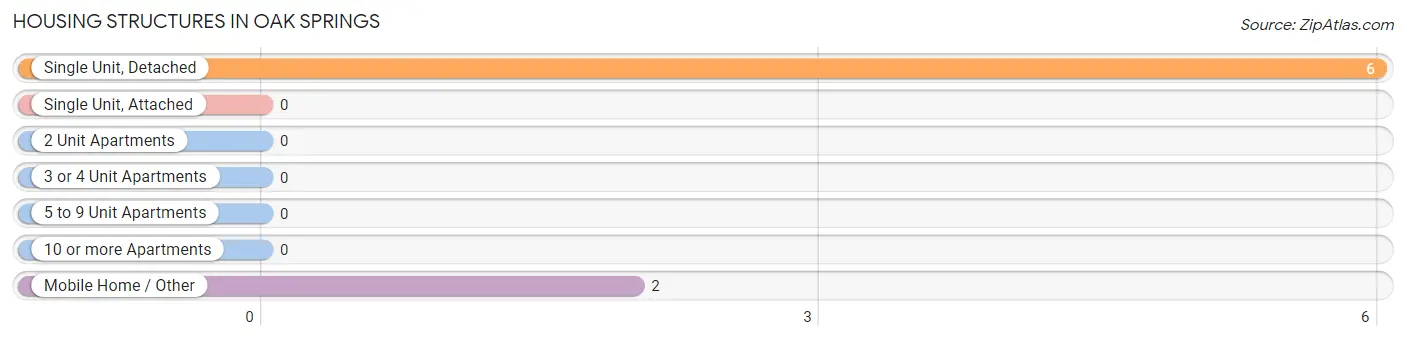
| Structure Type | # Housing Units | % Housing Units |
| Single Unit, Detached | 6 | 75.0% |
| Single Unit, Attached | 0 | 0.0% |
| 2 Unit Apartments | 0 | 0.0% |
| 3 or 4 Unit Apartments | 0 | 0.0% |
| 5 to 9 Unit Apartments | 0 | 0.0% |
| 10 or more Apartments | 0 | 0.0% |
| Mobile Home / Other | 2 | 25.0% |
| Total | 8 | 100.0% |
Housing Structures by Occupancy in Oak Springs
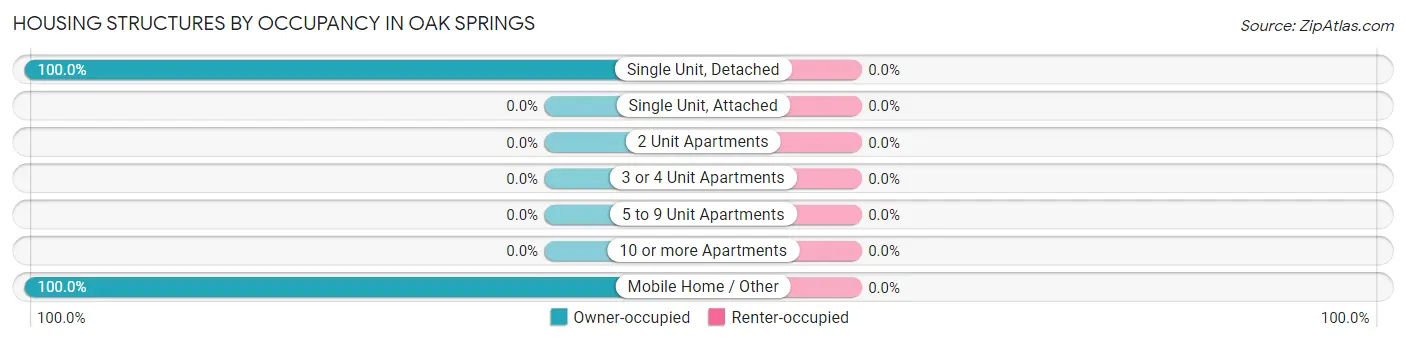
| Structure Type | Owner-occupied | Renter-occupied |
| Single Unit, Detached | 6 (100.0%) | 0 (0.0%) |
| Single Unit, Attached | 0 (0.0%) | 0 (0.0%) |
| 2 Unit Apartments | 0 (0.0%) | 0 (0.0%) |
| 3 or 4 Unit Apartments | 0 (0.0%) | 0 (0.0%) |
| 5 to 9 Unit Apartments | 0 (0.0%) | 0 (0.0%) |
| 10 or more Apartments | 0 (0.0%) | 0 (0.0%) |
| Mobile Home / Other | 2 (100.0%) | 0 (0.0%) |
| Total | 8 (100.0%) | 0 (0.0%) |
Housing Structures by Number of Rooms in Oak Springs
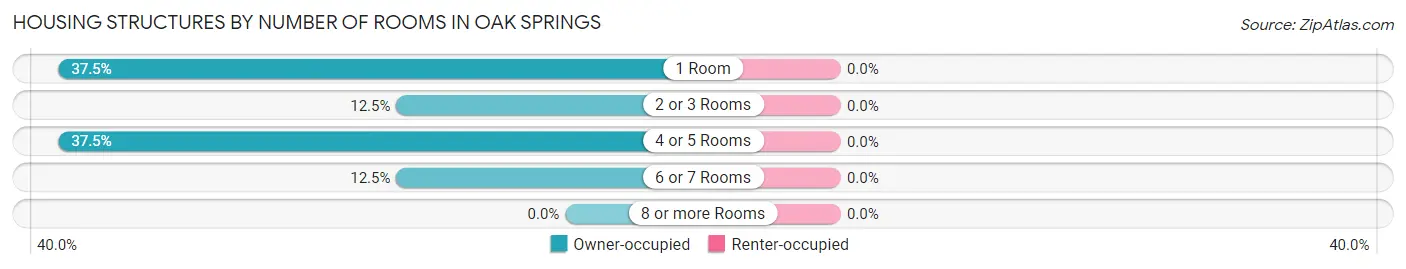
| Number of Rooms | Owner-occupied | Renter-occupied |
| 1 Room | 3 (37.5%) | 0 (0.0%) |
| 2 or 3 Rooms | 1 (12.5%) | 0 (0.0%) |
| 4 or 5 Rooms | 3 (37.5%) | 0 (0.0%) |
| 6 or 7 Rooms | 1 (12.5%) | 0 (0.0%) |
| 8 or more Rooms | 0 (0.0%) | 0 (0.0%) |
| Total | 8 (100.0%) | 0 (0.0%) |
Housing Structure by Heating Type in Oak Springs
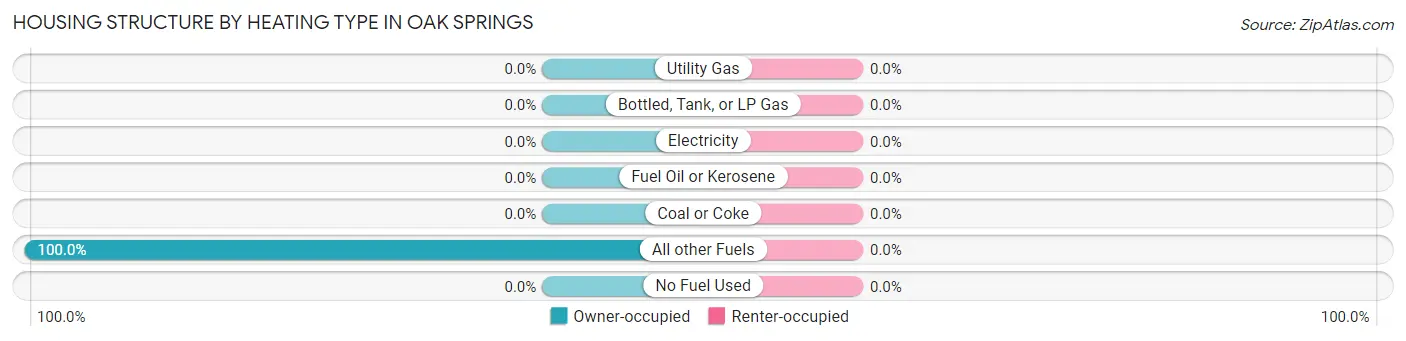
| Heating Type | Owner-occupied | Renter-occupied |
| Utility Gas | 0 (0.0%) | 0 (0.0%) |
| Bottled, Tank, or LP Gas | 0 (0.0%) | 0 (0.0%) |
| Electricity | 0 (0.0%) | 0 (0.0%) |
| Fuel Oil or Kerosene | 0 (0.0%) | 0 (0.0%) |
| Coal or Coke | 0 (0.0%) | 0 (0.0%) |
| All other Fuels | 8 (100.0%) | 0 (0.0%) |
| No Fuel Used | 0 (0.0%) | 0 (0.0%) |
| Total | 8 (100.0%) | 0 (0.0%) |
Household Vehicle Usage in Oak Springs
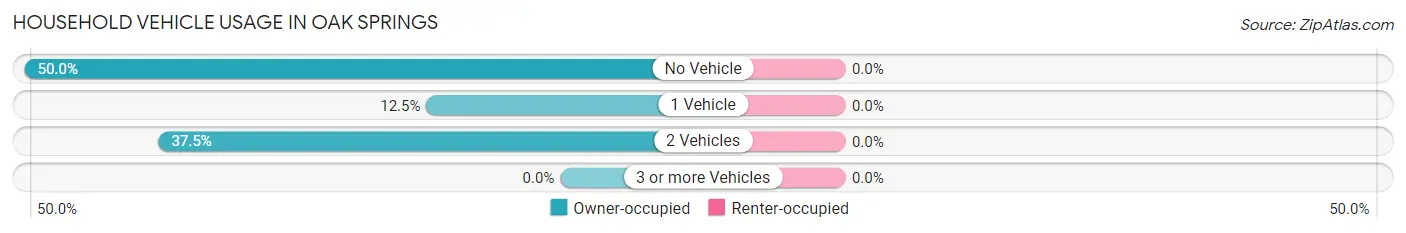
| Vehicles per Household | Owner-occupied | Renter-occupied |
| No Vehicle | 4 (50.0%) | 0 (0.0%) |
| 1 Vehicle | 1 (12.5%) | 0 (0.0%) |
| 2 Vehicles | 3 (37.5%) | 0 (0.0%) |
| 3 or more Vehicles | 0 (0.0%) | 0 (0.0%) |
| Total | 8 (100.0%) | 0 (0.0%) |
Real Estate & Mortgages in Oak Springs
Real Estate and Mortgage Overview in Oak Springs
| Characteristic | Without Mortgage | With Mortgage |
| Housing Units | 8 | 0 |
| Median Property Value | $26,700 | $0 |
| Median Household Income | - | - |
| Monthly Housing Costs | $275 | $0 |
| Real Estate Taxes | - | - |
Property Value by Mortgage Status in Oak Springs
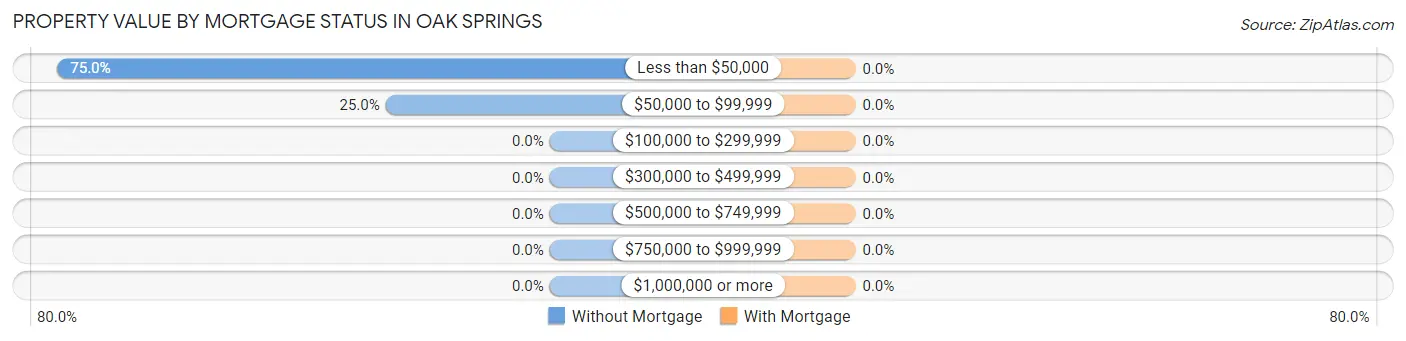
| Property Value | Without Mortgage | With Mortgage |
| Less than $50,000 | 6 (75.0%) | 0 (0.0%) |
| $50,000 to $99,999 | 2 (25.0%) | 0 (0.0%) |
| $100,000 to $299,999 | 0 (0.0%) | 0 (0.0%) |
| $300,000 to $499,999 | 0 (0.0%) | 0 (0.0%) |
| $500,000 to $749,999 | 0 (0.0%) | 0 (0.0%) |
| $750,000 to $999,999 | 0 (0.0%) | 0 (0.0%) |
| $1,000,000 or more | 0 (0.0%) | 0 (0.0%) |
| Total | 8 (100.0%) | 0 (0.0%) |
Household Income by Mortgage Status in Oak Springs
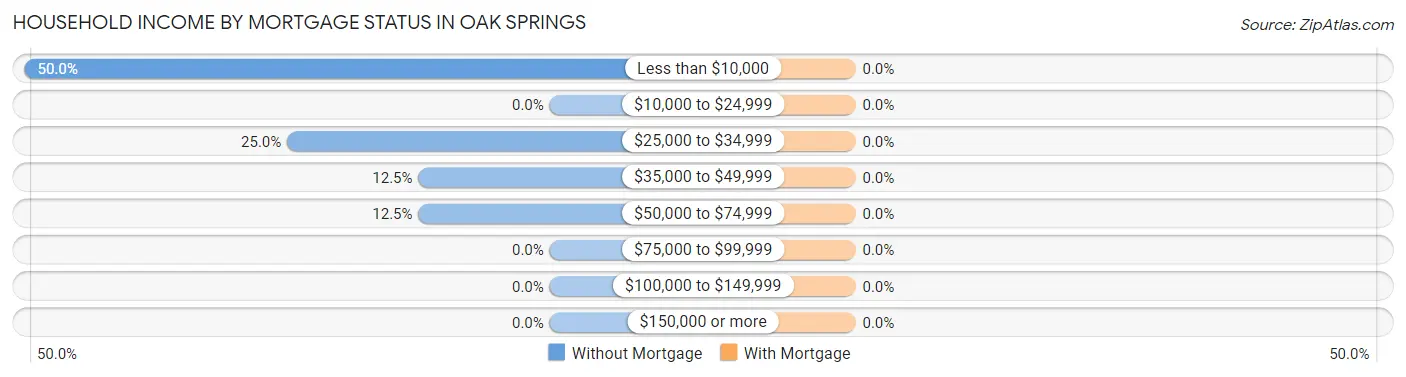
| Household Income | Without Mortgage | With Mortgage |
| Less than $10,000 | 4 (50.0%) | 0 (0.0%) |
| $10,000 to $24,999 | 0 (0.0%) | 0 (0.0%) |
| $25,000 to $34,999 | 2 (25.0%) | 0 (0.0%) |
| $35,000 to $49,999 | 1 (12.5%) | 0 (0.0%) |
| $50,000 to $74,999 | 1 (12.5%) | 0 (0.0%) |
| $75,000 to $99,999 | 0 (0.0%) | 0 (0.0%) |
| $100,000 to $149,999 | 0 (0.0%) | 0 (0.0%) |
| $150,000 or more | 0 (0.0%) | 0 (0.0%) |
| Total | 8 (100.0%) | 0 (0.0%) |
Property Value to Household Income Ratio in Oak Springs
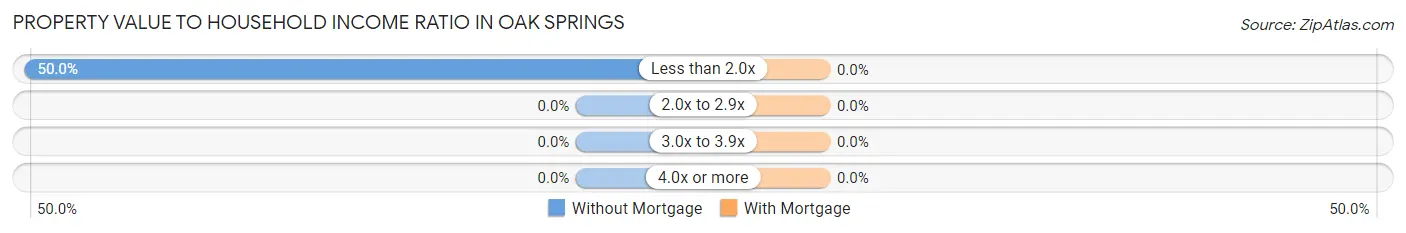
| Value-to-Income Ratio | Without Mortgage | With Mortgage |
| Less than 2.0x | 4 (50.0%) | 0 (0.0%) |
| 2.0x to 2.9x | 0 (0.0%) | 0 (0.0%) |
| 3.0x to 3.9x | 0 (0.0%) | 0 (0.0%) |
| 4.0x or more | 0 (0.0%) | 0 (0.0%) |
| Total | 8 (100.0%) | 0 (0.0%) |
Real Estate Taxes by Mortgage Status in Oak Springs
| Property Taxes | Without Mortgage | With Mortgage |
| Less than $800 | 0 (0.0%) | 0 (0.0%) |
| $800 to $1,499 | 0 (0.0%) | 0 (0.0%) |
| $800 to $1,499 | 0 (0.0%) | 0 (0.0%) |
| Total | 8 (100.0%) | 0 (0.0%) |
Health & Disability in Oak Springs
Health Insurance Coverage by Age in Oak Springs
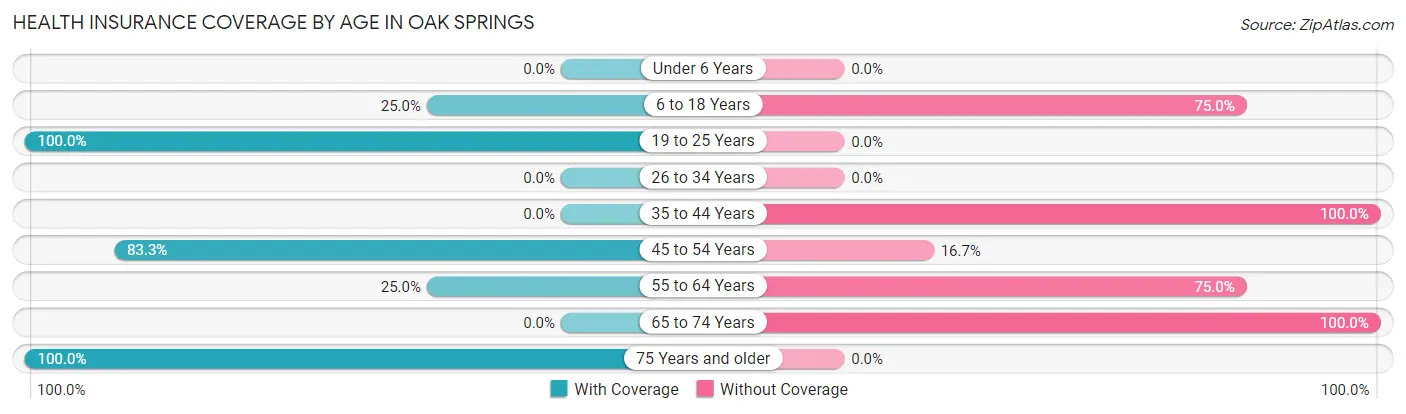
| Age Bracket | With Coverage | Without Coverage |
| Under 6 Years | 0 (0.0%) | 0 (0.0%) |
| 6 to 18 Years | 3 (25.0%) | 9 (75.0%) |
| 19 to 25 Years | 2 (100.0%) | 0 (0.0%) |
| 26 to 34 Years | 0 (0.0%) | 0 (0.0%) |
| 35 to 44 Years | 0 (0.0%) | 3 (100.0%) |
| 45 to 54 Years | 5 (83.3%) | 1 (16.7%) |
| 55 to 64 Years | 1 (25.0%) | 3 (75.0%) |
| 65 to 74 Years | 0 (0.0%) | 4 (100.0%) |
| 75 Years and older | 2 (100.0%) | 0 (0.0%) |
| Total | 13 (39.4%) | 20 (60.6%) |
Health Insurance Coverage by Citizenship Status in Oak Springs
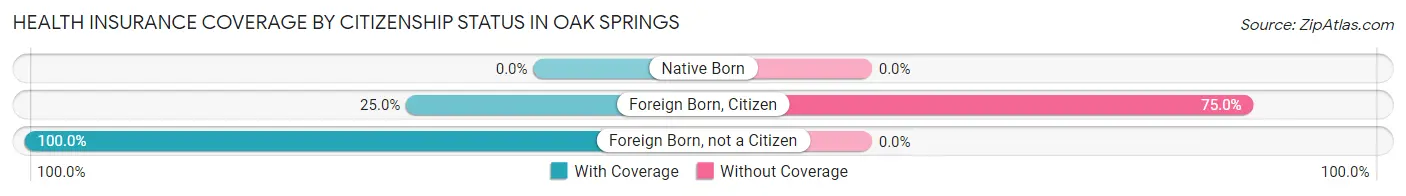
| Citizenship Status | With Coverage | Without Coverage |
| Native Born | 0 (0.0%) | 0 (0.0%) |
| Foreign Born, Citizen | 3 (25.0%) | 9 (75.0%) |
| Foreign Born, not a Citizen | 2 (100.0%) | 0 (0.0%) |
Health Insurance Coverage by Household Income in Oak Springs
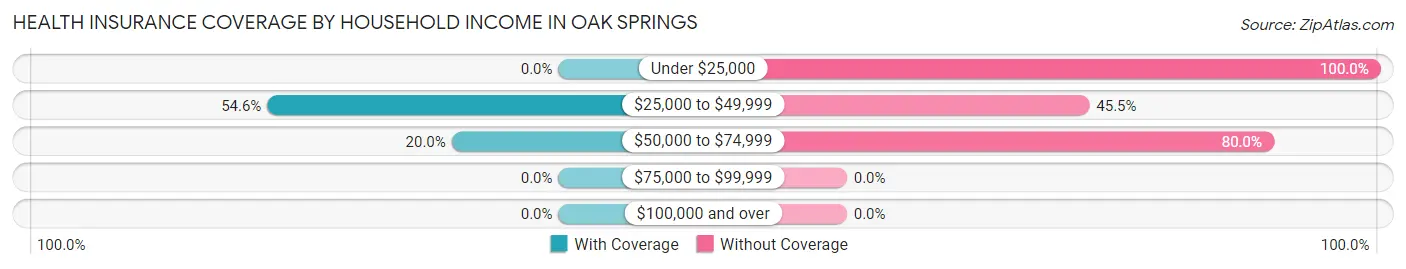
| Household Income | With Coverage | Without Coverage |
| Under $25,000 | 0 (0.0%) | 6 (100.0%) |
| $25,000 to $49,999 | 12 (54.5%) | 10 (45.5%) |
| $50,000 to $74,999 | 1 (20.0%) | 4 (80.0%) |
| $75,000 to $99,999 | 0 (0.0%) | 0 (0.0%) |
| $100,000 and over | 0 (0.0%) | 0 (0.0%) |
Public vs Private Health Insurance Coverage by Age in Oak Springs
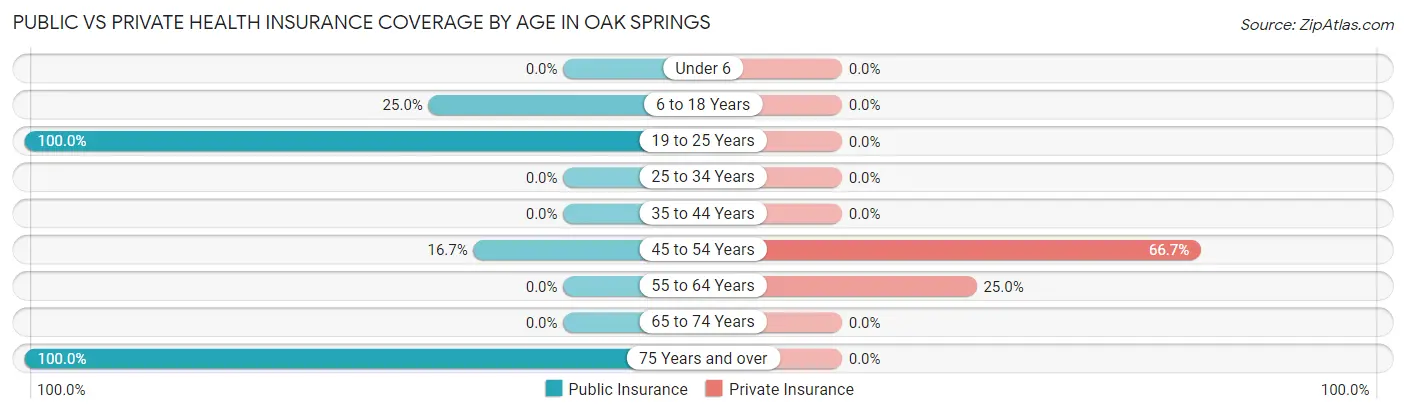
| Age Bracket | Public Insurance | Private Insurance |
| Under 6 | 0 (0.0%) | 0 (0.0%) |
| 6 to 18 Years | 3 (25.0%) | 0 (0.0%) |
| 19 to 25 Years | 2 (100.0%) | 0 (0.0%) |
| 25 to 34 Years | 0 (0.0%) | 0 (0.0%) |
| 35 to 44 Years | 0 (0.0%) | 0 (0.0%) |
| 45 to 54 Years | 1 (16.7%) | 4 (66.7%) |
| 55 to 64 Years | 0 (0.0%) | 1 (25.0%) |
| 65 to 74 Years | 0 (0.0%) | 0 (0.0%) |
| 75 Years and over | 2 (100.0%) | 0 (0.0%) |
| Total | 8 (24.2%) | 5 (15.1%) |
Disability Status by Sex by Age in Oak Springs
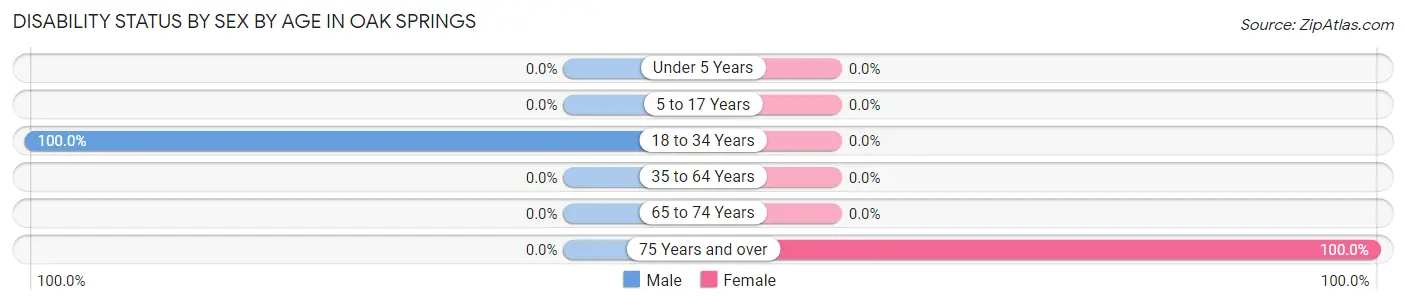
| Age Bracket | Male | Female |
| Under 5 Years | 0 (0.0%) | 0 (0.0%) |
| 5 to 17 Years | 0 (0.0%) | 0 (0.0%) |
| 18 to 34 Years | 2 (100.0%) | 0 (0.0%) |
| 35 to 64 Years | 0 (0.0%) | 0 (0.0%) |
| 65 to 74 Years | 0 (0.0%) | 0 (0.0%) |
| 75 Years and over | 0 (0.0%) | 2 (100.0%) |
Disability Class by Sex by Age in Oak Springs
Disability Class: Hearing Difficulty
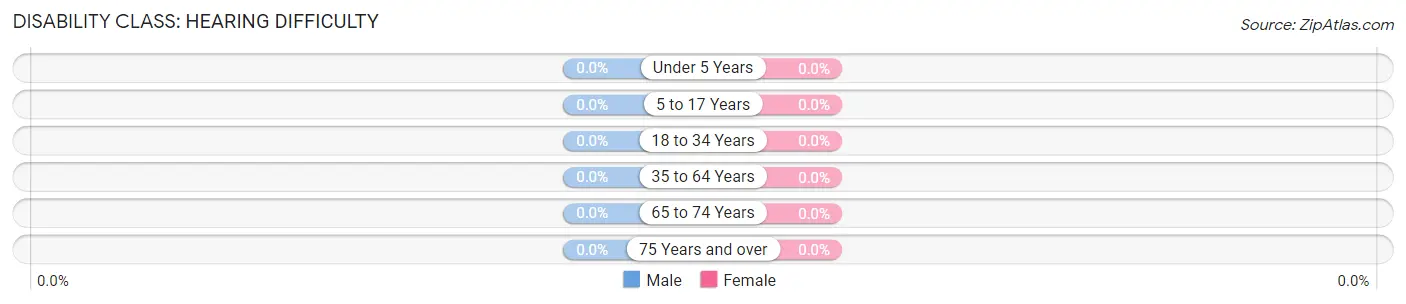
| Age Bracket | Male | Female |
| Under 5 Years | 0 (0.0%) | 0 (0.0%) |
| 5 to 17 Years | 0 (0.0%) | 0 (0.0%) |
| 18 to 34 Years | 0 (0.0%) | 0 (0.0%) |
| 35 to 64 Years | 0 (0.0%) | 0 (0.0%) |
| 65 to 74 Years | 0 (0.0%) | 0 (0.0%) |
| 75 Years and over | 0 (0.0%) | 0 (0.0%) |
Disability Class: Vision Difficulty
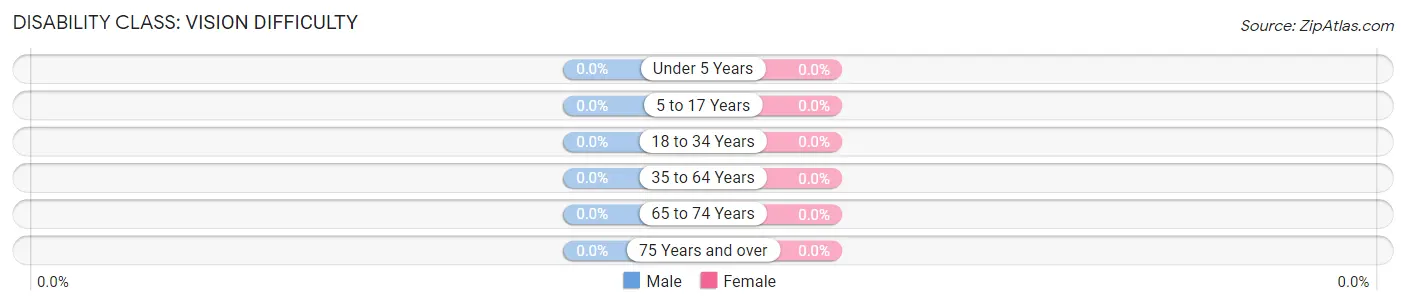
| Age Bracket | Male | Female |
| Under 5 Years | 0 (0.0%) | 0 (0.0%) |
| 5 to 17 Years | 0 (0.0%) | 0 (0.0%) |
| 18 to 34 Years | 0 (0.0%) | 0 (0.0%) |
| 35 to 64 Years | 0 (0.0%) | 0 (0.0%) |
| 65 to 74 Years | 0 (0.0%) | 0 (0.0%) |
| 75 Years and over | 0 (0.0%) | 0 (0.0%) |
Disability Class: Cognitive Difficulty
| Age Bracket | Male | Female |
| 5 to 17 Years | 0 (0.0%) | 0 (0.0%) |
| 18 to 34 Years | 0 (0.0%) | 0 (0.0%) |
| 35 to 64 Years | 0 (0.0%) | 0 (0.0%) |
| 65 to 74 Years | 0 (0.0%) | 0 (0.0%) |
| 75 Years and over | 0 (0.0%) | 0 (0.0%) |
Disability Class: Ambulatory Difficulty
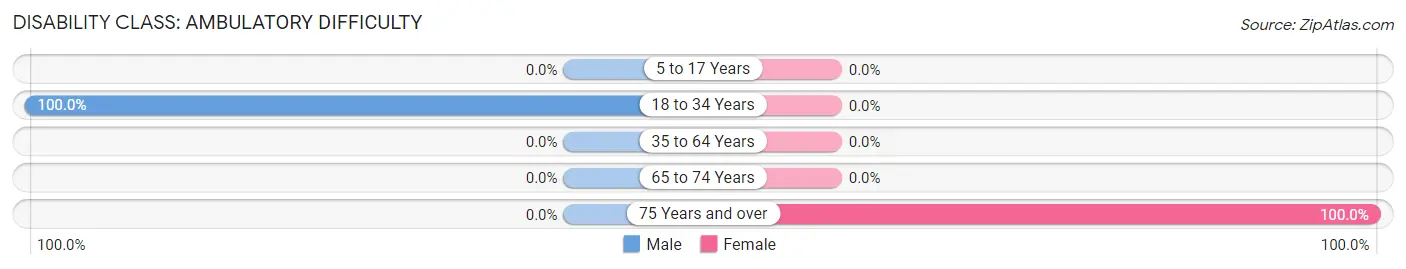
| Age Bracket | Male | Female |
| 5 to 17 Years | 0 (0.0%) | 0 (0.0%) |
| 18 to 34 Years | 2 (100.0%) | 0 (0.0%) |
| 35 to 64 Years | 0 (0.0%) | 0 (0.0%) |
| 65 to 74 Years | 0 (0.0%) | 0 (0.0%) |
| 75 Years and over | 0 (0.0%) | 2 (100.0%) |
Disability Class: Self-Care Difficulty
| Age Bracket | Male | Female |
| 5 to 17 Years | 0 (0.0%) | 0 (0.0%) |
| 18 to 34 Years | 0 (0.0%) | 0 (0.0%) |
| 35 to 64 Years | 0 (0.0%) | 0 (0.0%) |
| 65 to 74 Years | 0 (0.0%) | 0 (0.0%) |
| 75 Years and over | 0 (0.0%) | 0 (0.0%) |
Technology Access in Oak Springs
Computing Device Access in Oak Springs
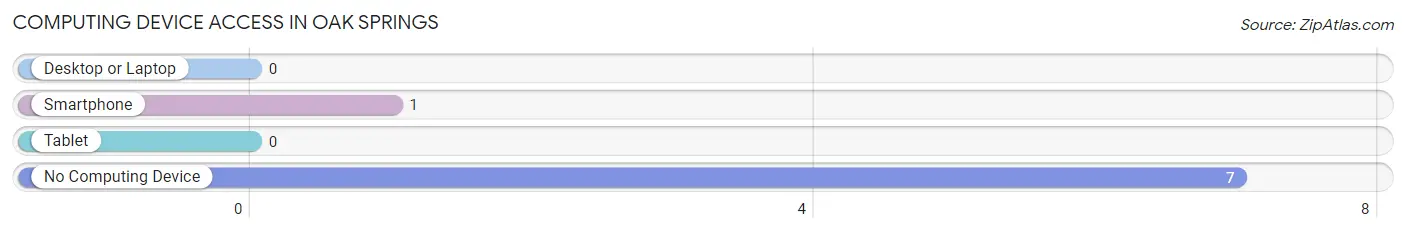
| Device Type | # Households | % Households |
| Desktop or Laptop | 0 | 0.0% |
| Smartphone | 1 | 12.5% |
| Tablet | 0 | 0.0% |
| No Computing Device | 7 | 87.5% |
| Total | 8 | 100.0% |
Internet Access in Oak Springs
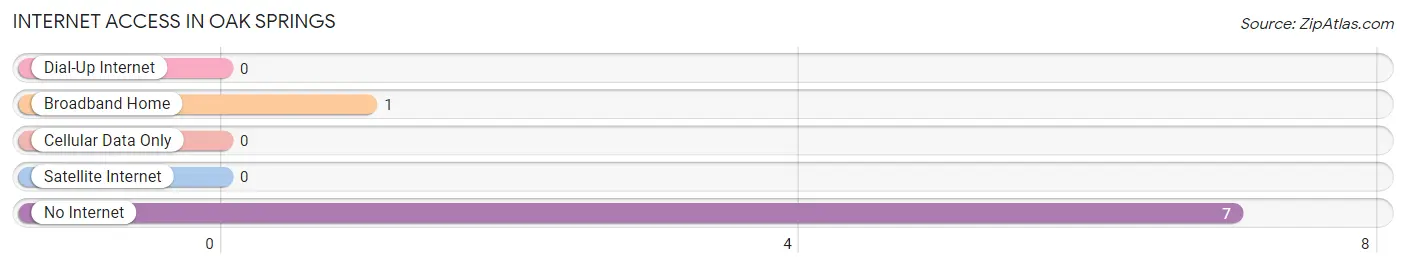
| Internet Type | # Households | % Households |
| Dial-Up Internet | 0 | 0.0% |
| Broadband Home | 1 | 12.5% |
| Cellular Data Only | 0 | 0.0% |
| Satellite Internet | 0 | 0.0% |
| No Internet | 7 | 87.5% |
| Total | 8 | 100.0% |
Oak Springs Summary
History
Oak Springs is a small unincorporated community located in Coconino County, Arizona. It is situated in the Coconino National Forest, approximately 25 miles south of Flagstaff. The area was first settled in the late 1800s by homesteaders who were attracted to the area’s abundant natural resources. The community was officially established in the early 1900s and was named after the nearby Oak Springs, which was a popular watering hole for the local Native American tribes.
The area was primarily used for ranching and farming until the 1950s, when the U.S. Forest Service began to acquire land in the area for the purpose of creating the Coconino National Forest. This led to the development of the Oak Springs Recreation Area, which is now a popular destination for camping, hiking, and other outdoor activities.
Geography
Oak Springs is located in the Coconino National Forest, approximately 25 miles south of Flagstaff. The area is characterized by rolling hills, dense forests, and numerous creeks and streams. The climate is semi-arid, with hot summers and cold winters. The average annual precipitation is approximately 15 inches.
The area is home to a variety of wildlife, including elk, deer, coyotes, and a variety of birds. The nearby Oak Springs Recreation Area is a popular destination for camping, hiking, and other outdoor activities.
Economy
The economy of Oak Springs is largely based on tourism and recreation. The nearby Oak Springs Recreation Area is a popular destination for camping, hiking, and other outdoor activities. The area is also home to a variety of small businesses, including restaurants, stores, and lodges.
Demographics
As of the 2010 census, the population of Oak Springs was 1,093. The racial makeup of the town was 94.3% White, 0.7% Native American, 0.2% Asian, 0.1% Pacific Islander, 0.1% Black or African American, 0.1% from other races, and 4.6% from two or more races. Hispanic or Latino of any race were 2.2% of the population.
The median income for a household in the town was $37,500, and the median income for a family was $41,250. The per capita income for the town was $17,845. About 11.2% of families and 14.2% of the population were below the poverty line, including 18.2% of those under age 18 and none of those age 65 or over.
Common Questions
What is Per Capita Income in Oak Springs?
Per Capita income in Oak Springs is $5,252.
What is Inequality or Gini Index in Oak Springs?
Inequality or Gini Index in Oak Springs is 0.57.
What is the Total Population of Oak Springs?
Total Population of Oak Springs is 33.
What is the Total Male Population of Oak Springs?
Total Male Population of Oak Springs is 17.
What is the Total Female Population of Oak Springs?
Total Female Population of Oak Springs is 16.
What is the Ratio of Males per 100 Females in Oak Springs?
There are 106.25 Males per 100 Females in Oak Springs.
What is the Ratio of Females per 100 Males in Oak Springs?
There are 94.12 Females per 100 Males in Oak Springs.
What is the Median Population Age in Oak Springs?
Median Population Age in Oak Springs is 39.8 Years.
What is the Average Family Size in Oak Springs
Average Family Size in Oak Springs is 6.0 People.
What is the Average Household Size in Oak Springs
Average Household Size in Oak Springs is 4.1 People.
How Large is the Labor Force in Oak Springs?
There are 7 People in the Labor Forcein in Oak Springs.
What is the Percentage of People in the Labor Force in Oak Springs?
25.0% of People are in the Labor Force in Oak Springs.
What is the Unemployment Rate in Oak Springs?
Unemployment Rate in Oak Springs is 14.3%.