Christopher Creek, AZ Map & Demographics
Christopher Creek Map
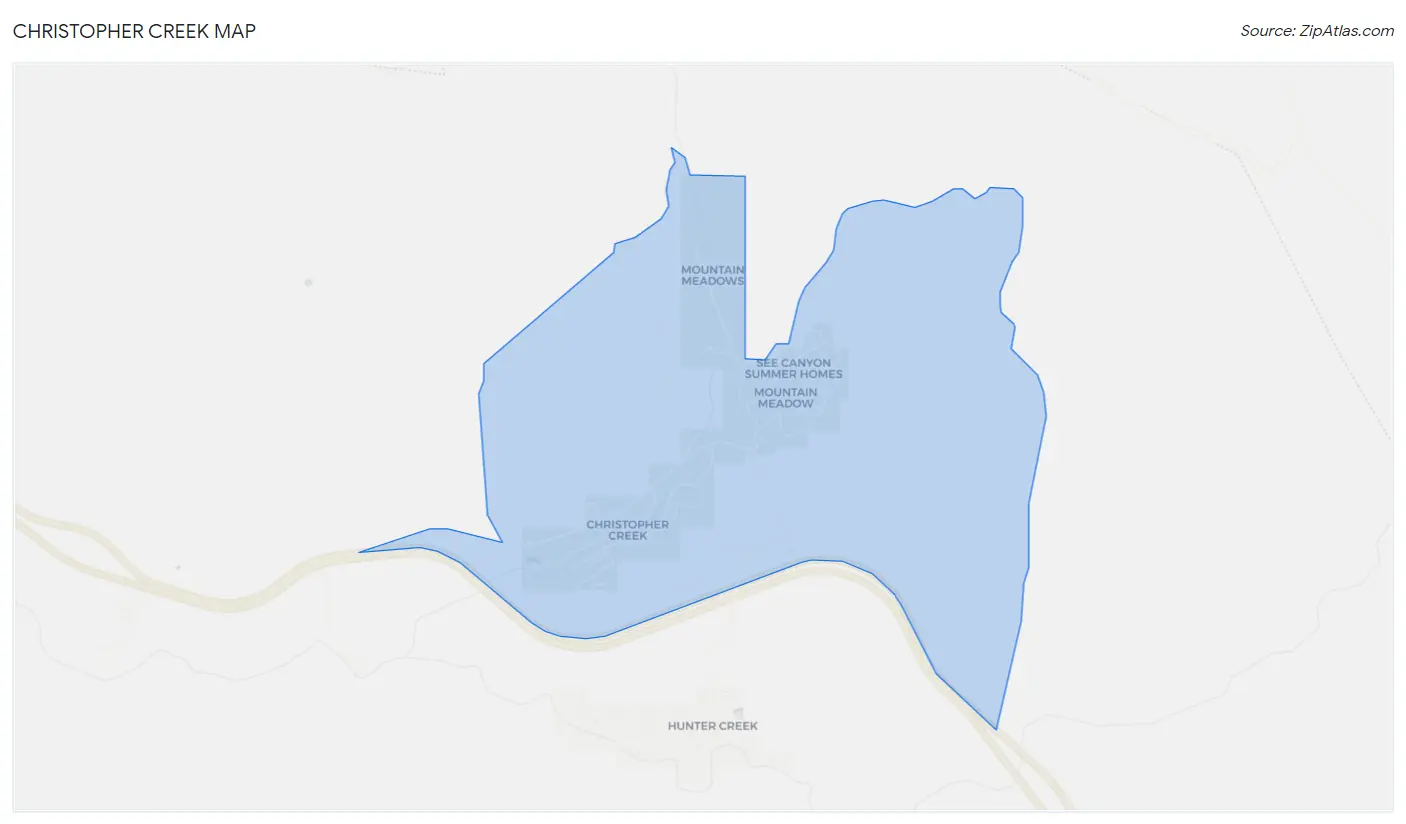
Christopher Creek Overview
$50,631
PER CAPITA INCOME
$71,786
AVG FAMILY INCOME
$71,205
AVG HOUSEHOLD INCOME
0.37
INEQUALITY / GINI INDEX
118
TOTAL POPULATION
65
MALE POPULATION
53
FEMALE POPULATION
122.64
MALES / 100 FEMALES
81.54
FEMALES / 100 MALES
64.9
MEDIAN AGE
1.9
AVG FAMILY SIZE
1.8
AVG HOUSEHOLD SIZE
54
LABOR FORCE [ PEOPLE ]
45.8%
PERCENT IN LABOR FORCE
Income in Christopher Creek
Income Overview in Christopher Creek
Per Capita Income in Christopher Creek is $50,631, while median incomes of families and households are $71,786 and $71,205 respectively.
| Characteristic | Number | Measure |
| Per Capita Income | 118 | $50,631 |
| Median Family Income | 54 | $71,786 |
| Mean Family Income | 54 | $107,237 |
| Median Household Income | 67 | $71,205 |
| Mean Household Income | 67 | $90,946 |
| Income Deficit | 54 | $0 |
| Wage / Income Gap (%) | 118 | 0.00% |
| Wage / Income Gap ($) | 118 | 100.00¢ per $1 |
| Gini / Inequality Index | 118 | 0.37 |
Earnings by Sex in Christopher Creek
| Sex | Number | Average Earnings |
| Male | 28 (51.8%) | $0 |
| Female | 26 (48.1%) | $0 |
| Total | 54 (100.0%) | $0 |
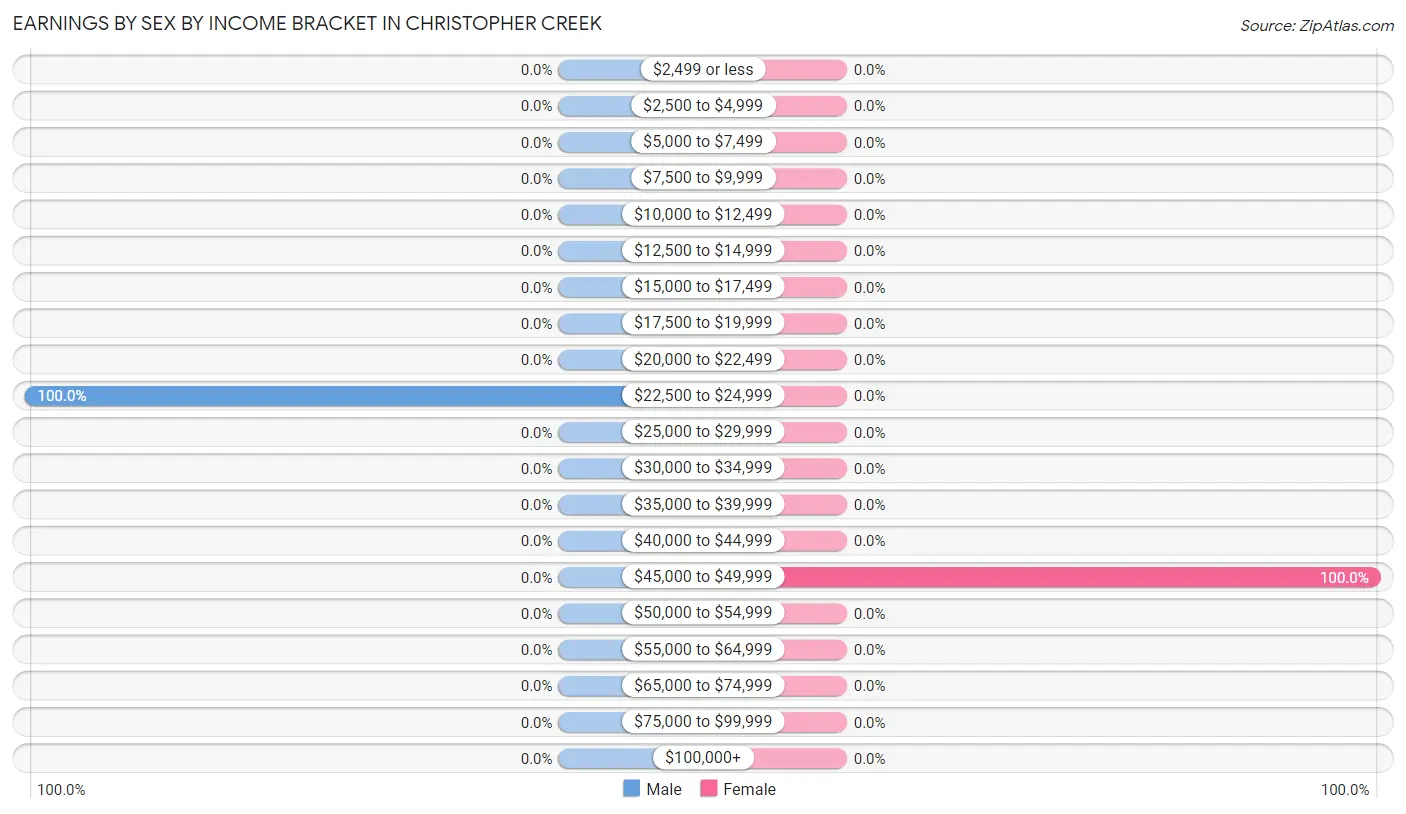
Earnings by Sex by Income Bracket in Christopher Creek
The most common earnings brackets in Christopher Creek are $22,500 to $24,999 for men (28 | 100.0%) and $45,000 to $49,999 for women (26 | 100.0%).
| Income | Male | Female |
| $2,499 or less | 0 (0.0%) | 0 (0.0%) |
| $2,500 to $4,999 | 0 (0.0%) | 0 (0.0%) |
| $5,000 to $7,499 | 0 (0.0%) | 0 (0.0%) |
| $7,500 to $9,999 | 0 (0.0%) | 0 (0.0%) |
| $10,000 to $12,499 | 0 (0.0%) | 0 (0.0%) |
| $12,500 to $14,999 | 0 (0.0%) | 0 (0.0%) |
| $15,000 to $17,499 | 0 (0.0%) | 0 (0.0%) |
| $17,500 to $19,999 | 0 (0.0%) | 0 (0.0%) |
| $20,000 to $22,499 | 0 (0.0%) | 0 (0.0%) |
| $22,500 to $24,999 | 28 (100.0%) | 0 (0.0%) |
| $25,000 to $29,999 | 0 (0.0%) | 0 (0.0%) |
| $30,000 to $34,999 | 0 (0.0%) | 0 (0.0%) |
| $35,000 to $39,999 | 0 (0.0%) | 0 (0.0%) |
| $40,000 to $44,999 | 0 (0.0%) | 0 (0.0%) |
| $45,000 to $49,999 | 0 (0.0%) | 26 (100.0%) |
| $50,000 to $54,999 | 0 (0.0%) | 0 (0.0%) |
| $55,000 to $64,999 | 0 (0.0%) | 0 (0.0%) |
| $65,000 to $74,999 | 0 (0.0%) | 0 (0.0%) |
| $75,000 to $99,999 | 0 (0.0%) | 0 (0.0%) |
| $100,000+ | 0 (0.0%) | 0 (0.0%) |
| Total | 28 (100.0%) | 26 (100.0%) |
Earnings by Sex by Educational Attainment in Christopher Creek
| Educational Attainment | Male Income | Female Income |
| Less than High School | - | - |
| High School Diploma | - | - |
| College or Associate's Degree | - | - |
| Bachelor's Degree | - | - |
| Graduate Degree | - | - |
| Total | - | - |
Family Income in Christopher Creek
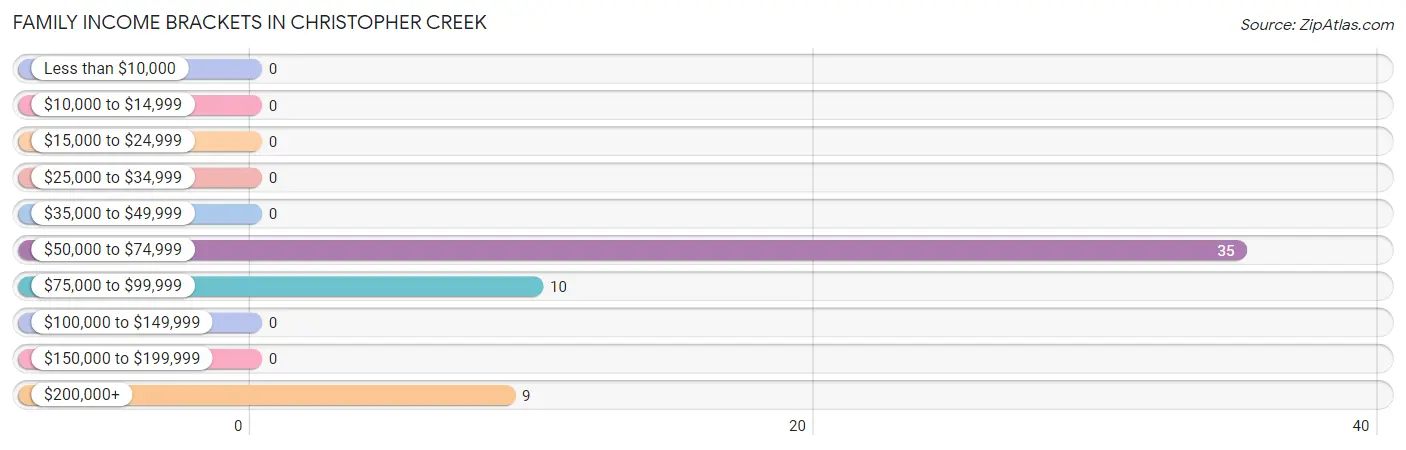
Family Income Brackets in Christopher Creek
According to the Christopher Creek family income data, there are 35 families falling into the $50,000 to $74,999 income range, which is the most common income bracket and makes up 64.8% of all families.
| Income Bracket | # Families | % Families |
| Less than $10,000 | 0 | 0.0% |
| $10,000 to $14,999 | 0 | 0.0% |
| $15,000 to $24,999 | 0 | 0.0% |
| $25,000 to $34,999 | 0 | 0.0% |
| $35,000 to $49,999 | 0 | 0.0% |
| $50,000 to $74,999 | 35 | 64.8% |
| $75,000 to $99,999 | 10 | 18.5% |
| $100,000 to $149,999 | 0 | 0.0% |
| $150,000 to $199,999 | 0 | 0.0% |
| $200,000+ | 9 | 16.7% |
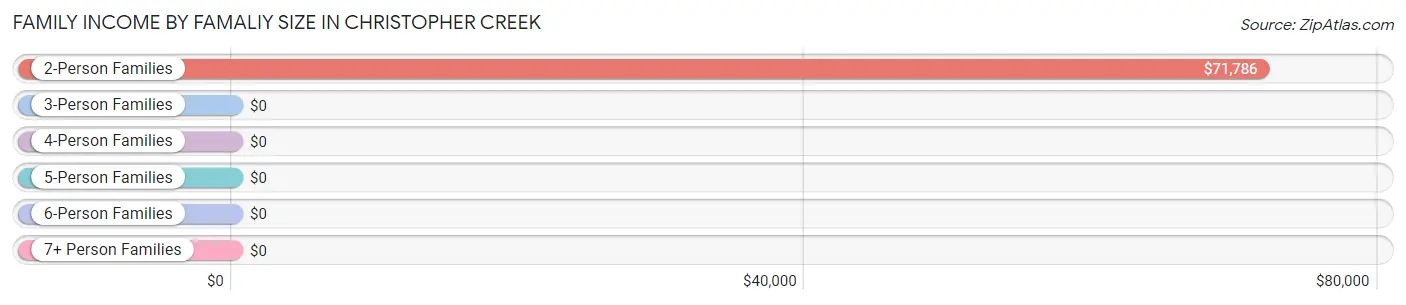
Family Income by Famaliy Size in Christopher Creek
2-person families (54 | 100.0%) account for the highest median family income in Christopher Creek with $71,786 per family, while 2-person families (54 | 100.0%) have the highest median income of $35,893 per family member.
| Income Bracket | # Families | Median Income |
| 2-Person Families | 54 (100.0%) | $71,786 |
| 3-Person Families | 0 (0.0%) | $0 |
| 4-Person Families | 0 (0.0%) | $0 |
| 5-Person Families | 0 (0.0%) | $0 |
| 6-Person Families | 0 (0.0%) | $0 |
| 7+ Person Families | 0 (0.0%) | $0 |
| Total | 54 (100.0%) | $71,786 |
Family Income by Number of Earners in Christopher Creek
| Number of Earners | # Families | Median Income |
| No Earners | 26 (48.1%) | $0 |
| 1 Earner | 0 (0.0%) | $0 |
| 2 Earners | 28 (51.8%) | $0 |
| 3+ Earners | 0 (0.0%) | $0 |
| Total | 54 (100.0%) | $71,786 |
Household Income in Christopher Creek
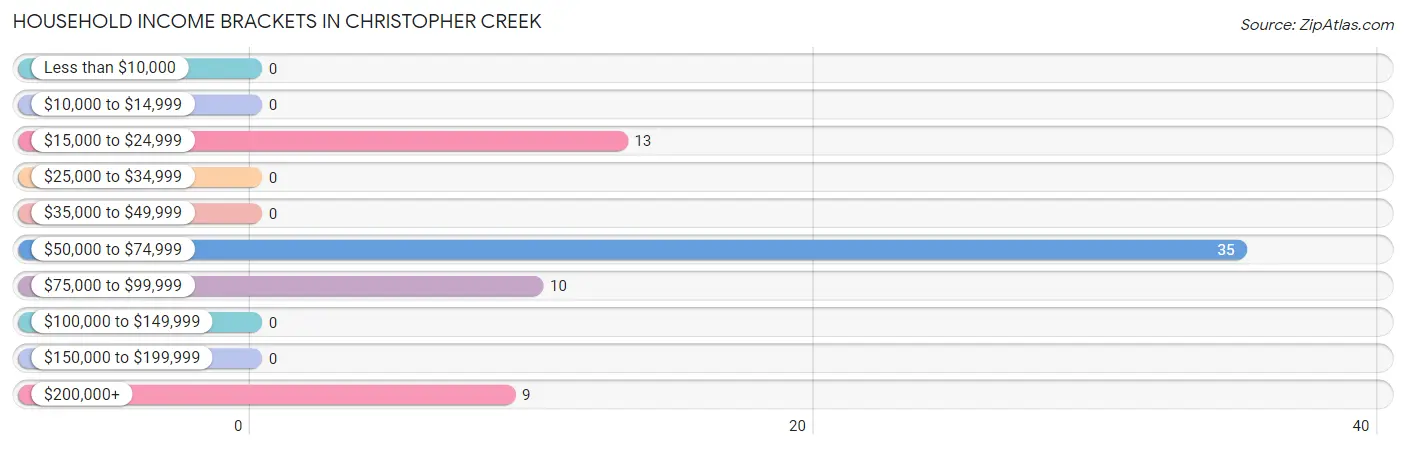
Household Income Brackets in Christopher Creek
With 35 households falling in the category, the $50,000 to $74,999 income range is the most frequent in Christopher Creek, accounting for 52.2% of all households.
| Income Bracket | # Households | % Households |
| Less than $10,000 | 0 | 0.0% |
| $10,000 to $14,999 | 0 | 0.0% |
| $15,000 to $24,999 | 13 | 19.4% |
| $25,000 to $34,999 | 0 | 0.0% |
| $35,000 to $49,999 | 0 | 0.0% |
| $50,000 to $74,999 | 35 | 52.2% |
| $75,000 to $99,999 | 10 | 14.9% |
| $100,000 to $149,999 | 0 | 0.0% |
| $150,000 to $199,999 | 0 | 0.0% |
| $200,000+ | 9 | 13.4% |
Household Income by Householder Age in Christopher Creek
| Income Bracket | # Households | Median Income |
| 15 to 24 Years | 0 (0.0%) | $0 |
| 25 to 44 Years | 28 (41.8%) | $0 |
| 45 to 64 Years | 8 (11.9%) | $0 |
| 65+ Years | 31 (46.3%) | $0 |
| Total | 67 (100.0%) | $71,205 |
Poverty in Christopher Creek
Income Below Poverty by Sex and Age in Christopher Creek
| Age Bracket | Male | Female |
| Under 5 Years | 0 (0.0%) | 0 (0.0%) |
| 5 Years | 0 (0.0%) | 0 (0.0%) |
| 6 to 11 Years | 0 (0.0%) | 0 (0.0%) |
| 12 to 14 Years | 0 (0.0%) | 0 (0.0%) |
| 15 Years | 0 (0.0%) | 0 (0.0%) |
| 16 and 17 Years | 0 (0.0%) | 0 (0.0%) |
| 18 to 24 Years | 0 (0.0%) | 0 (0.0%) |
| 25 to 34 Years | 0 (0.0%) | 0 (0.0%) |
| 35 to 44 Years | 0 (0.0%) | 0 (0.0%) |
| 45 to 54 Years | 0 (0.0%) | 0 (0.0%) |
| 55 to 64 Years | 0 (0.0%) | 0 (0.0%) |
| 65 to 74 Years | 0 (0.0%) | 0 (0.0%) |
| 75 Years and over | 0 (0.0%) | 0 (0.0%) |
| Total | 0 (0.0%) | 0 (0.0%) |
Income Above Poverty by Sex and Age in Christopher Creek
According to the poverty statistics in Christopher Creek, males aged 35 to 44 years and females aged 55 to 64 years are the age groups that are most secure financially, with 100.0% of males and 100.0% of females in these age groups living above the poverty line.
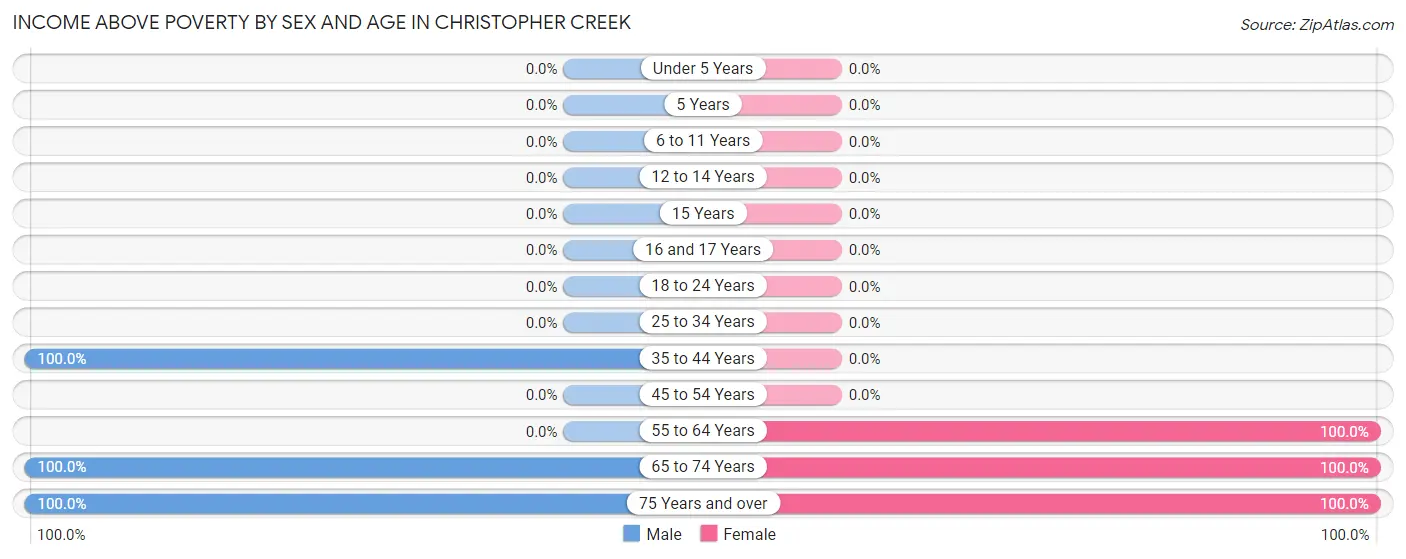
| Age Bracket | Male | Female |
| Under 5 Years | 0 (0.0%) | 0 (0.0%) |
| 5 Years | 0 (0.0%) | 0 (0.0%) |
| 6 to 11 Years | 0 (0.0%) | 0 (0.0%) |
| 12 to 14 Years | 0 (0.0%) | 0 (0.0%) |
| 15 Years | 0 (0.0%) | 0 (0.0%) |
| 16 and 17 Years | 0 (0.0%) | 0 (0.0%) |
| 18 to 24 Years | 0 (0.0%) | 0 (0.0%) |
| 25 to 34 Years | 0 (0.0%) | 0 (0.0%) |
| 35 to 44 Years | 28 (100.0%) | 0 (0.0%) |
| 45 to 54 Years | 0 (0.0%) | 0 (0.0%) |
| 55 to 64 Years | 0 (0.0%) | 34 (100.0%) |
| 65 to 74 Years | 23 (100.0%) | 11 (100.0%) |
| 75 Years and over | 14 (100.0%) | 8 (100.0%) |
| Total | 65 (100.0%) | 53 (100.0%) |
Income Below Poverty Among Married-Couple Families in Christopher Creek
| Children | Above Poverty | Below Poverty |
| No Children | 54 (100.0%) | 0 (0.0%) |
| 1 or 2 Children | 0 (0.0%) | 0 (0.0%) |
| 3 or 4 Children | 0 (0.0%) | 0 (0.0%) |
| 5 or more Children | 0 (0.0%) | 0 (0.0%) |
| Total | 54 (100.0%) | 0 (0.0%) |
Income Below Poverty Among Single-Parent Households in Christopher Creek
| Children | Single Father | Single Mother |
| No Children | 0 (0.0%) | 0 (0.0%) |
| 1 or 2 Children | 0 (0.0%) | 0 (0.0%) |
| 3 or 4 Children | 0 (0.0%) | 0 (0.0%) |
| 5 or more Children | 0 (0.0%) | 0 (0.0%) |
| Total | 0 (0.0%) | 0 (0.0%) |
Income Below Poverty Among Married-Couple vs Single-Parent Households in Christopher Creek
| Children | Married-Couple Families | Single-Parent Households |
| No Children | 0 (0.0%) | 0 (0.0%) |
| 1 or 2 Children | 0 (0.0%) | 0 (0.0%) |
| 3 or 4 Children | 0 (0.0%) | 0 (0.0%) |
| 5 or more Children | 0 (0.0%) | 0 (0.0%) |
| Total | 0 (0.0%) | 0 (0.0%) |
Race in Christopher Creek
The most populous races in Christopher Creek are , and White / Caucasian (118 | 100.0%).
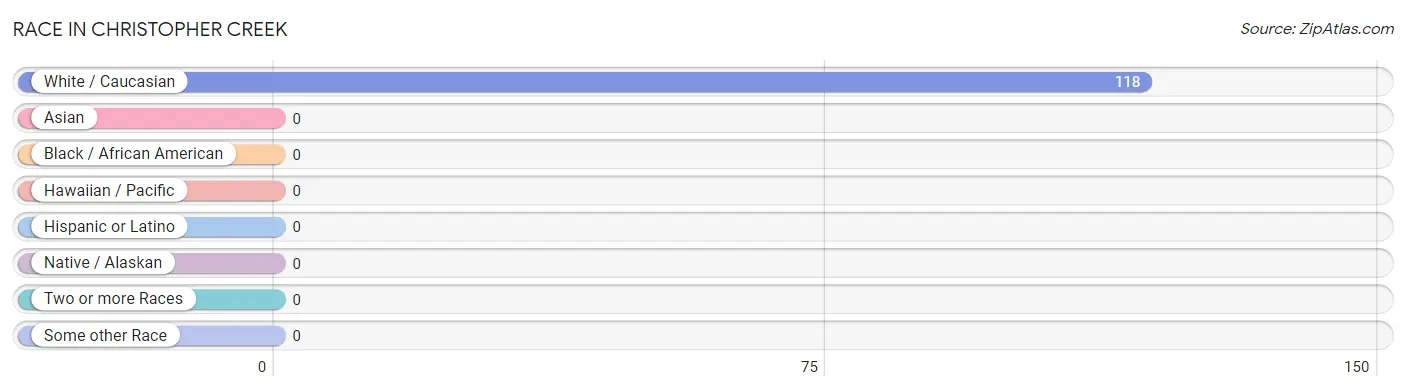
| Race | # Population | % Population |
| Asian | 0 | 0.0% |
| Black / African American | 0 | 0.0% |
| Hawaiian / Pacific | 0 | 0.0% |
| Hispanic or Latino | 0 | 0.0% |
| Native / Alaskan | 0 | 0.0% |
| White / Caucasian | 118 | 100.0% |
| Two or more Races | 0 | 0.0% |
| Some other Race | 0 | 0.0% |
| Total | 118 | 100.0% |
Ancestry in Christopher Creek
The most populous ancestries reported in Christopher Creek are Swedish (33 | 28.0%), Scottish (26 | 22.0%), American (17 | 14.4%), Polish (15 | 12.7%), and German (13 | 11.0%), together accounting for 88.1% of all Christopher Creek residents.
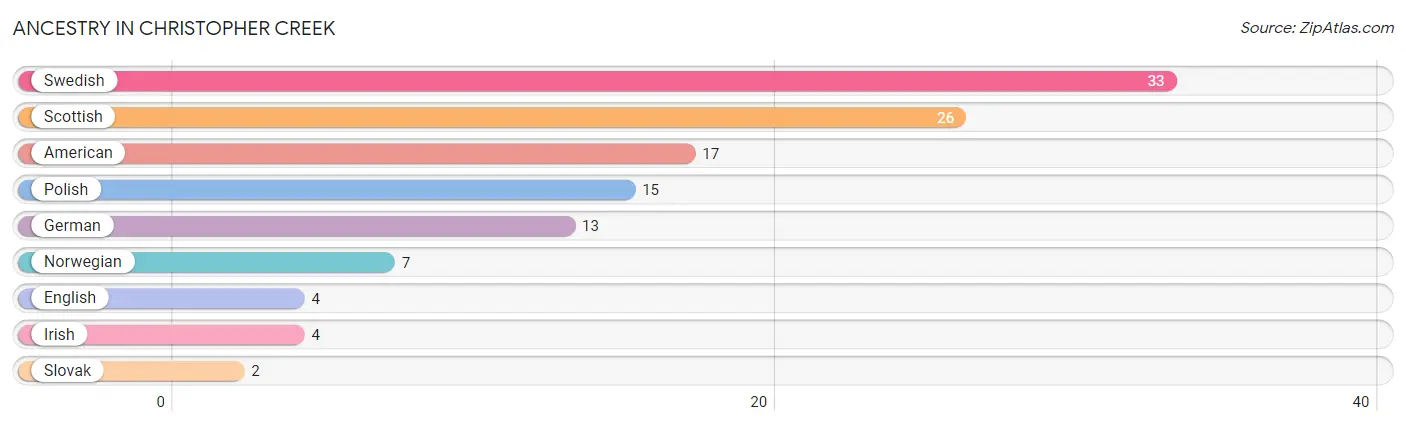
| Ancestry | # Population | % Population |
| American | 17 | 14.4% |
| English | 4 | 3.4% |
| German | 13 | 11.0% |
| Irish | 4 | 3.4% |
| Norwegian | 7 | 5.9% |
| Polish | 15 | 12.7% |
| Scottish | 26 | 22.0% |
| Slovak | 2 | 1.7% |
| Swedish | 33 | 28.0% | View All 9 Rows |
Immigrants in Christopher Creek

| Immigration Origin | # Population | % Population | View All 0 Rows |
Sex and Age in Christopher Creek
Sex and Age in Christopher Creek
The most populous age groups in Christopher Creek are 35 to 39 Years (28 | 43.1%) for men and 60 to 64 Years (34 | 64.1%) for women.
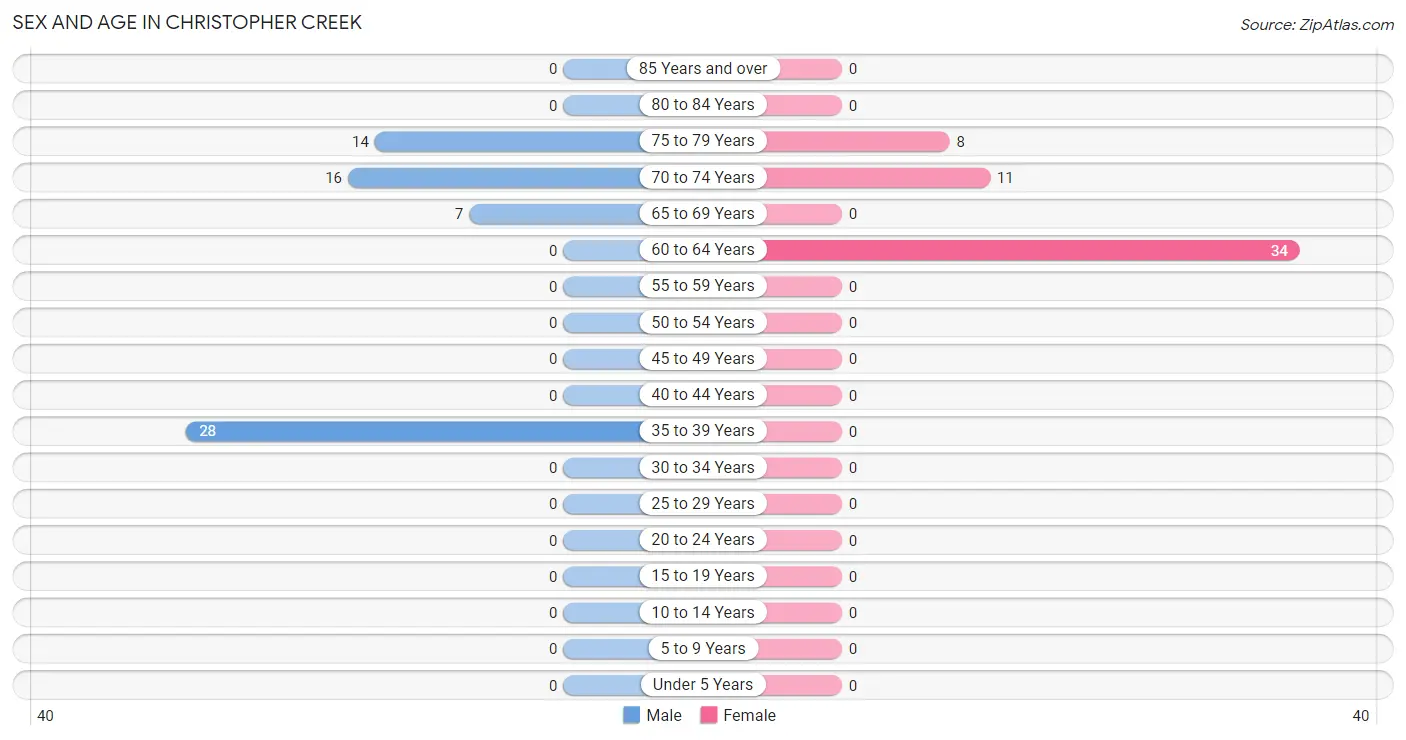
| Age Bracket | Male | Female |
| Under 5 Years | 0 (0.0%) | 0 (0.0%) |
| 5 to 9 Years | 0 (0.0%) | 0 (0.0%) |
| 10 to 14 Years | 0 (0.0%) | 0 (0.0%) |
| 15 to 19 Years | 0 (0.0%) | 0 (0.0%) |
| 20 to 24 Years | 0 (0.0%) | 0 (0.0%) |
| 25 to 29 Years | 0 (0.0%) | 0 (0.0%) |
| 30 to 34 Years | 0 (0.0%) | 0 (0.0%) |
| 35 to 39 Years | 28 (43.1%) | 0 (0.0%) |
| 40 to 44 Years | 0 (0.0%) | 0 (0.0%) |
| 45 to 49 Years | 0 (0.0%) | 0 (0.0%) |
| 50 to 54 Years | 0 (0.0%) | 0 (0.0%) |
| 55 to 59 Years | 0 (0.0%) | 0 (0.0%) |
| 60 to 64 Years | 0 (0.0%) | 34 (64.1%) |
| 65 to 69 Years | 7 (10.8%) | 0 (0.0%) |
| 70 to 74 Years | 16 (24.6%) | 11 (20.7%) |
| 75 to 79 Years | 14 (21.5%) | 8 (15.1%) |
| 80 to 84 Years | 0 (0.0%) | 0 (0.0%) |
| 85 Years and over | 0 (0.0%) | 0 (0.0%) |
| Total | 65 (100.0%) | 53 (100.0%) |
Families and Households in Christopher Creek
Median Family Size in Christopher Creek
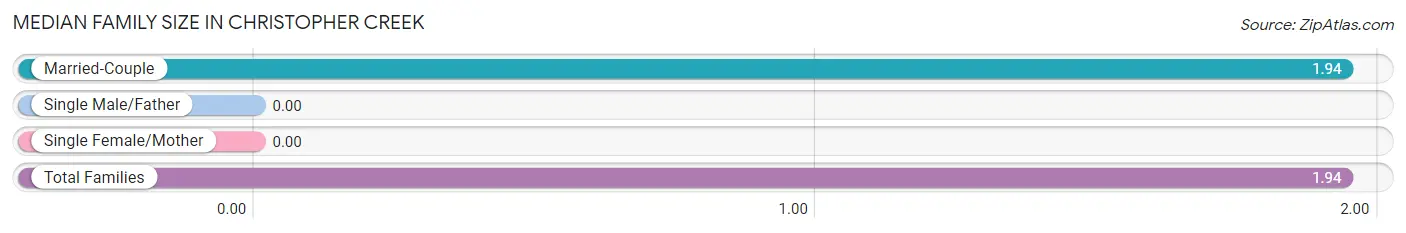
| Family Type | # Families | Family Size |
| Married-Couple | 54 (100.0%) | 1.94 |
| Single Male/Father | 0 (0.0%) | - |
| Single Female/Mother | 0 (0.0%) | - |
| Total Families | 54 (100.0%) | 1.94 |
Median Household Size in Christopher Creek
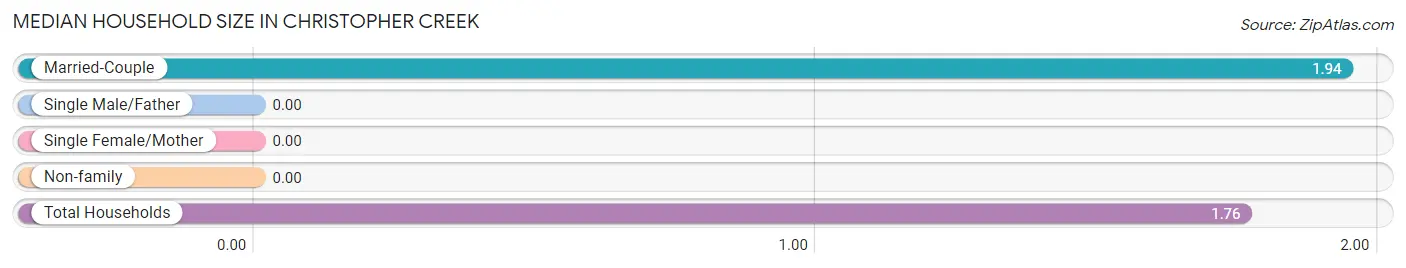
| Household Type | # Households | Household Size |
| Married-Couple | 54 (80.6%) | 1.94 |
| Single Male/Father | 0 (0.0%) | - |
| Single Female/Mother | 0 (0.0%) | - |
| Non-family | 13 (19.4%) | - |
| Total Households | 67 (100.0%) | 1.76 |
Household Size by Marriage Status in Christopher Creek
Out of a total of 67 households in Christopher Creek, 54 (80.6%) are family households, while 13 (19.4%) are nonfamily households. The most numerous type of family households are 2-person households, comprising 54, and the most common type of nonfamily households are 1-person households, comprising 13.
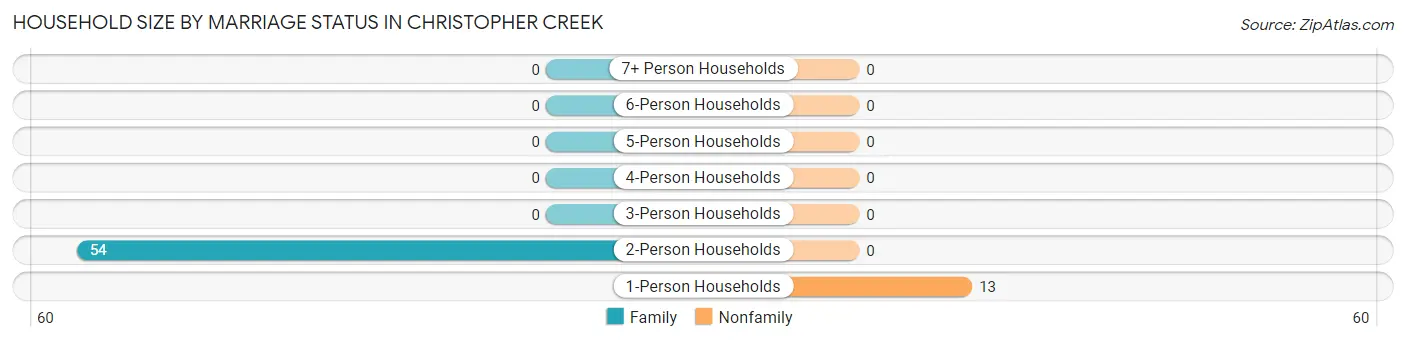
| Household Size | Family Households | Nonfamily Households |
| 1-Person Households | - | 13 (19.4%) |
| 2-Person Households | 54 (80.6%) | 0 (0.0%) |
| 3-Person Households | 0 (0.0%) | 0 (0.0%) |
| 4-Person Households | 0 (0.0%) | 0 (0.0%) |
| 5-Person Households | 0 (0.0%) | 0 (0.0%) |
| 6-Person Households | 0 (0.0%) | 0 (0.0%) |
| 7+ Person Households | 0 (0.0%) | 0 (0.0%) |
| Total | 54 (80.6%) | 13 (19.4%) |
Female Fertility in Christopher Creek
Fertility by Age in Christopher Creek
| Age Bracket | Women with Births | Births / 1,000 Women |
| 15 to 19 years | 0 (0.0%) | 0.0 |
| 20 to 34 years | 0 (0.0%) | 0.0 |
| 35 to 50 years | 0 (0.0%) | 0.0 |
| Total | 0 (0.0%) | 0.0 |
Fertility by Age by Marriage Status in Christopher Creek
| Age Bracket | Married | Unmarried |
| 15 to 19 years | 0 (0.0%) | 0 (0.0%) |
| 20 to 34 years | 0 (0.0%) | 0 (0.0%) |
| 35 to 50 years | 0 (0.0%) | 0 (0.0%) |
| Total | 0 (0.0%) | 0 (0.0%) |
Fertility by Education in Christopher Creek
| Educational Attainment | Women with Births | Births / 1,000 Women |
| Less than High School | 0 (0.0%) | 0.0 |
| High School Diploma | 0 (0.0%) | 0.0 |
| College or Associate's Degree | 0 (0.0%) | 0.0 |
| Bachelor's Degree | 0 (0.0%) | 0.0 |
| Graduate Degree | 0 (0.0%) | 0.0 |
| Total | 0 (0.0%) | 0.0 |
Fertility by Education by Marriage Status in Christopher Creek
| Educational Attainment | Married | Unmarried |
| Less than High School | 0 (0.0%) | 0 (0.0%) |
| High School Diploma | 0 (0.0%) | 0 (0.0%) |
| College or Associate's Degree | 0 (0.0%) | 0 (0.0%) |
| Bachelor's Degree | 0 (0.0%) | 0 (0.0%) |
| Graduate Degree | 0 (0.0%) | 0 (0.0%) |
| Total | 0 (0.0%) | 0 (0.0%) |
Employment Characteristics in Christopher Creek
Employment by Class of Employer in Christopher Creek
Among the 54 employed individuals in Christopher Creek, private company employees (28 | 51.8%), and state government employees (26 | 48.1%) make up the most common classes of employment.
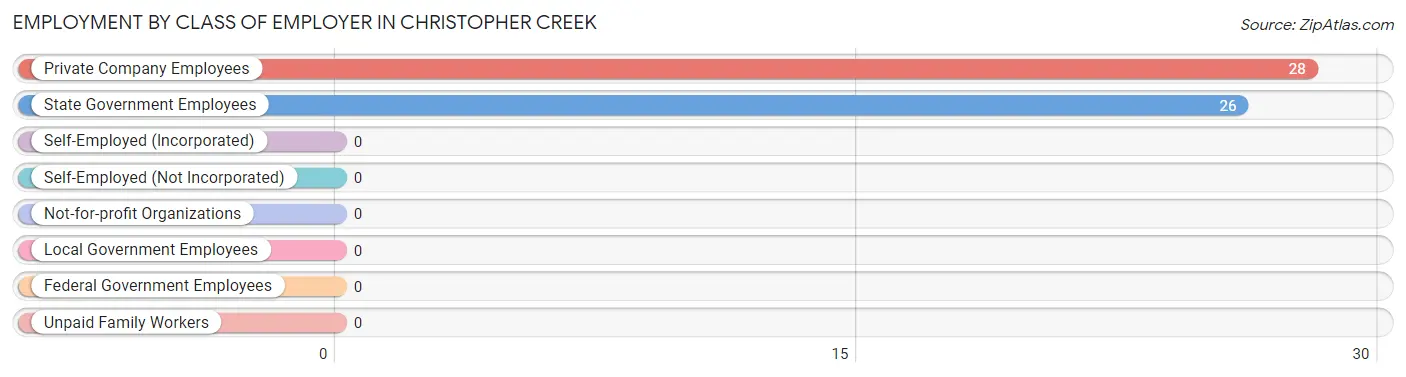
| Employer Class | # Employees | % Employees |
| Private Company Employees | 28 | 51.8% |
| Self-Employed (Incorporated) | 0 | 0.0% |
| Self-Employed (Not Incorporated) | 0 | 0.0% |
| Not-for-profit Organizations | 0 | 0.0% |
| Local Government Employees | 0 | 0.0% |
| State Government Employees | 26 | 48.1% |
| Federal Government Employees | 0 | 0.0% |
| Unpaid Family Workers | 0 | 0.0% |
| Total | 54 | 100.0% |
Employment Status by Age in Christopher Creek
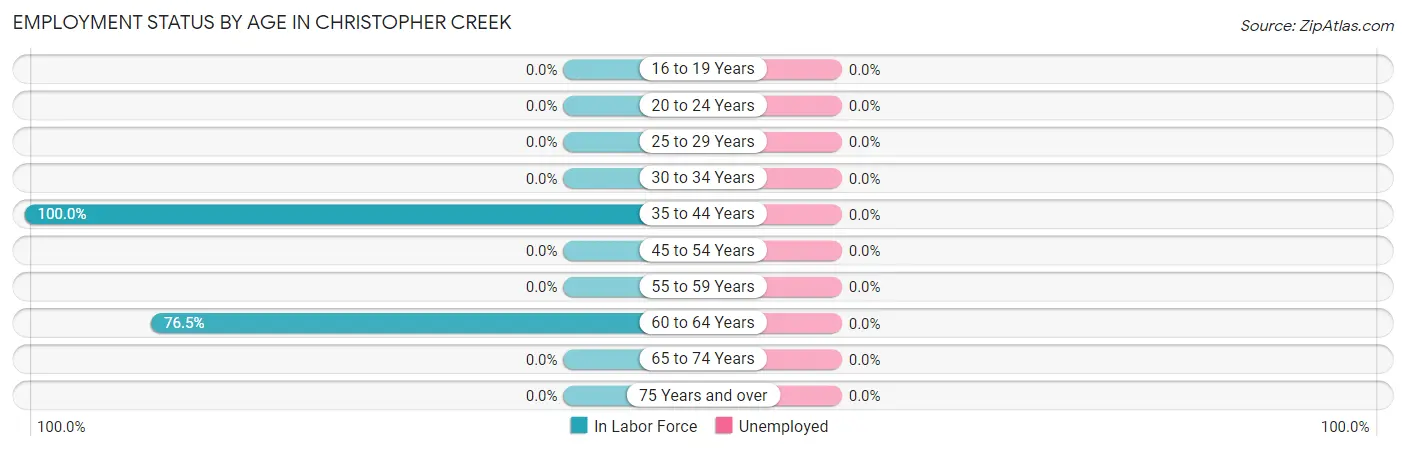
| Age Bracket | In Labor Force | Unemployed |
| 16 to 19 Years | 0 (0.0%) | 0 (0.0%) |
| 20 to 24 Years | 0 (0.0%) | 0 (0.0%) |
| 25 to 29 Years | 0 (0.0%) | 0 (0.0%) |
| 30 to 34 Years | 0 (0.0%) | 0 (0.0%) |
| 35 to 44 Years | 28 (100.0%) | 0 (0.0%) |
| 45 to 54 Years | 0 (0.0%) | 0 (0.0%) |
| 55 to 59 Years | 0 (0.0%) | 0 (0.0%) |
| 60 to 64 Years | 26 (76.5%) | 0 (0.0%) |
| 65 to 74 Years | 0 (0.0%) | 0 (0.0%) |
| 75 Years and over | 0 (0.0%) | 0 (0.0%) |
| Total | 54 (45.8%) | 0 (0.0%) |
Employment Status by Educational Attainment in Christopher Creek
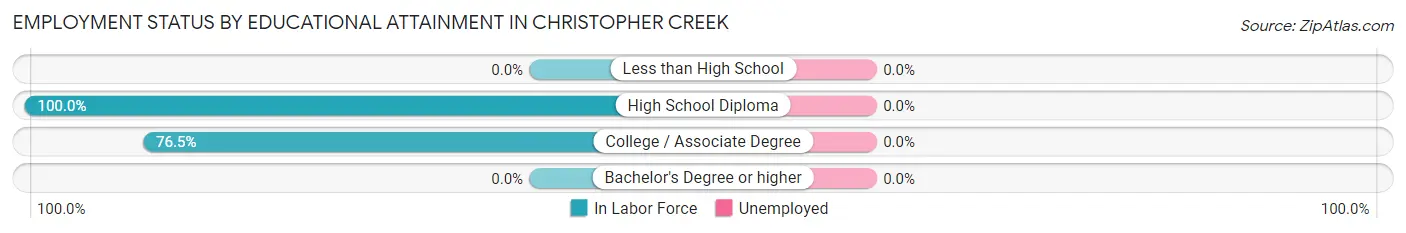
| Educational Attainment | In Labor Force | Unemployed |
| Less than High School | 0 (0.0%) | 0 (0.0%) |
| High School Diploma | 28 (100.0%) | 0 (0.0%) |
| College / Associate Degree | 26 (76.5%) | 0 (0.0%) |
| Bachelor's Degree or higher | 0 (0.0%) | 0 (0.0%) |
| Total | 54 (87.1%) | 0 (0.0%) |
Employment Occupations by Sex in Christopher Creek
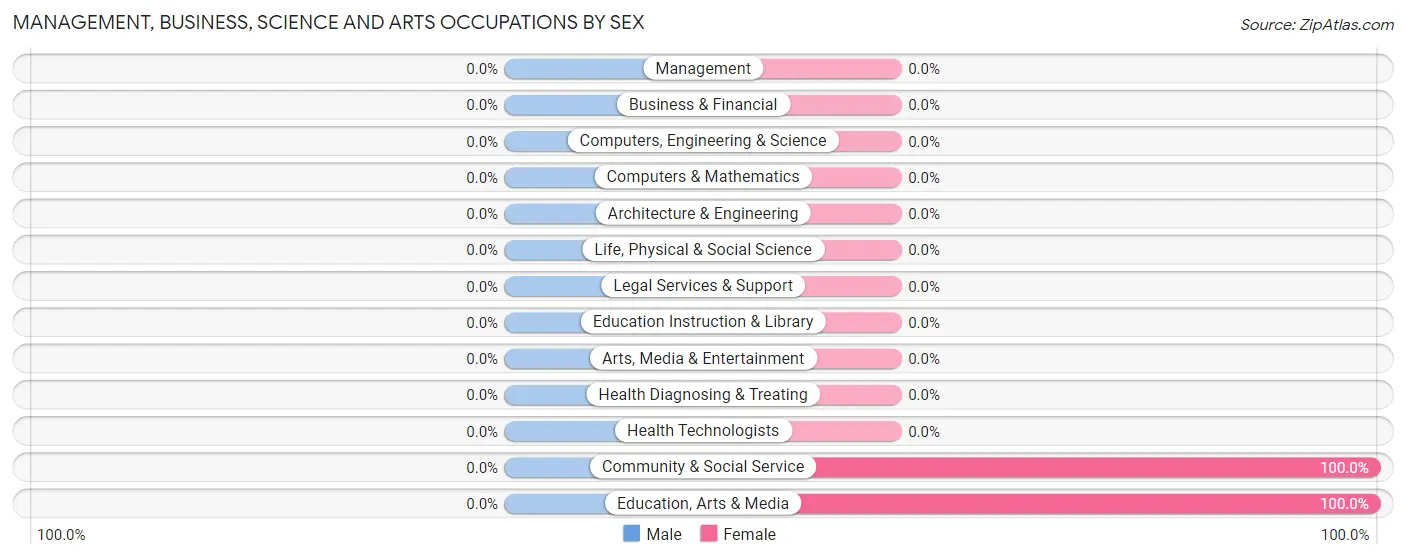
Management, Business, Science and Arts Occupations
The most common Management, Business, Science and Arts occupations in Christopher Creek are Community & Social Service (26 | 48.1%), and Education, Arts & Media (26 | 48.1%).
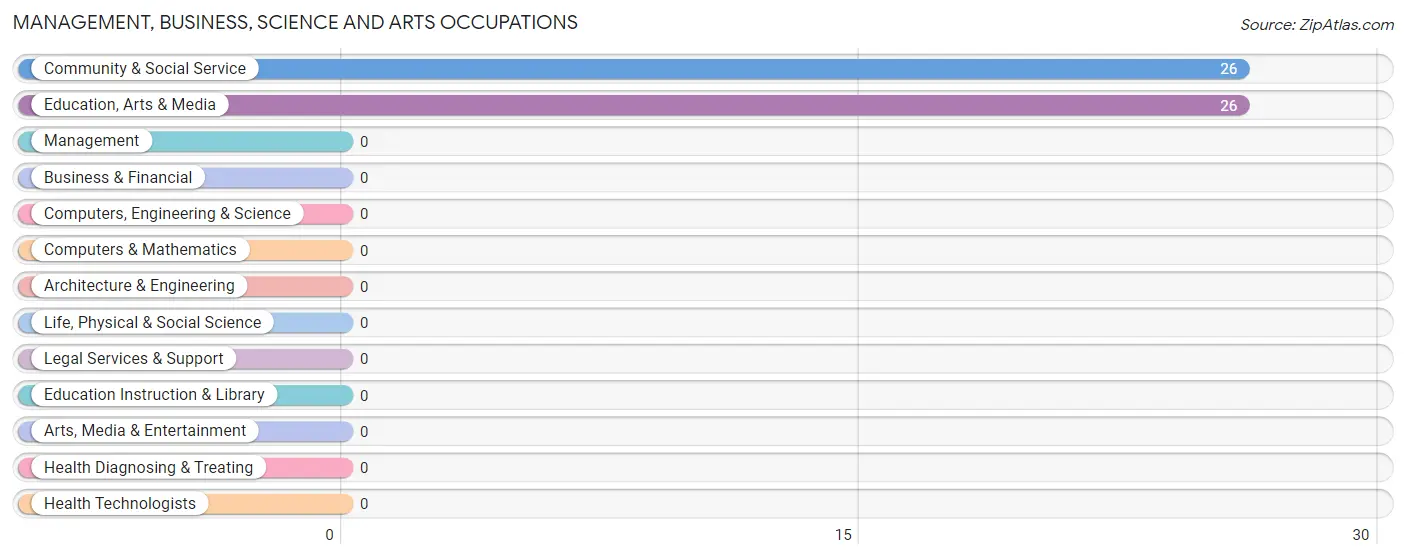
Management, Business, Science and Arts Occupations by Sex
| Occupation | Male | Female |
| Management | 0 (0.0%) | 0 (0.0%) |
| Business & Financial | 0 (0.0%) | 0 (0.0%) |
| Computers, Engineering & Science | 0 (0.0%) | 0 (0.0%) |
| Computers & Mathematics | 0 (0.0%) | 0 (0.0%) |
| Architecture & Engineering | 0 (0.0%) | 0 (0.0%) |
| Life, Physical & Social Science | 0 (0.0%) | 0 (0.0%) |
| Community & Social Service | 0 (0.0%) | 26 (100.0%) |
| Education, Arts & Media | 0 (0.0%) | 26 (100.0%) |
| Legal Services & Support | 0 (0.0%) | 0 (0.0%) |
| Education Instruction & Library | 0 (0.0%) | 0 (0.0%) |
| Arts, Media & Entertainment | 0 (0.0%) | 0 (0.0%) |
| Health Diagnosing & Treating | 0 (0.0%) | 0 (0.0%) |
| Health Technologists | 0 (0.0%) | 0 (0.0%) |
| Total (Category) | 0 (0.0%) | 26 (100.0%) |
| Total (Overall) | 28 (51.8%) | 26 (48.1%) |
Services Occupations
Services Occupations by Sex
| Occupation | Male | Female |
| Healthcare Support | 0 (0.0%) | 0 (0.0%) |
| Security & Protection | 0 (0.0%) | 0 (0.0%) |
| Firefighting & Prevention | 0 (0.0%) | 0 (0.0%) |
| Law Enforcement | 0 (0.0%) | 0 (0.0%) |
| Food Preparation & Serving | 0 (0.0%) | 0 (0.0%) |
| Cleaning & Maintenance | 0 (0.0%) | 0 (0.0%) |
| Personal Care & Service | 0 (0.0%) | 0 (0.0%) |
| Total (Category) | 0 (0.0%) | 0 (0.0%) |
| Total (Overall) | 28 (51.8%) | 26 (48.1%) |
Sales and Office Occupations
Sales and Office Occupations by Sex
| Occupation | Male | Female |
| Sales & Related | 0 (0.0%) | 0 (0.0%) |
| Office & Administration | 0 (0.0%) | 0 (0.0%) |
| Total (Category) | 0 (0.0%) | 0 (0.0%) |
| Total (Overall) | 28 (51.8%) | 26 (48.1%) |
Natural Resources, Construction and Maintenance Occupations
The most common Natural Resources, Construction and Maintenance occupations in Christopher Creek are , and Construction & Extraction (28 | 51.8%).
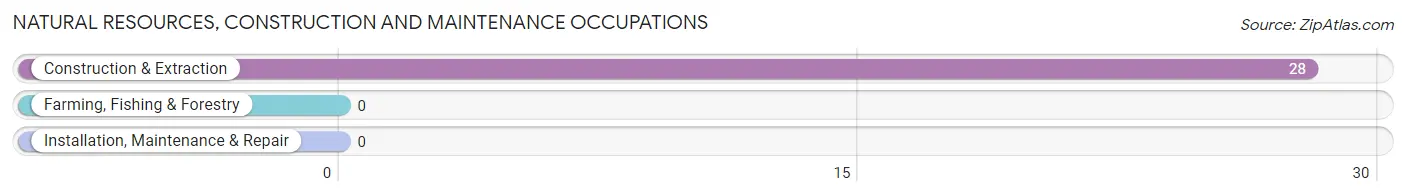
Natural Resources, Construction and Maintenance Occupations by Sex
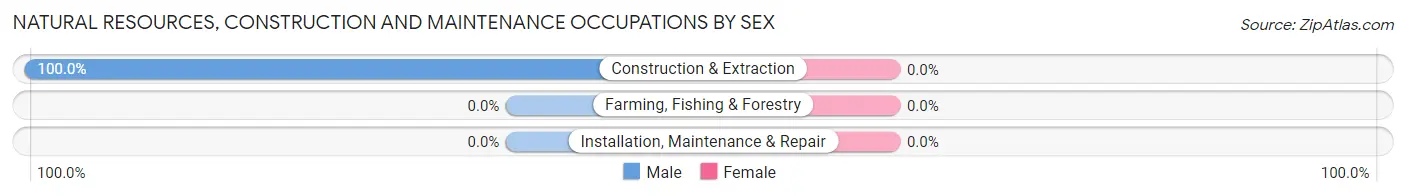
| Occupation | Male | Female |
| Farming, Fishing & Forestry | 0 (0.0%) | 0 (0.0%) |
| Construction & Extraction | 28 (100.0%) | 0 (0.0%) |
| Installation, Maintenance & Repair | 0 (0.0%) | 0 (0.0%) |
| Total (Category) | 28 (100.0%) | 0 (0.0%) |
| Total (Overall) | 28 (51.8%) | 26 (48.1%) |
Production, Transportation and Moving Occupations
Production, Transportation and Moving Occupations by Sex
| Occupation | Male | Female |
| Production | 0 (0.0%) | 0 (0.0%) |
| Transportation | 0 (0.0%) | 0 (0.0%) |
| Material Moving | 0 (0.0%) | 0 (0.0%) |
| Total (Category) | 0 (0.0%) | 0 (0.0%) |
| Total (Overall) | 28 (51.8%) | 26 (48.1%) |
Employment Industries by Sex in Christopher Creek
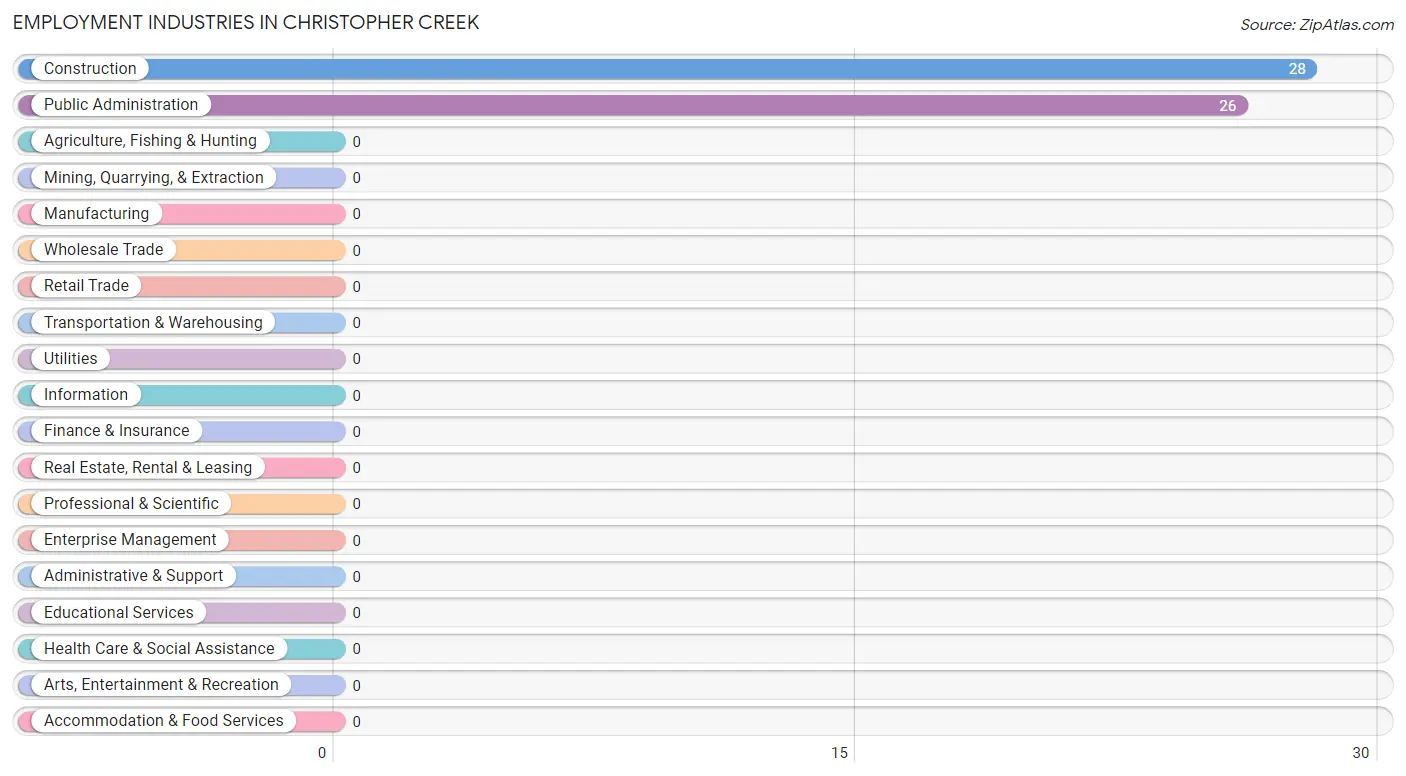
Employment Industries in Christopher Creek
The major employment industries in Christopher Creek include Construction (28 | 51.8%), and Public Administration (26 | 48.1%).
Employment Industries by Sex in Christopher Creek
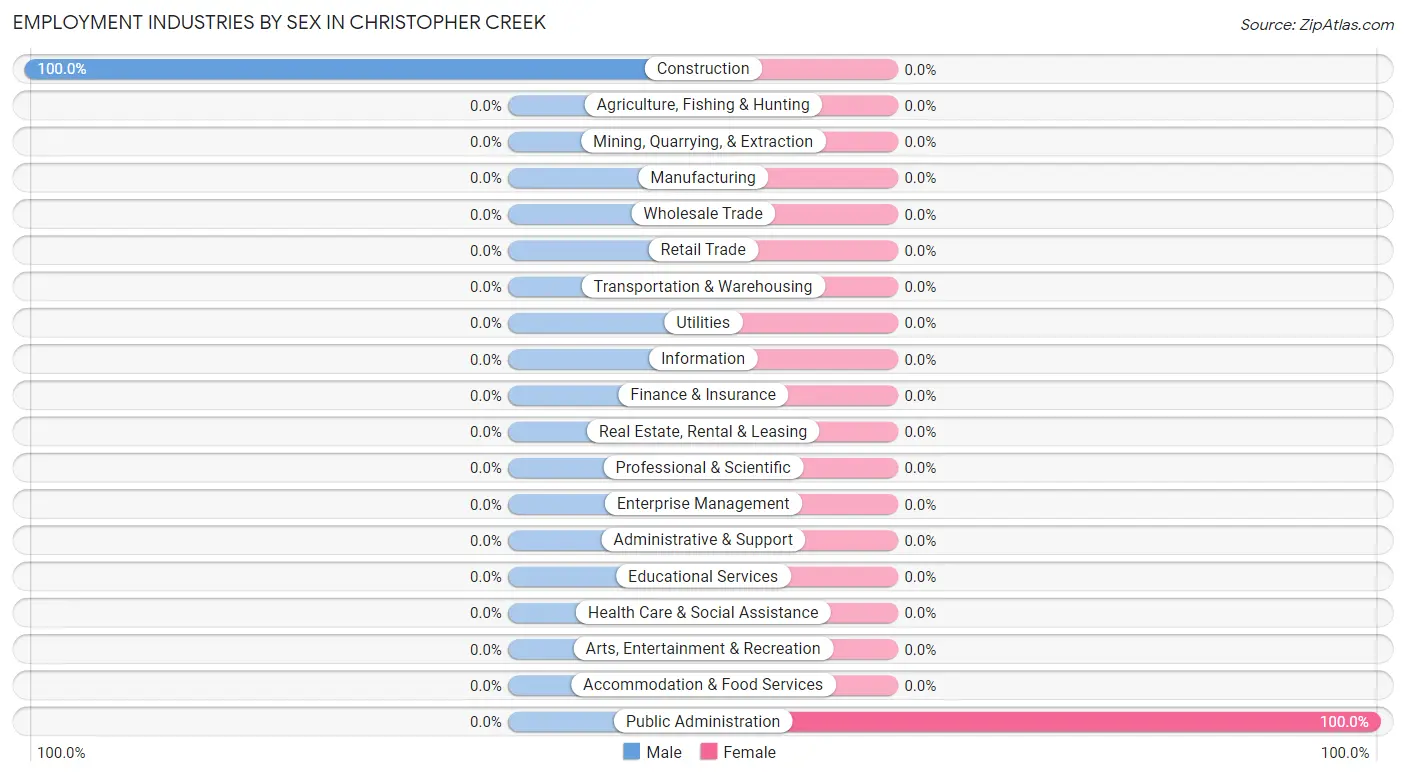
| Industry | Male | Female |
| Agriculture, Fishing & Hunting | 0 (0.0%) | 0 (0.0%) |
| Mining, Quarrying, & Extraction | 0 (0.0%) | 0 (0.0%) |
| Construction | 28 (100.0%) | 0 (0.0%) |
| Manufacturing | 0 (0.0%) | 0 (0.0%) |
| Wholesale Trade | 0 (0.0%) | 0 (0.0%) |
| Retail Trade | 0 (0.0%) | 0 (0.0%) |
| Transportation & Warehousing | 0 (0.0%) | 0 (0.0%) |
| Utilities | 0 (0.0%) | 0 (0.0%) |
| Information | 0 (0.0%) | 0 (0.0%) |
| Finance & Insurance | 0 (0.0%) | 0 (0.0%) |
| Real Estate, Rental & Leasing | 0 (0.0%) | 0 (0.0%) |
| Professional & Scientific | 0 (0.0%) | 0 (0.0%) |
| Enterprise Management | 0 (0.0%) | 0 (0.0%) |
| Administrative & Support | 0 (0.0%) | 0 (0.0%) |
| Educational Services | 0 (0.0%) | 0 (0.0%) |
| Health Care & Social Assistance | 0 (0.0%) | 0 (0.0%) |
| Arts, Entertainment & Recreation | 0 (0.0%) | 0 (0.0%) |
| Accommodation & Food Services | 0 (0.0%) | 0 (0.0%) |
| Public Administration | 0 (0.0%) | 26 (100.0%) |
| Total | 28 (51.8%) | 26 (48.1%) |
Education in Christopher Creek
School Enrollment in Christopher Creek
| School Level | # Students | % Students |
| Nursery / Preschool | 0 | 0.0% |
| Kindergarten | 0 | 0.0% |
| Elementary School | 0 | 0.0% |
| Middle School | 0 | 0.0% |
| High School | 0 | 0.0% |
| College / Undergraduate | 0 | 0.0% |
| Graduate / Professional | 0 | 0.0% |
| Total | 0 | 0.0% |
School Enrollment by Age by Funding Source in Christopher Creek
| Age Bracket | Public School | Private School |
| 3 to 4 Year Olds | 0 (0.0%) | 0 (0.0%) |
| 5 to 9 Year Old | 0 (0.0%) | 0 (0.0%) |
| 10 to 14 Year Olds | 0 (0.0%) | 0 (0.0%) |
| 15 to 17 Year Olds | 0 (0.0%) | 0 (0.0%) |
| 18 to 19 Year Olds | 0 (0.0%) | 0 (0.0%) |
| 20 to 24 Year Olds | 0 (0.0%) | 0 (0.0%) |
| 25 to 34 Year Olds | 0 (0.0%) | 0 (0.0%) |
| 35 Years and over | 0 (0.0%) | 0 (0.0%) |
| Total | 0 (0.0%) | 0 (0.0%) |
Educational Attainment by Field of Study in Christopher Creek
Engineering (9 | 42.9%), education (8 | 38.1%), and bio, nature & agricultural (4 | 19.1%) are the most common fields of study among 21 individuals in Christopher Creek who have obtained a bachelor's degree or higher.
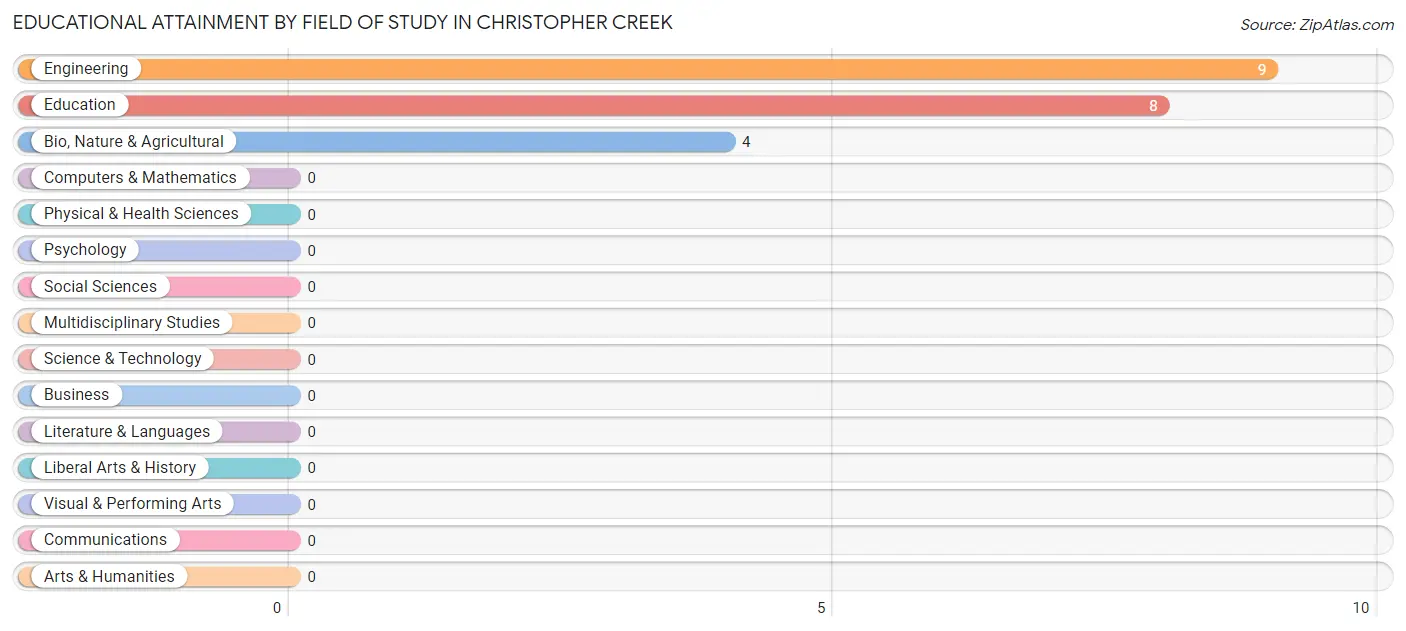
| Field of Study | # Graduates | % Graduates |
| Computers & Mathematics | 0 | 0.0% |
| Bio, Nature & Agricultural | 4 | 19.1% |
| Physical & Health Sciences | 0 | 0.0% |
| Psychology | 0 | 0.0% |
| Social Sciences | 0 | 0.0% |
| Engineering | 9 | 42.9% |
| Multidisciplinary Studies | 0 | 0.0% |
| Science & Technology | 0 | 0.0% |
| Business | 0 | 0.0% |
| Education | 8 | 38.1% |
| Literature & Languages | 0 | 0.0% |
| Liberal Arts & History | 0 | 0.0% |
| Visual & Performing Arts | 0 | 0.0% |
| Communications | 0 | 0.0% |
| Arts & Humanities | 0 | 0.0% |
| Total | 21 | 100.0% |
Transportation & Commute in Christopher Creek
Vehicle Availability by Sex in Christopher Creek
The most prevalent vehicle ownership categories in Christopher Creek are males with 1 vehicle (28, accounting for 100.0%) and females with 1 vehicle (26, making up 107.7%).
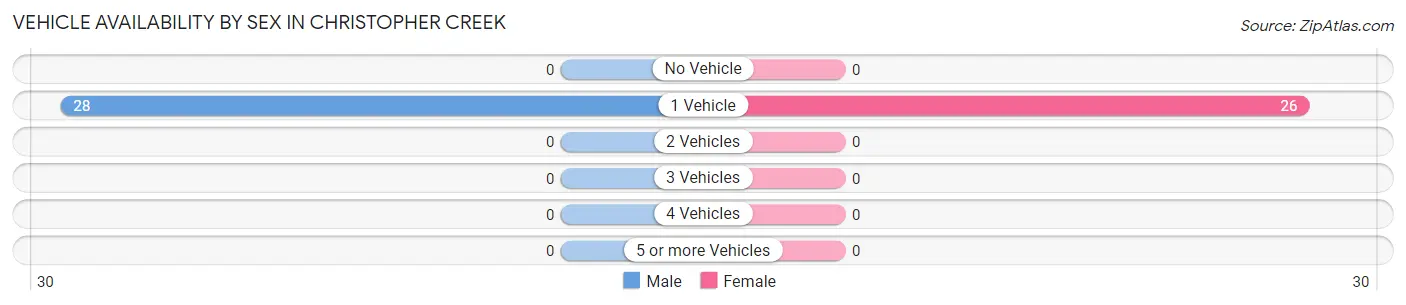
| Vehicles Available | Male | Female |
| No Vehicle | 0 (0.0%) | 0 (0.0%) |
| 1 Vehicle | 28 (100.0%) | 26 (100.0%) |
| 2 Vehicles | 0 (0.0%) | 0 (0.0%) |
| 3 Vehicles | 0 (0.0%) | 0 (0.0%) |
| 4 Vehicles | 0 (0.0%) | 0 (0.0%) |
| 5 or more Vehicles | 0 (0.0%) | 0 (0.0%) |
| Total | 28 (100.0%) | 26 (100.0%) |
Commute Time in Christopher Creek
The most frequently occuring commute durations in Christopher Creek are 25 to 29 minutes (54 commuters, 100.0%), less than 5 minutes (0 commuters, 0.0%), and 5 to 9 minutes (0 commuters, 0.0%).
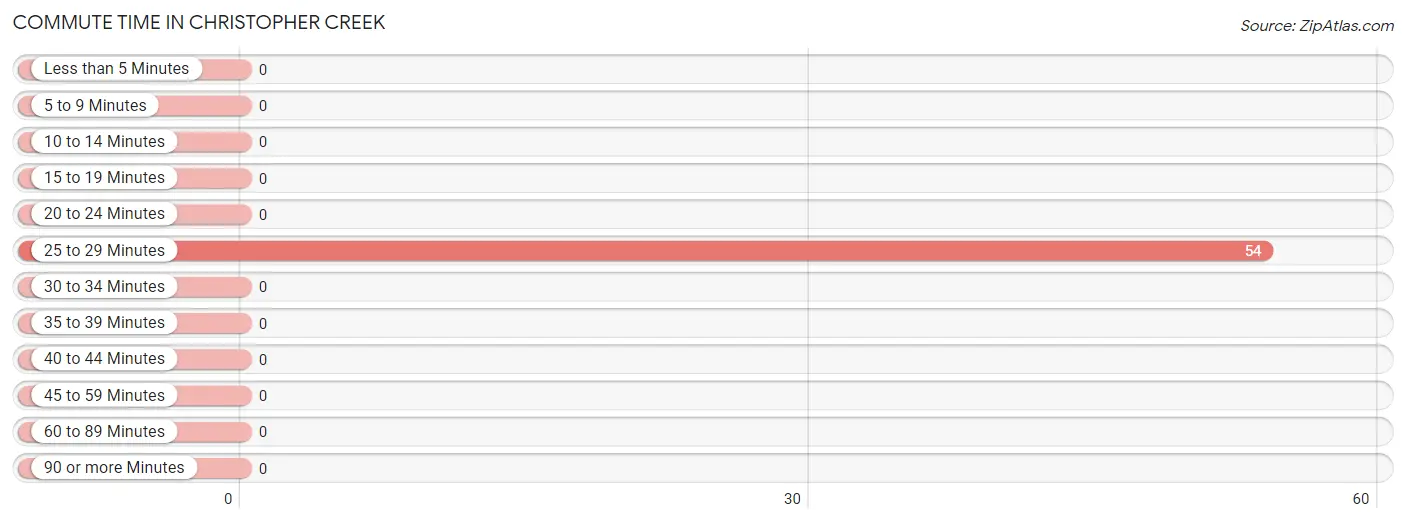
| Commute Time | # Commuters | % Commuters |
| Less than 5 Minutes | 0 | 0.0% |
| 5 to 9 Minutes | 0 | 0.0% |
| 10 to 14 Minutes | 0 | 0.0% |
| 15 to 19 Minutes | 0 | 0.0% |
| 20 to 24 Minutes | 0 | 0.0% |
| 25 to 29 Minutes | 54 | 100.0% |
| 30 to 34 Minutes | 0 | 0.0% |
| 35 to 39 Minutes | 0 | 0.0% |
| 40 to 44 Minutes | 0 | 0.0% |
| 45 to 59 Minutes | 0 | 0.0% |
| 60 to 89 Minutes | 0 | 0.0% |
| 90 or more Minutes | 0 | 0.0% |
Commute Time by Sex in Christopher Creek
The most common commute times in Christopher Creek are 25 to 29 minutes (28 commuters, 100.0%) for males and 25 to 29 minutes (26 commuters, 100.0%) for females.
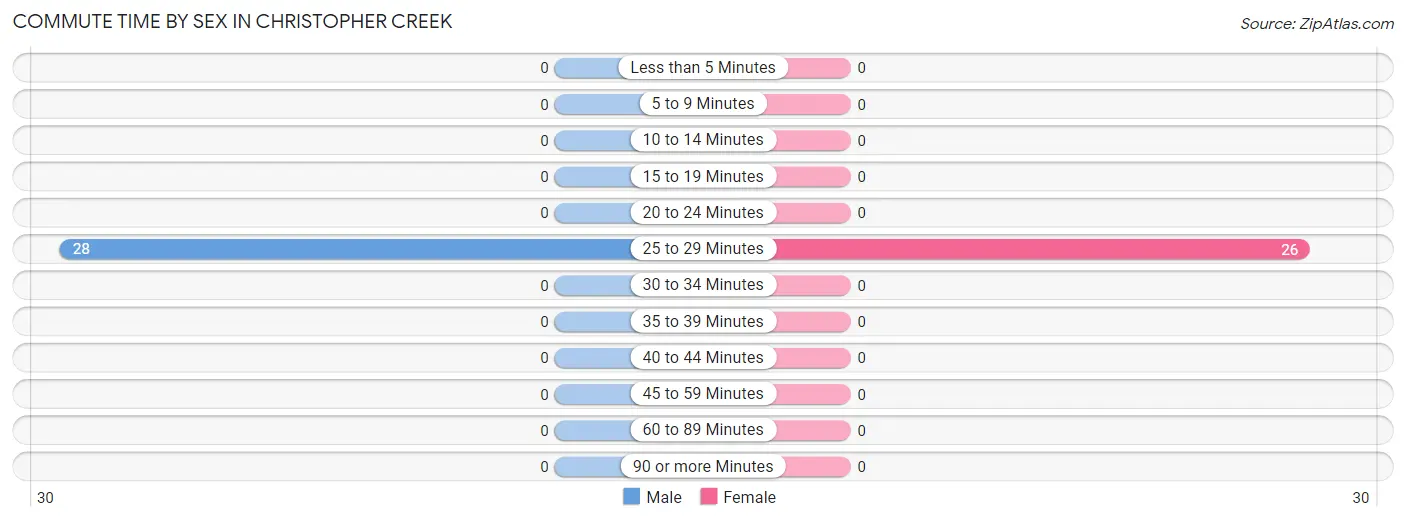
| Commute Time | Male | Female |
| Less than 5 Minutes | 0 (0.0%) | 0 (0.0%) |
| 5 to 9 Minutes | 0 (0.0%) | 0 (0.0%) |
| 10 to 14 Minutes | 0 (0.0%) | 0 (0.0%) |
| 15 to 19 Minutes | 0 (0.0%) | 0 (0.0%) |
| 20 to 24 Minutes | 0 (0.0%) | 0 (0.0%) |
| 25 to 29 Minutes | 28 (100.0%) | 26 (100.0%) |
| 30 to 34 Minutes | 0 (0.0%) | 0 (0.0%) |
| 35 to 39 Minutes | 0 (0.0%) | 0 (0.0%) |
| 40 to 44 Minutes | 0 (0.0%) | 0 (0.0%) |
| 45 to 59 Minutes | 0 (0.0%) | 0 (0.0%) |
| 60 to 89 Minutes | 0 (0.0%) | 0 (0.0%) |
| 90 or more Minutes | 0 (0.0%) | 0 (0.0%) |
Time of Departure to Work by Sex in Christopher Creek
The most frequent times of departure to work in Christopher Creek are 7:30 AM to 7:59 AM (28, 100.0%) for males and 7:30 AM to 7:59 AM (26, 100.0%) for females.
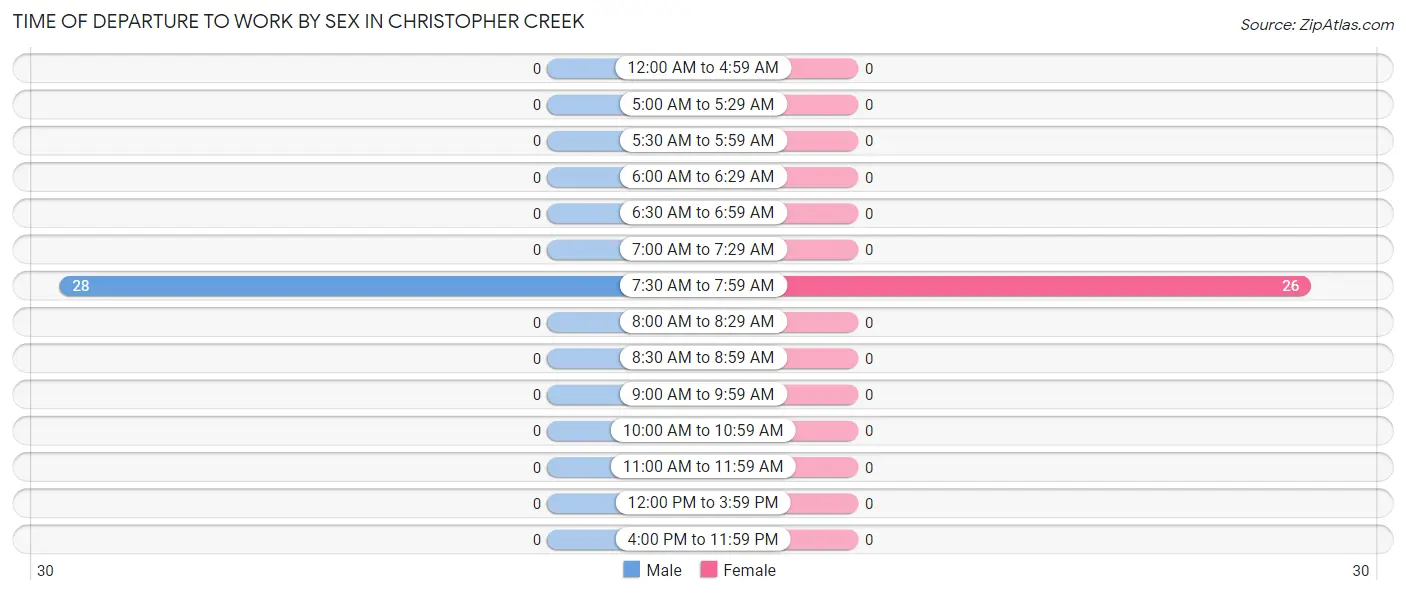
| Time of Departure | Male | Female |
| 12:00 AM to 4:59 AM | 0 (0.0%) | 0 (0.0%) |
| 5:00 AM to 5:29 AM | 0 (0.0%) | 0 (0.0%) |
| 5:30 AM to 5:59 AM | 0 (0.0%) | 0 (0.0%) |
| 6:00 AM to 6:29 AM | 0 (0.0%) | 0 (0.0%) |
| 6:30 AM to 6:59 AM | 0 (0.0%) | 0 (0.0%) |
| 7:00 AM to 7:29 AM | 0 (0.0%) | 0 (0.0%) |
| 7:30 AM to 7:59 AM | 28 (100.0%) | 26 (100.0%) |
| 8:00 AM to 8:29 AM | 0 (0.0%) | 0 (0.0%) |
| 8:30 AM to 8:59 AM | 0 (0.0%) | 0 (0.0%) |
| 9:00 AM to 9:59 AM | 0 (0.0%) | 0 (0.0%) |
| 10:00 AM to 10:59 AM | 0 (0.0%) | 0 (0.0%) |
| 11:00 AM to 11:59 AM | 0 (0.0%) | 0 (0.0%) |
| 12:00 PM to 3:59 PM | 0 (0.0%) | 0 (0.0%) |
| 4:00 PM to 11:59 PM | 0 (0.0%) | 0 (0.0%) |
| Total | 28 (100.0%) | 26 (100.0%) |
Housing Occupancy in Christopher Creek
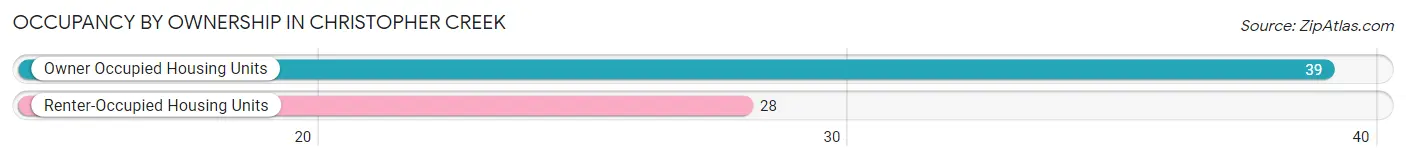
Occupancy by Ownership in Christopher Creek
Of the total 67 dwellings in Christopher Creek, owner-occupied units account for 39 (58.2%), while renter-occupied units make up 28 (41.8%).
| Occupancy | # Housing Units | % Housing Units |
| Owner Occupied Housing Units | 39 | 58.2% |
| Renter-Occupied Housing Units | 28 | 41.8% |
| Total Occupied Housing Units | 67 | 100.0% |
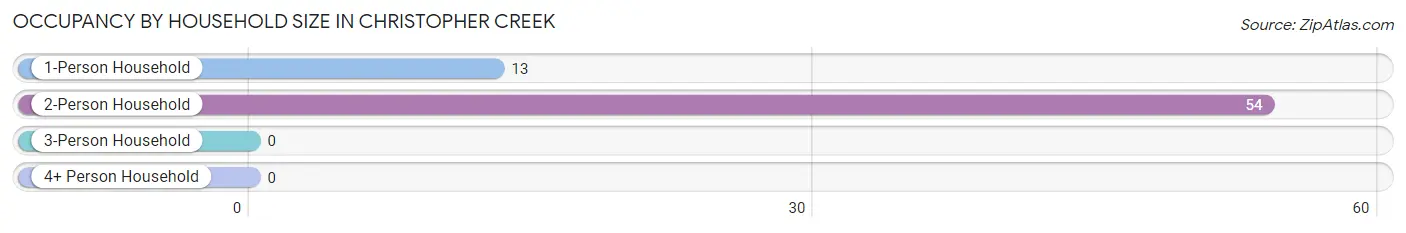
Occupancy by Household Size in Christopher Creek
| Household Size | # Housing Units | % Housing Units |
| 1-Person Household | 13 | 19.4% |
| 2-Person Household | 54 | 80.6% |
| 3-Person Household | 0 | 0.0% |
| 4+ Person Household | 0 | 0.0% |
| Total Housing Units | 67 | 100.0% |
Occupancy by Ownership by Household Size in Christopher Creek
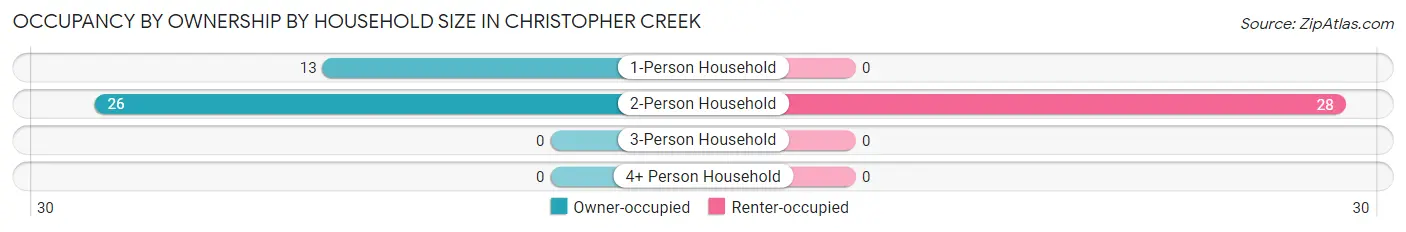
| Household Size | Owner-occupied | Renter-occupied |
| 1-Person Household | 13 (100.0%) | 0 (0.0%) |
| 2-Person Household | 26 (48.1%) | 28 (51.8%) |
| 3-Person Household | 0 (0.0%) | 0 (0.0%) |
| 4+ Person Household | 0 (0.0%) | 0 (0.0%) |
| Total Housing Units | 39 (58.2%) | 28 (41.8%) |
Occupancy by Educational Attainment in Christopher Creek
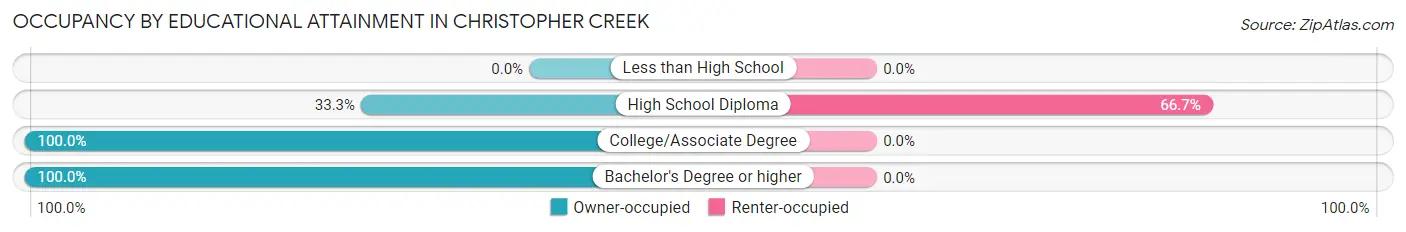
| Household Size | Owner-occupied | Renter-occupied |
| Less than High School | 0 (0.0%) | 0 (0.0%) |
| High School Diploma | 14 (33.3%) | 28 (66.7%) |
| College/Associate Degree | 16 (100.0%) | 0 (0.0%) |
| Bachelor's Degree or higher | 9 (100.0%) | 0 (0.0%) |
Occupancy by Age of Householder in Christopher Creek
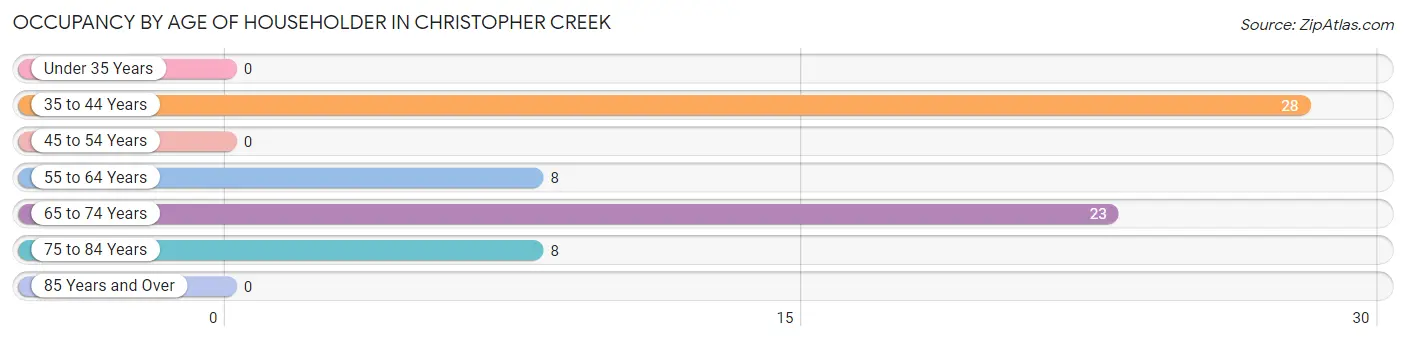
| Age Bracket | # Households | % Households |
| Under 35 Years | 0 | 0.0% |
| 35 to 44 Years | 28 | 41.8% |
| 45 to 54 Years | 0 | 0.0% |
| 55 to 64 Years | 8 | 11.9% |
| 65 to 74 Years | 23 | 34.3% |
| 75 to 84 Years | 8 | 11.9% |
| 85 Years and Over | 0 | 0.0% |
| Total | 67 | 100.0% |
Housing Finances in Christopher Creek
Median Income by Occupancy in Christopher Creek
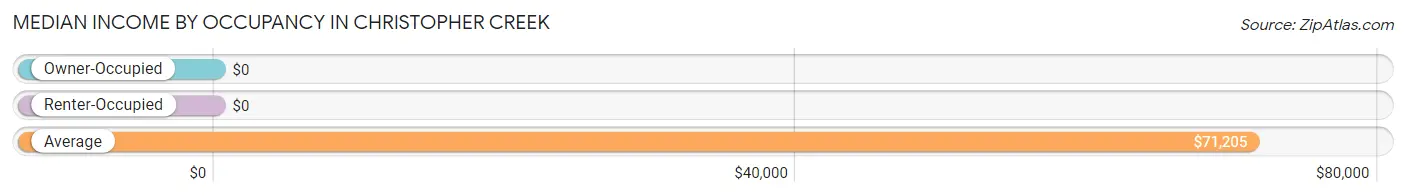
| Occupancy Type | # Households | Median Income |
| Owner-Occupied | 39 (58.2%) | $0 |
| Renter-Occupied | 28 (41.8%) | $0 |
| Average | 67 (100.0%) | $71,205 |
Occupancy by Householder Income Bracket in Christopher Creek
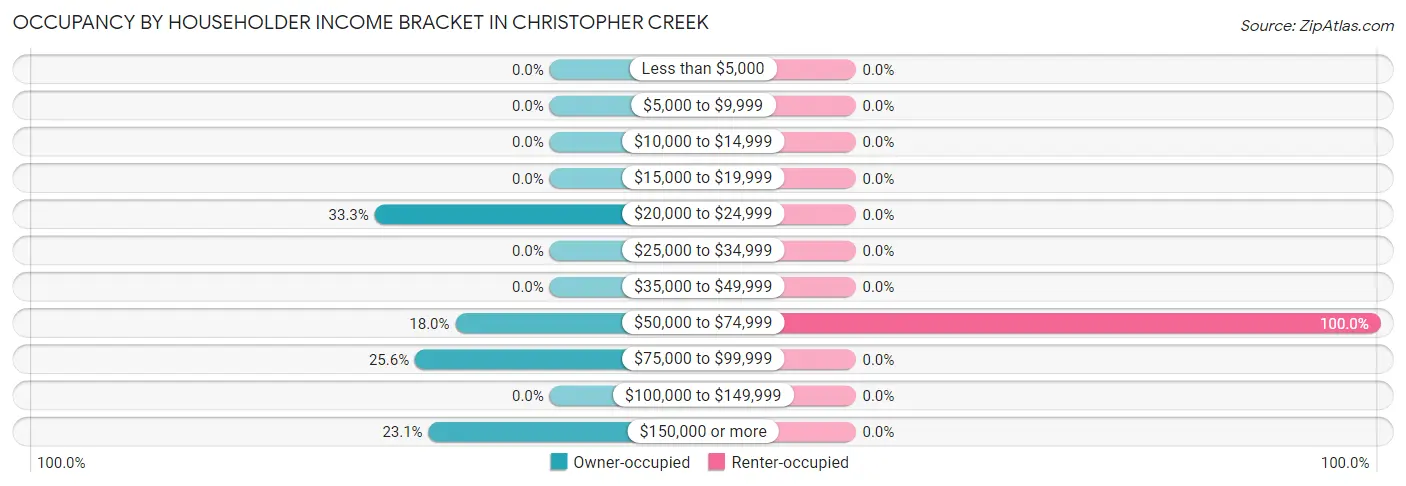
| Income Bracket | Owner-occupied | Renter-occupied |
| Less than $5,000 | 0 (0.0%) | 0 (0.0%) |
| $5,000 to $9,999 | 0 (0.0%) | 0 (0.0%) |
| $10,000 to $14,999 | 0 (0.0%) | 0 (0.0%) |
| $15,000 to $19,999 | 0 (0.0%) | 0 (0.0%) |
| $20,000 to $24,999 | 13 (33.3%) | 0 (0.0%) |
| $25,000 to $34,999 | 0 (0.0%) | 0 (0.0%) |
| $35,000 to $49,999 | 0 (0.0%) | 0 (0.0%) |
| $50,000 to $74,999 | 7 (17.9%) | 28 (100.0%) |
| $75,000 to $99,999 | 10 (25.6%) | 0 (0.0%) |
| $100,000 to $149,999 | 0 (0.0%) | 0 (0.0%) |
| $150,000 or more | 9 (23.1%) | 0 (0.0%) |
| Total | 39 (100.0%) | 28 (100.0%) |
Monthly Housing Cost Tiers in Christopher Creek
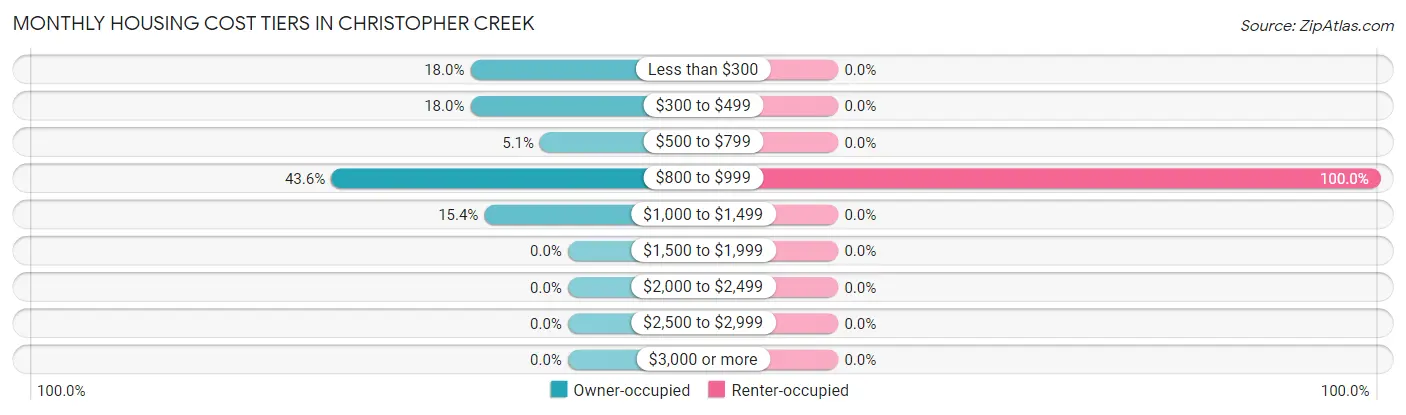
| Monthly Cost | Owner-occupied | Renter-occupied |
| Less than $300 | 7 (17.9%) | 0 (0.0%) |
| $300 to $499 | 7 (17.9%) | 0 (0.0%) |
| $500 to $799 | 2 (5.1%) | 0 (0.0%) |
| $800 to $999 | 17 (43.6%) | 28 (100.0%) |
| $1,000 to $1,499 | 6 (15.4%) | 0 (0.0%) |
| $1,500 to $1,999 | 0 (0.0%) | 0 (0.0%) |
| $2,000 to $2,499 | 0 (0.0%) | 0 (0.0%) |
| $2,500 to $2,999 | 0 (0.0%) | 0 (0.0%) |
| $3,000 or more | 0 (0.0%) | 0 (0.0%) |
| Total | 39 (100.0%) | 28 (100.0%) |
Physical Housing Characteristics in Christopher Creek
Housing Structures in Christopher Creek
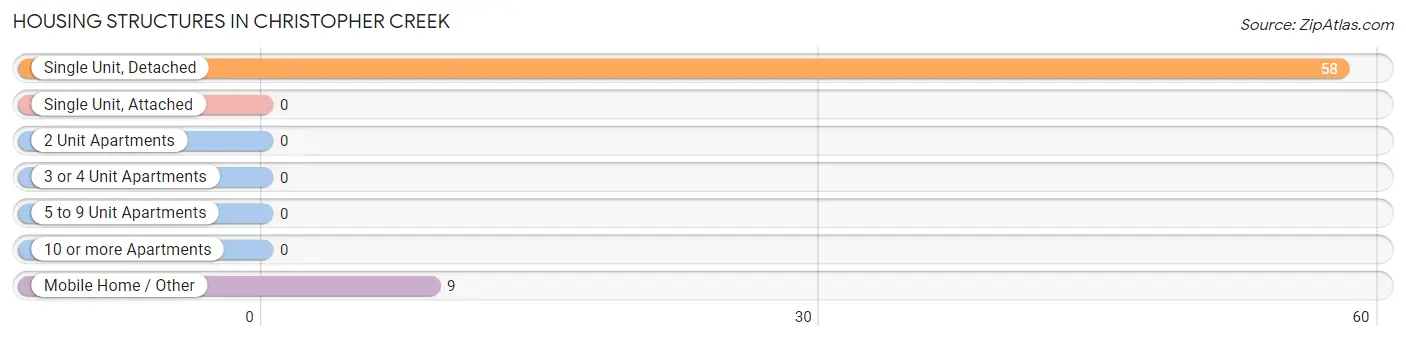
| Structure Type | # Housing Units | % Housing Units |
| Single Unit, Detached | 58 | 86.6% |
| Single Unit, Attached | 0 | 0.0% |
| 2 Unit Apartments | 0 | 0.0% |
| 3 or 4 Unit Apartments | 0 | 0.0% |
| 5 to 9 Unit Apartments | 0 | 0.0% |
| 10 or more Apartments | 0 | 0.0% |
| Mobile Home / Other | 9 | 13.4% |
| Total | 67 | 100.0% |
Housing Structures by Occupancy in Christopher Creek
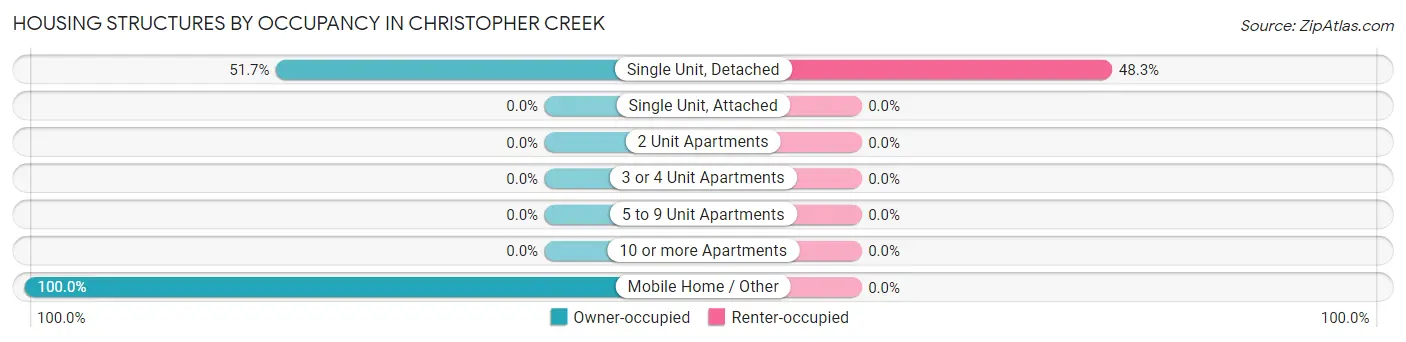
| Structure Type | Owner-occupied | Renter-occupied |
| Single Unit, Detached | 30 (51.7%) | 28 (48.3%) |
| Single Unit, Attached | 0 (0.0%) | 0 (0.0%) |
| 2 Unit Apartments | 0 (0.0%) | 0 (0.0%) |
| 3 or 4 Unit Apartments | 0 (0.0%) | 0 (0.0%) |
| 5 to 9 Unit Apartments | 0 (0.0%) | 0 (0.0%) |
| 10 or more Apartments | 0 (0.0%) | 0 (0.0%) |
| Mobile Home / Other | 9 (100.0%) | 0 (0.0%) |
| Total | 39 (58.2%) | 28 (41.8%) |
Housing Structures by Number of Rooms in Christopher Creek
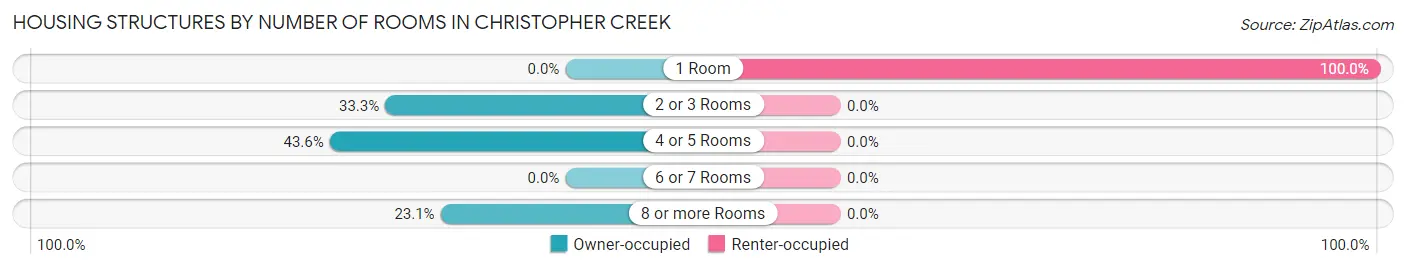
| Number of Rooms | Owner-occupied | Renter-occupied |
| 1 Room | 0 (0.0%) | 28 (100.0%) |
| 2 or 3 Rooms | 13 (33.3%) | 0 (0.0%) |
| 4 or 5 Rooms | 17 (43.6%) | 0 (0.0%) |
| 6 or 7 Rooms | 0 (0.0%) | 0 (0.0%) |
| 8 or more Rooms | 9 (23.1%) | 0 (0.0%) |
| Total | 39 (100.0%) | 28 (100.0%) |
Housing Structure by Heating Type in Christopher Creek
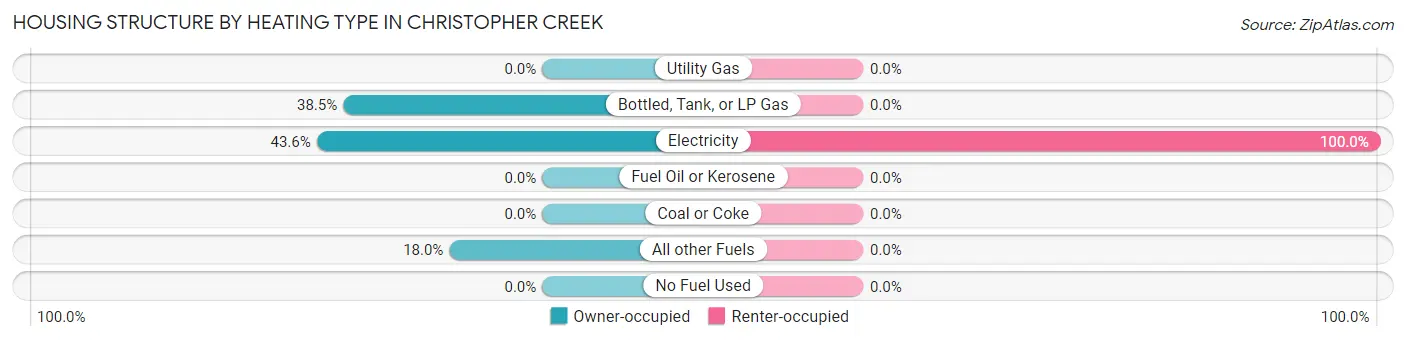
| Heating Type | Owner-occupied | Renter-occupied |
| Utility Gas | 0 (0.0%) | 0 (0.0%) |
| Bottled, Tank, or LP Gas | 15 (38.5%) | 0 (0.0%) |
| Electricity | 17 (43.6%) | 28 (100.0%) |
| Fuel Oil or Kerosene | 0 (0.0%) | 0 (0.0%) |
| Coal or Coke | 0 (0.0%) | 0 (0.0%) |
| All other Fuels | 7 (17.9%) | 0 (0.0%) |
| No Fuel Used | 0 (0.0%) | 0 (0.0%) |
| Total | 39 (100.0%) | 28 (100.0%) |
Household Vehicle Usage in Christopher Creek
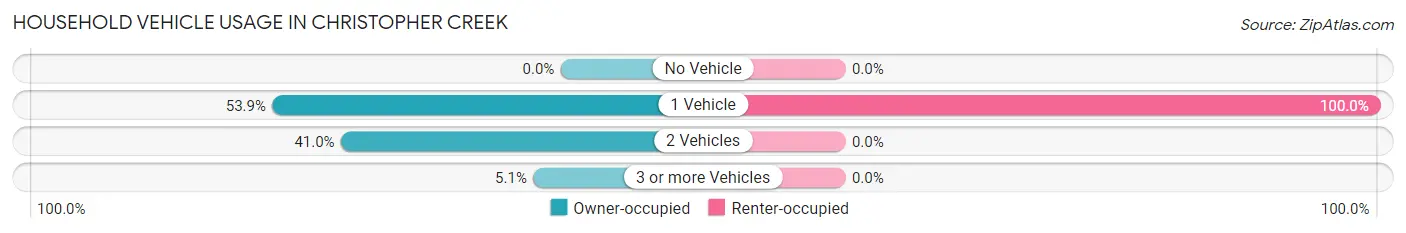
| Vehicles per Household | Owner-occupied | Renter-occupied |
| No Vehicle | 0 (0.0%) | 0 (0.0%) |
| 1 Vehicle | 21 (53.8%) | 28 (100.0%) |
| 2 Vehicles | 16 (41.0%) | 0 (0.0%) |
| 3 or more Vehicles | 2 (5.1%) | 0 (0.0%) |
| Total | 39 (100.0%) | 28 (100.0%) |
Real Estate & Mortgages in Christopher Creek
Real Estate and Mortgage Overview in Christopher Creek
| Characteristic | Without Mortgage | With Mortgage |
| Housing Units | 25 | 14 |
| Median Property Value | - | - |
| Median Household Income | - | - |
| Monthly Housing Costs | - | - |
| Real Estate Taxes | - | - |
Property Value by Mortgage Status in Christopher Creek
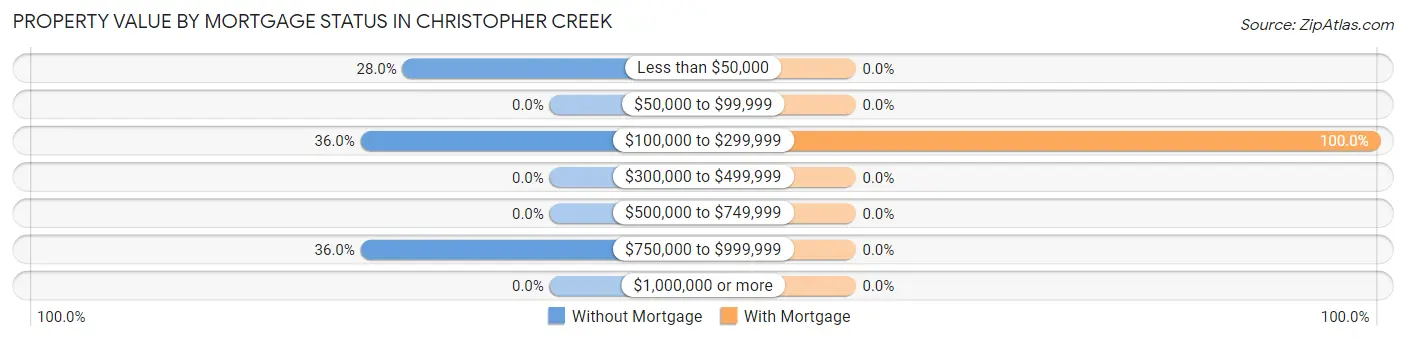
| Property Value | Without Mortgage | With Mortgage |
| Less than $50,000 | 7 (28.0%) | 0 (0.0%) |
| $50,000 to $99,999 | 0 (0.0%) | 0 (0.0%) |
| $100,000 to $299,999 | 9 (36.0%) | 14 (100.0%) |
| $300,000 to $499,999 | 0 (0.0%) | 0 (0.0%) |
| $500,000 to $749,999 | 0 (0.0%) | 0 (0.0%) |
| $750,000 to $999,999 | 9 (36.0%) | 0 (0.0%) |
| $1,000,000 or more | 0 (0.0%) | 0 (0.0%) |
| Total | 25 (100.0%) | 14 (100.0%) |
Household Income by Mortgage Status in Christopher Creek
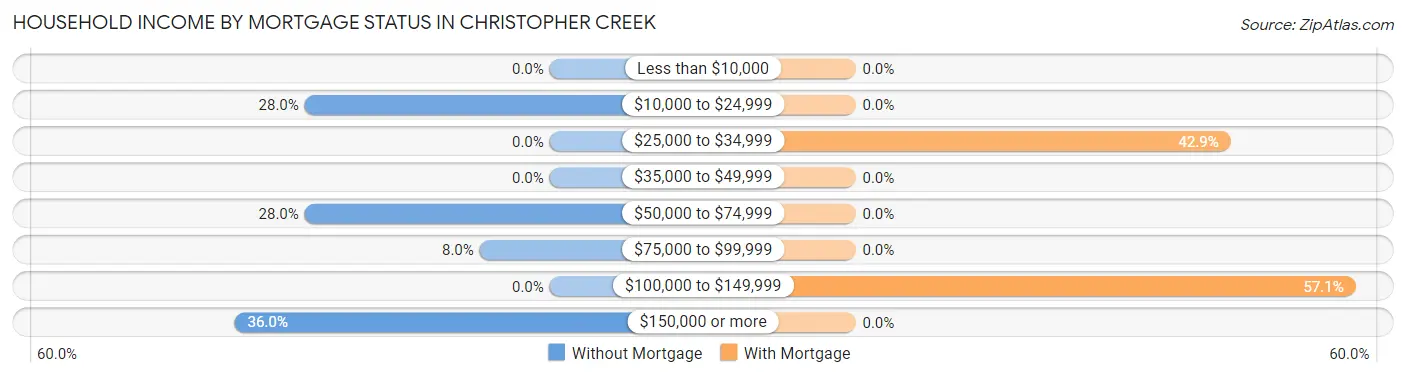
| Household Income | Without Mortgage | With Mortgage |
| Less than $10,000 | 0 (0.0%) | 0 (0.0%) |
| $10,000 to $24,999 | 7 (28.0%) | 0 (0.0%) |
| $25,000 to $34,999 | 0 (0.0%) | 6 (42.9%) |
| $35,000 to $49,999 | 0 (0.0%) | 0 (0.0%) |
| $50,000 to $74,999 | 7 (28.0%) | 0 (0.0%) |
| $75,000 to $99,999 | 2 (8.0%) | 0 (0.0%) |
| $100,000 to $149,999 | 0 (0.0%) | 8 (57.1%) |
| $150,000 or more | 9 (36.0%) | 0 (0.0%) |
| Total | 25 (100.0%) | 14 (100.0%) |
Property Value to Household Income Ratio in Christopher Creek
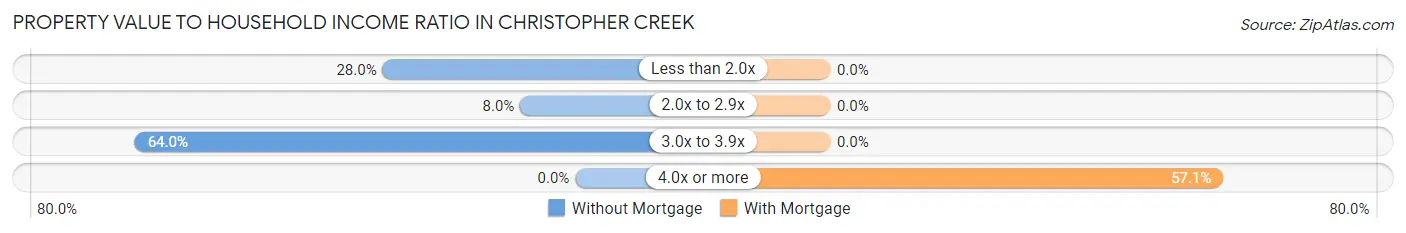
| Value-to-Income Ratio | Without Mortgage | With Mortgage |
| Less than 2.0x | 7 (28.0%) | 0 (0.0%) |
| 2.0x to 2.9x | 2 (8.0%) | 0 (0.0%) |
| 3.0x to 3.9x | 16 (64.0%) | 0 (0.0%) |
| 4.0x or more | 0 (0.0%) | 8 (57.1%) |
| Total | 25 (100.0%) | 14 (100.0%) |
Real Estate Taxes by Mortgage Status in Christopher Creek
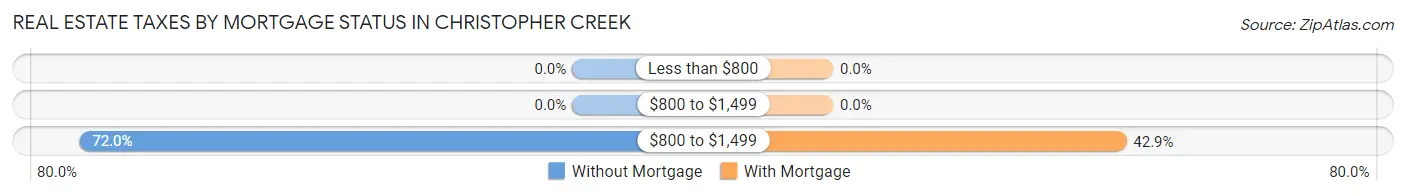
| Property Taxes | Without Mortgage | With Mortgage |
| Less than $800 | 0 (0.0%) | 0 (0.0%) |
| $800 to $1,499 | 0 (0.0%) | 0 (0.0%) |
| $800 to $1,499 | 18 (72.0%) | 6 (42.9%) |
| Total | 25 (100.0%) | 14 (100.0%) |
Health & Disability in Christopher Creek
Health Insurance Coverage by Age in Christopher Creek
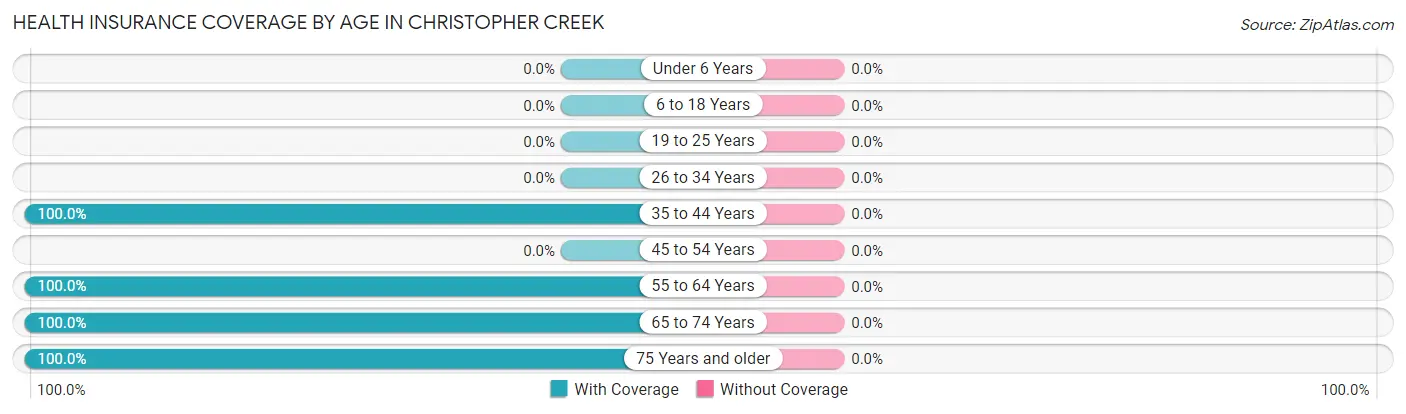
| Age Bracket | With Coverage | Without Coverage |
| Under 6 Years | 0 (0.0%) | 0 (0.0%) |
| 6 to 18 Years | 0 (0.0%) | 0 (0.0%) |
| 19 to 25 Years | 0 (0.0%) | 0 (0.0%) |
| 26 to 34 Years | 0 (0.0%) | 0 (0.0%) |
| 35 to 44 Years | 28 (100.0%) | 0 (0.0%) |
| 45 to 54 Years | 0 (0.0%) | 0 (0.0%) |
| 55 to 64 Years | 34 (100.0%) | 0 (0.0%) |
| 65 to 74 Years | 34 (100.0%) | 0 (0.0%) |
| 75 Years and older | 22 (100.0%) | 0 (0.0%) |
| Total | 118 (100.0%) | 0 (0.0%) |
Health Insurance Coverage by Citizenship Status in Christopher Creek
| Citizenship Status | With Coverage | Without Coverage |
| Native Born | 0 (0.0%) | 0 (0.0%) |
| Foreign Born, Citizen | 0 (0.0%) | 0 (0.0%) |
| Foreign Born, not a Citizen | 0 (0.0%) | 0 (0.0%) |
Health Insurance Coverage by Household Income in Christopher Creek
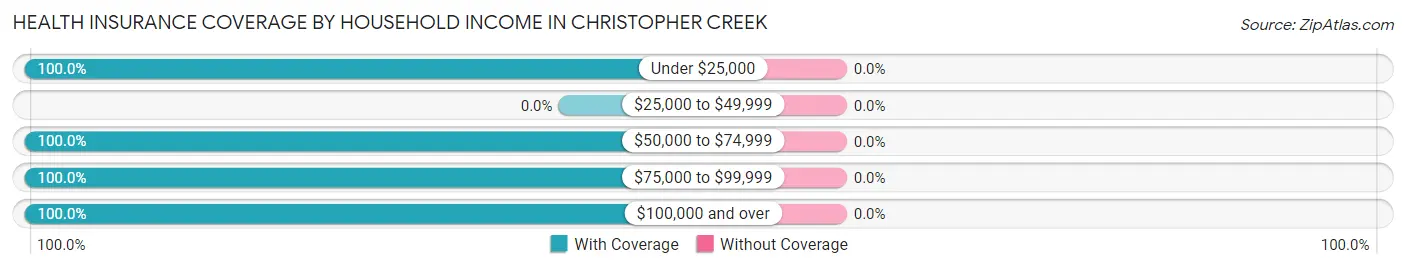
| Household Income | With Coverage | Without Coverage |
| Under $25,000 | 13 (100.0%) | 0 (0.0%) |
| $25,000 to $49,999 | 0 (0.0%) | 0 (0.0%) |
| $50,000 to $74,999 | 67 (100.0%) | 0 (0.0%) |
| $75,000 to $99,999 | 21 (100.0%) | 0 (0.0%) |
| $100,000 and over | 17 (100.0%) | 0 (0.0%) |
Public vs Private Health Insurance Coverage by Age in Christopher Creek
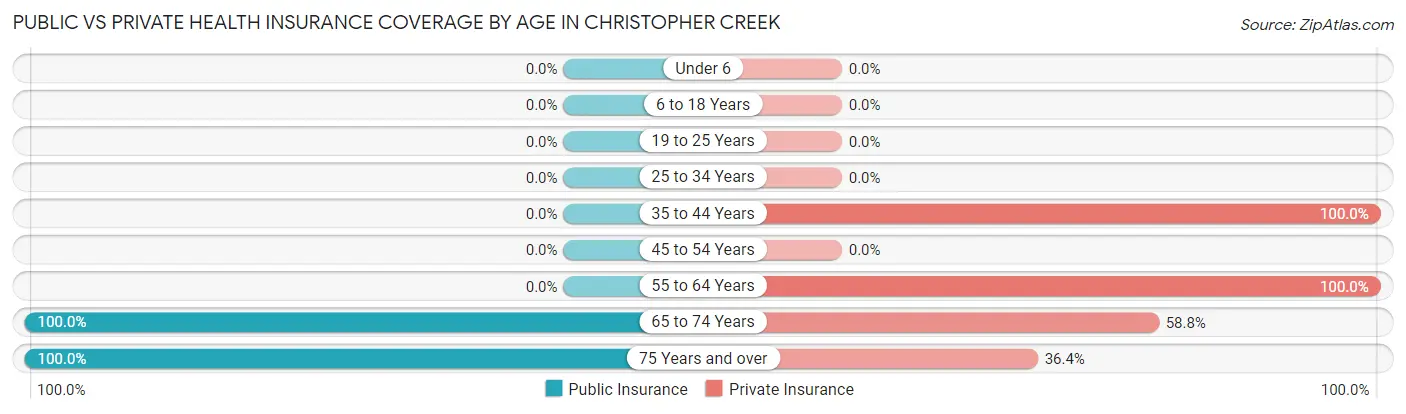
| Age Bracket | Public Insurance | Private Insurance |
| Under 6 | 0 (0.0%) | 0 (0.0%) |
| 6 to 18 Years | 0 (0.0%) | 0 (0.0%) |
| 19 to 25 Years | 0 (0.0%) | 0 (0.0%) |
| 25 to 34 Years | 0 (0.0%) | 0 (0.0%) |
| 35 to 44 Years | 0 (0.0%) | 28 (100.0%) |
| 45 to 54 Years | 0 (0.0%) | 0 (0.0%) |
| 55 to 64 Years | 0 (0.0%) | 34 (100.0%) |
| 65 to 74 Years | 34 (100.0%) | 20 (58.8%) |
| 75 Years and over | 22 (100.0%) | 8 (36.4%) |
| Total | 56 (47.5%) | 90 (76.3%) |
Disability Status by Sex by Age in Christopher Creek
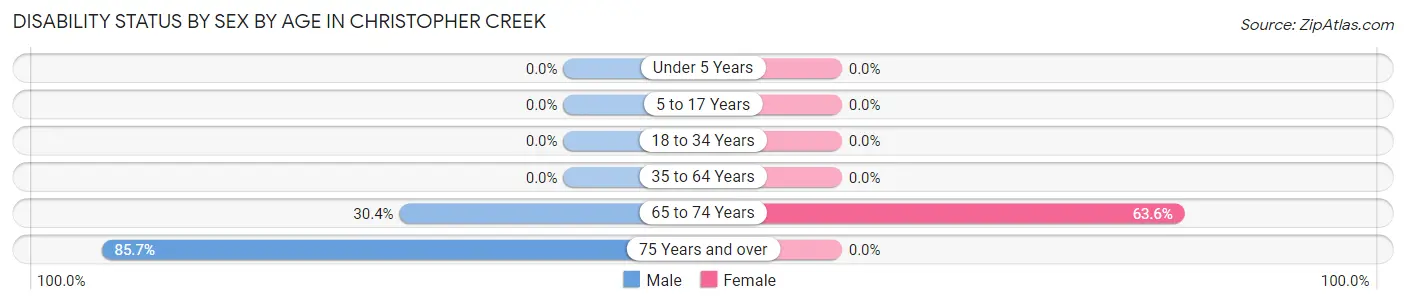
| Age Bracket | Male | Female |
| Under 5 Years | 0 (0.0%) | 0 (0.0%) |
| 5 to 17 Years | 0 (0.0%) | 0 (0.0%) |
| 18 to 34 Years | 0 (0.0%) | 0 (0.0%) |
| 35 to 64 Years | 0 (0.0%) | 0 (0.0%) |
| 65 to 74 Years | 7 (30.4%) | 7 (63.6%) |
| 75 Years and over | 12 (85.7%) | 0 (0.0%) |
Disability Class by Sex by Age in Christopher Creek
Disability Class: Hearing Difficulty
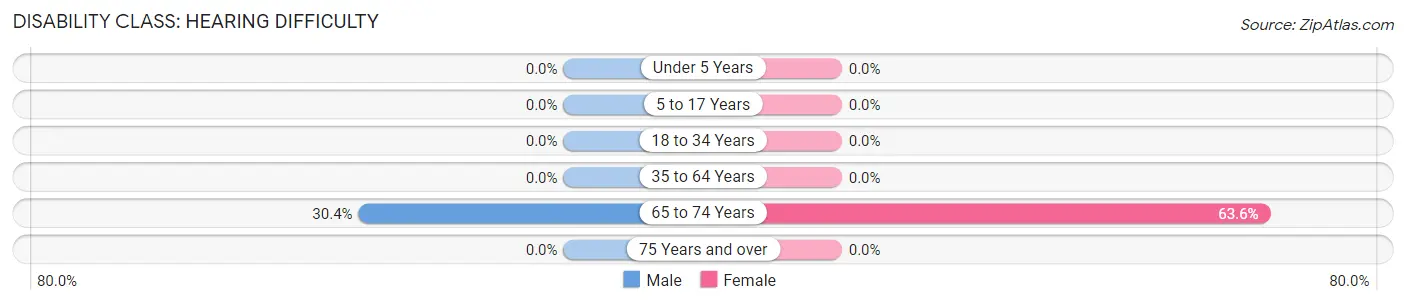
| Age Bracket | Male | Female |
| Under 5 Years | 0 (0.0%) | 0 (0.0%) |
| 5 to 17 Years | 0 (0.0%) | 0 (0.0%) |
| 18 to 34 Years | 0 (0.0%) | 0 (0.0%) |
| 35 to 64 Years | 0 (0.0%) | 0 (0.0%) |
| 65 to 74 Years | 7 (30.4%) | 7 (63.6%) |
| 75 Years and over | 0 (0.0%) | 0 (0.0%) |
Disability Class: Vision Difficulty
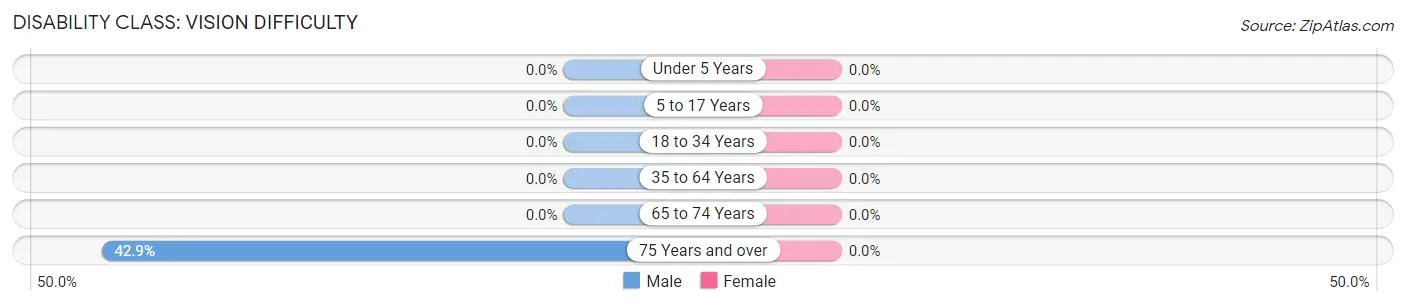
| Age Bracket | Male | Female |
| Under 5 Years | 0 (0.0%) | 0 (0.0%) |
| 5 to 17 Years | 0 (0.0%) | 0 (0.0%) |
| 18 to 34 Years | 0 (0.0%) | 0 (0.0%) |
| 35 to 64 Years | 0 (0.0%) | 0 (0.0%) |
| 65 to 74 Years | 0 (0.0%) | 0 (0.0%) |
| 75 Years and over | 6 (42.9%) | 0 (0.0%) |
Disability Class: Cognitive Difficulty
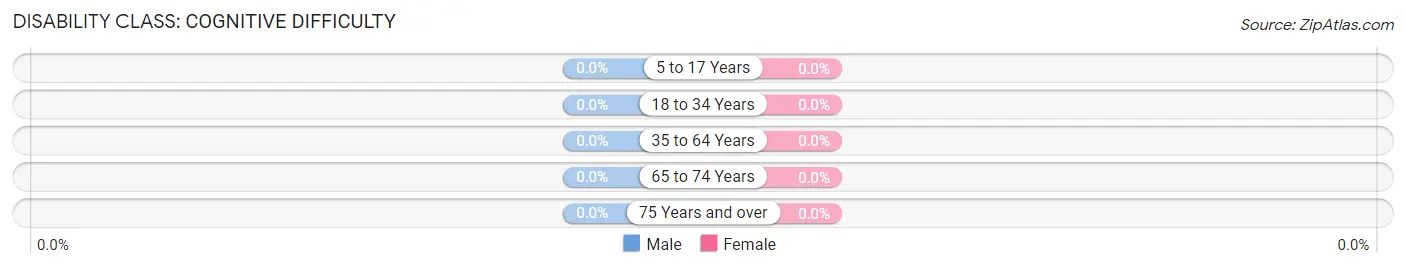
| Age Bracket | Male | Female |
| 5 to 17 Years | 0 (0.0%) | 0 (0.0%) |
| 18 to 34 Years | 0 (0.0%) | 0 (0.0%) |
| 35 to 64 Years | 0 (0.0%) | 0 (0.0%) |
| 65 to 74 Years | 0 (0.0%) | 0 (0.0%) |
| 75 Years and over | 0 (0.0%) | 0 (0.0%) |
Disability Class: Ambulatory Difficulty
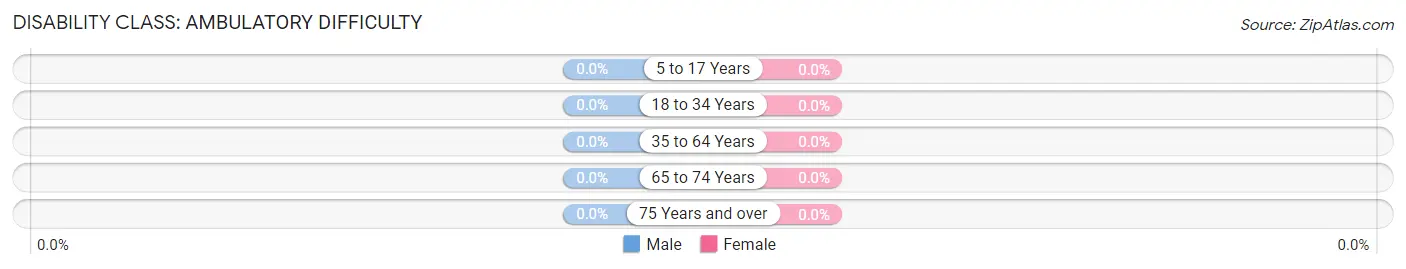
| Age Bracket | Male | Female |
| 5 to 17 Years | 0 (0.0%) | 0 (0.0%) |
| 18 to 34 Years | 0 (0.0%) | 0 (0.0%) |
| 35 to 64 Years | 0 (0.0%) | 0 (0.0%) |
| 65 to 74 Years | 0 (0.0%) | 0 (0.0%) |
| 75 Years and over | 0 (0.0%) | 0 (0.0%) |
Disability Class: Self-Care Difficulty
| Age Bracket | Male | Female |
| 5 to 17 Years | 0 (0.0%) | 0 (0.0%) |
| 18 to 34 Years | 0 (0.0%) | 0 (0.0%) |
| 35 to 64 Years | 0 (0.0%) | 0 (0.0%) |
| 65 to 74 Years | 0 (0.0%) | 0 (0.0%) |
| 75 Years and over | 0 (0.0%) | 0 (0.0%) |
Technology Access in Christopher Creek
Computing Device Access in Christopher Creek
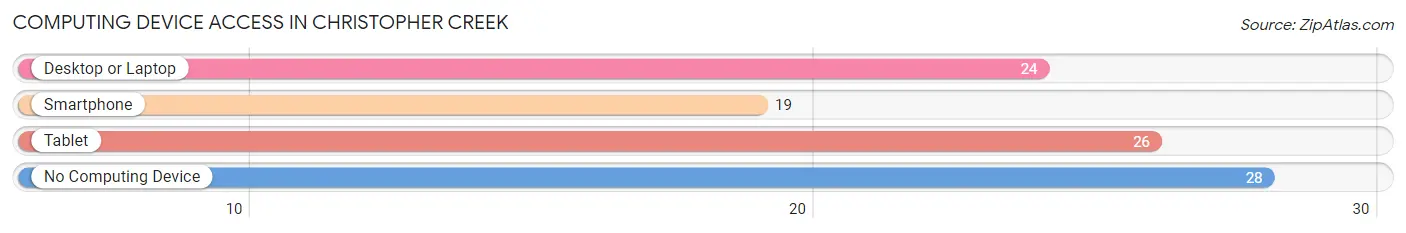
| Device Type | # Households | % Households |
| Desktop or Laptop | 24 | 35.8% |
| Smartphone | 19 | 28.4% |
| Tablet | 26 | 38.8% |
| No Computing Device | 28 | 41.8% |
| Total | 67 | 100.0% |
Internet Access in Christopher Creek
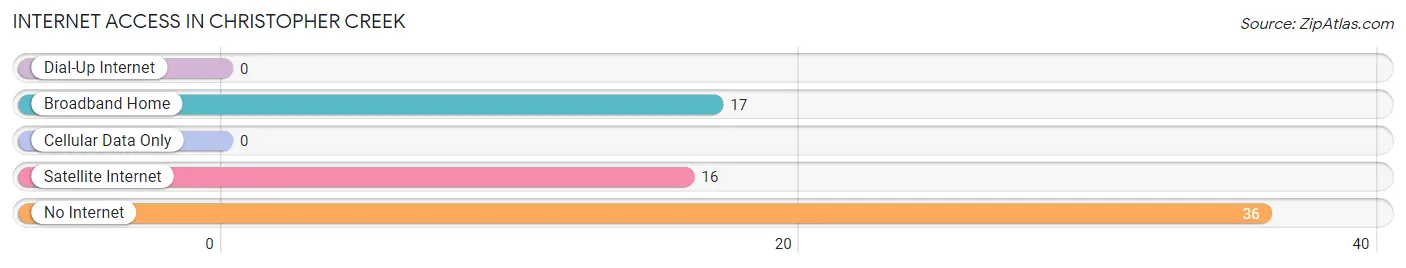
| Internet Type | # Households | % Households |
| Dial-Up Internet | 0 | 0.0% |
| Broadband Home | 17 | 25.4% |
| Cellular Data Only | 0 | 0.0% |
| Satellite Internet | 16 | 23.9% |
| No Internet | 36 | 53.7% |
| Total | 67 | 100.0% |
Christopher Creek Summary
Creek, Arizona is a small unincorporated community located in the Tonto National Forest in Gila County, Arizona. It is situated in the Mogollon Rim region of the state, approximately 40 miles northeast of Phoenix. The town was founded in the late 1800s by ranchers and miners, and is now home to a population of approximately 500 people.
History
The area that is now Christopher Creek was first settled by ranchers and miners in the late 1800s. The town was originally known as “Mogollon”, after the nearby Mogollon Rim. In the early 1900s, the town was renamed “Christopher Creek” after Christopher J. Miller, a local rancher and miner.
The town was initially a small, rural community, but in the 1950s, the area began to experience a population boom. This was due to the construction of the nearby Roosevelt Dam, which provided water and electricity to the area. The dam also created the nearby Roosevelt Lake, which is now a popular recreational destination.
In the 1970s, the town began to experience a decline in population as people moved away to larger cities. However, in the 1980s, the town began to experience a resurgence in population as people moved back to the area to take advantage of the recreational opportunities provided by the nearby lake.
Geography
Christopher Creek is located in the Mogollon Rim region of Arizona, approximately 40 miles northeast of Phoenix. The town is situated in the Tonto National Forest, and is surrounded by the Apache-Sitgreaves National Forest. The town is located at an elevation of 4,800 feet, and is situated in a mountainous region.
The town is located near the confluence of Christopher Creek and the East Verde River. The nearby Roosevelt Lake is a popular recreational destination, and is located approximately 10 miles from the town.
Economy
The economy of Christopher Creek is largely based on tourism and recreation. The nearby Roosevelt Lake is a popular destination for fishing, boating, and camping, and the town is home to several resorts and campgrounds. The town is also home to several restaurants, bars, and stores.
The town is also home to several small businesses, including a sawmill, a woodworking shop, and a general store. The town is also home to a post office, a library, and a fire station.
Demographics
As of the 2010 census, the population of Christopher Creek was 498. The town is predominantly white, with approximately 95% of the population identifying as white. The median household income in the town is $41,250, and the median age is 44.
Conclusion
Christopher Creek is a small unincorporated community located in the Tonto National Forest in Gila County, Arizona. The town was founded in the late 1800s by ranchers and miners, and is now home to a population of approximately 500 people. The economy of the town is largely based on tourism and recreation, and the town is home to several resorts, campgrounds, restaurants, bars, and stores. The town is predominantly white, with approximately 95% of the population identifying as white.
Common Questions
What is Per Capita Income in Christopher Creek?
Per Capita income in Christopher Creek is $50,631.
What is the Median Family Income in Christopher Creek?
Median Family Income in Christopher Creek is $71,786.
What is the Median Household income in Christopher Creek?
Median Household Income in Christopher Creek is $71,205.
What is Inequality or Gini Index in Christopher Creek?
Inequality or Gini Index in Christopher Creek is 0.37.
What is the Total Population of Christopher Creek?
Total Population of Christopher Creek is 118.
What is the Total Male Population of Christopher Creek?
Total Male Population of Christopher Creek is 65.
What is the Total Female Population of Christopher Creek?
Total Female Population of Christopher Creek is 53.
What is the Ratio of Males per 100 Females in Christopher Creek?
There are 122.64 Males per 100 Females in Christopher Creek.
What is the Ratio of Females per 100 Males in Christopher Creek?
There are 81.54 Females per 100 Males in Christopher Creek.
What is the Median Population Age in Christopher Creek?
Median Population Age in Christopher Creek is 64.9 Years.
What is the Average Family Size in Christopher Creek
Average Family Size in Christopher Creek is 1.9 People.
What is the Average Household Size in Christopher Creek
Average Household Size in Christopher Creek is 1.8 People.
How Large is the Labor Force in Christopher Creek?
There are 54 People in the Labor Forcein in Christopher Creek.
What is the Percentage of People in the Labor Force in Christopher Creek?
45.8% of People are in the Labor Force in Christopher Creek.