Zip Codes with the Highest Percentage of Population with a Degree in Liberal Arts and History in Eureka Springs, AR
RELATED REPORTS & OPTIONS
Liberal Arts and History
Eureka Springs
Compare Zip Codes
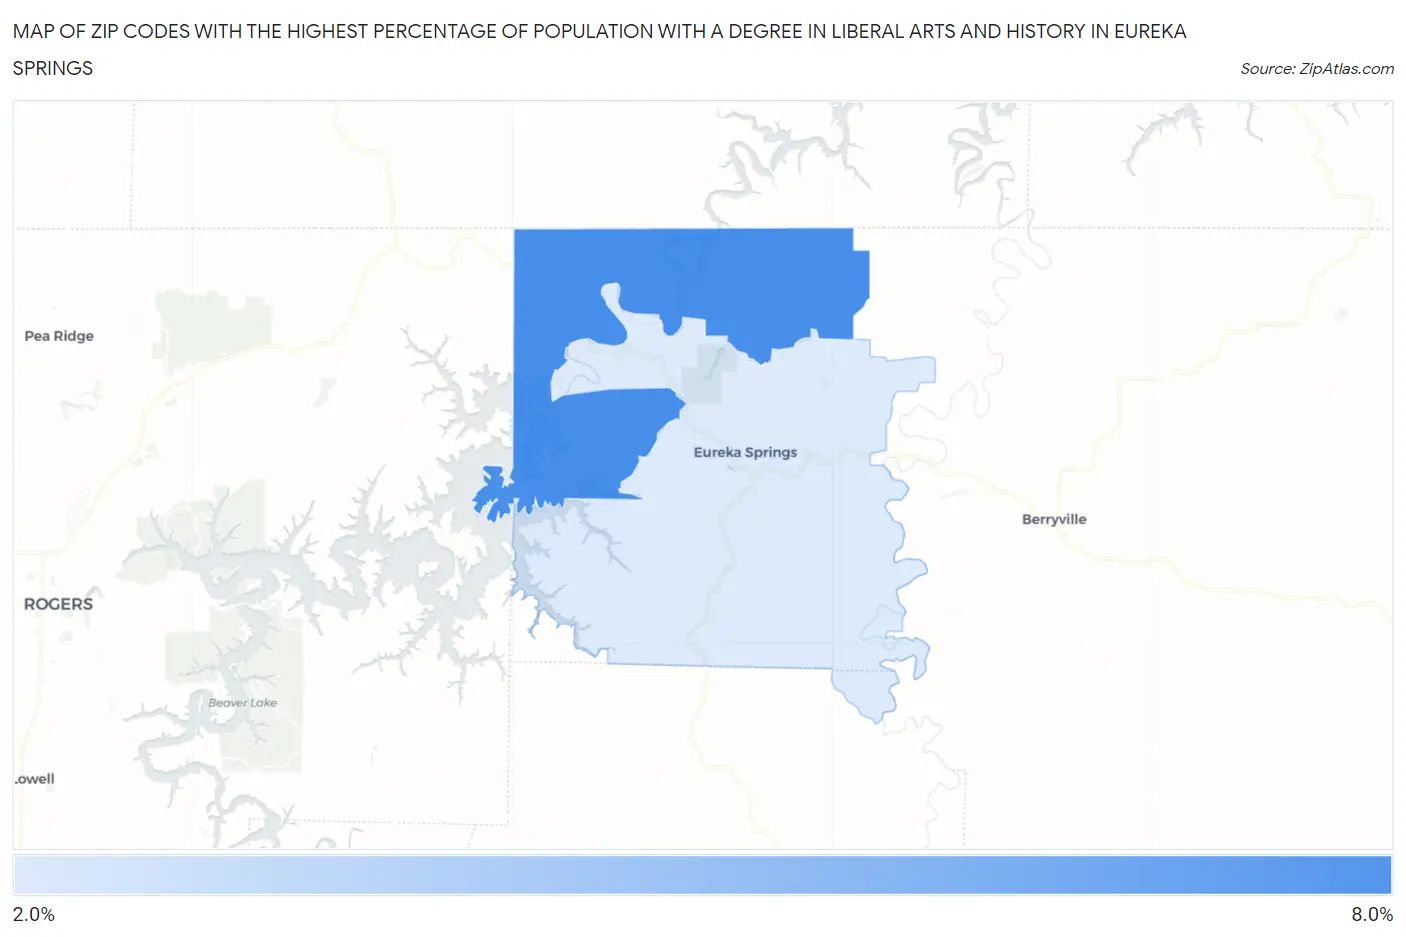
Map of Zip Codes with the Highest Percentage of Population with a Degree in Liberal Arts and History in Eureka Springs
2.3%
6.7%
Zip Codes with the Highest Percentage of Population with a Degree in Liberal Arts and History in Eureka Springs, AR
| Zip Code | % Graduates | vs State | vs National | |
| 1. | 72631 | 6.7% | 4.9%(+1.84)#121 | 4.9%(+1.87)#6,856 |
| 2. | 72632 | 2.3% | 4.9%(-2.62)#265 | 4.9%(-2.59)#20,574 |
1
Common Questions
What are the Top Zip Codes with the Highest Percentage of Population with a Degree in Liberal Arts and History in Eureka Springs, AR?
Top Zip Codes with the Highest Percentage of Population with a Degree in Liberal Arts and History in Eureka Springs, AR are:
What zip code has the Highest Percentage of Population with a Degree in Liberal Arts and History in Eureka Springs, AR?
72631 has the Highest Percentage of Population with a Degree in Liberal Arts and History in Eureka Springs, AR with 6.7%.
What is the Percentage of Population with a Degree in Liberal Arts and History in Eureka Springs, AR?
Percentage of Population with a Degree in Liberal Arts and History in Eureka Springs is 2.4%.
What is the Percentage of Population with a Degree in Liberal Arts and History in Arkansas?
Percentage of Population with a Degree in Liberal Arts and History in Arkansas is 4.9%.
What is the Percentage of Population with a Degree in Liberal Arts and History in the United States?
Percentage of Population with a Degree in Liberal Arts and History in the United States is 4.9%.