Bicknell, UT Map & Demographics
Bicknell Map
Bicknell Overview
$35,366
PER CAPITA INCOME
$102,639
AVG FAMILY INCOME
$90,833
AVG HOUSEHOLD INCOME
32.0%
WAGE / INCOME GAP [ % ]
68.0¢/ $1
WAGE / INCOME GAP [ $ ]
0.37
INEQUALITY / GINI INDEX
413
TOTAL POPULATION
179
MALE POPULATION
234
FEMALE POPULATION
76.50
MALES / 100 FEMALES
130.73
FEMALES / 100 MALES
40.6
MEDIAN AGE
2.5
AVG FAMILY SIZE
2.4
AVG HOUSEHOLD SIZE
241
LABOR FORCE [ PEOPLE ]
72.4%
PERCENT IN LABOR FORCE
0.8%
UNEMPLOYMENT RATE
Bicknell Zip Codes
Bicknell Area Codes
Income in Bicknell
Income Overview in Bicknell
Per Capita Income in Bicknell is $35,366, while median incomes of families and households are $102,639 and $90,833 respectively.
| Characteristic | Number | Measure |
| Per Capita Income | 413 | $35,366 |
| Median Family Income | 148 | $102,639 |
| Mean Family Income | 148 | $100,769 |
| Median Household Income | 176 | $90,833 |
| Mean Household Income | 176 | $93,023 |
| Income Deficit | 148 | $0 |
| Wage / Income Gap (%) | 413 | 32.01% |
| Wage / Income Gap ($) | 413 | 67.99¢ per $1 |
| Gini / Inequality Index | 413 | 0.37 |
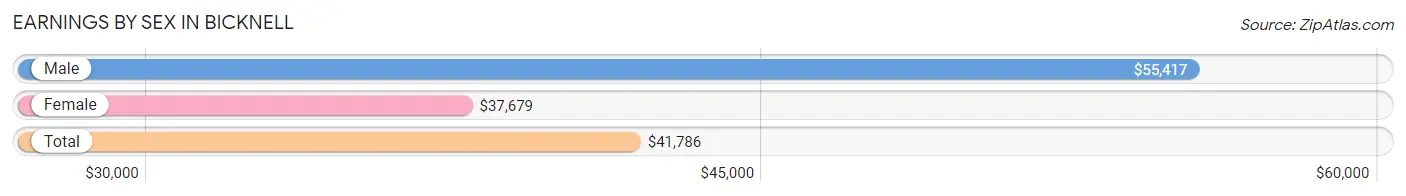
Earnings by Sex in Bicknell
Average Earnings in Bicknell are $41,786, $55,417 for men and $37,679 for women, a difference of 32.0%.
| Sex | Number | Average Earnings |
| Male | 112 (45.5%) | $55,417 |
| Female | 134 (54.5%) | $37,679 |
| Total | 246 (100.0%) | $41,786 |
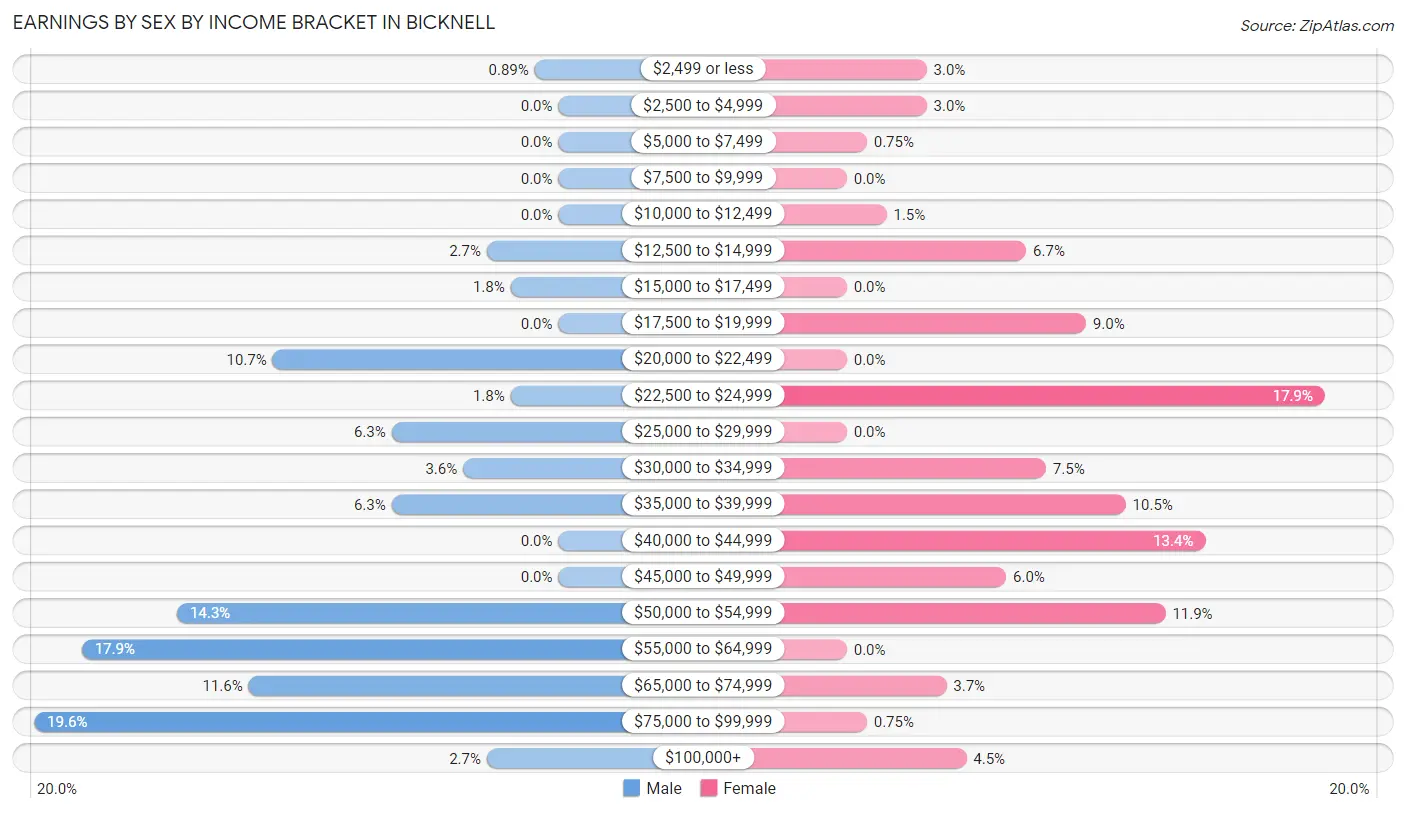
Earnings by Sex by Income Bracket in Bicknell
The most common earnings brackets in Bicknell are $75,000 to $99,999 for men (22 | 19.6%) and $22,500 to $24,999 for women (24 | 17.9%).
| Income | Male | Female |
| $2,499 or less | 1 (0.9%) | 4 (3.0%) |
| $2,500 to $4,999 | 0 (0.0%) | 4 (3.0%) |
| $5,000 to $7,499 | 0 (0.0%) | 1 (0.7%) |
| $7,500 to $9,999 | 0 (0.0%) | 0 (0.0%) |
| $10,000 to $12,499 | 0 (0.0%) | 2 (1.5%) |
| $12,500 to $14,999 | 3 (2.7%) | 9 (6.7%) |
| $15,000 to $17,499 | 2 (1.8%) | 0 (0.0%) |
| $17,500 to $19,999 | 0 (0.0%) | 12 (9.0%) |
| $20,000 to $22,499 | 12 (10.7%) | 0 (0.0%) |
| $22,500 to $24,999 | 2 (1.8%) | 24 (17.9%) |
| $25,000 to $29,999 | 7 (6.2%) | 0 (0.0%) |
| $30,000 to $34,999 | 4 (3.6%) | 10 (7.5%) |
| $35,000 to $39,999 | 7 (6.2%) | 14 (10.4%) |
| $40,000 to $44,999 | 0 (0.0%) | 18 (13.4%) |
| $45,000 to $49,999 | 0 (0.0%) | 8 (6.0%) |
| $50,000 to $54,999 | 16 (14.3%) | 16 (11.9%) |
| $55,000 to $64,999 | 20 (17.9%) | 0 (0.0%) |
| $65,000 to $74,999 | 13 (11.6%) | 5 (3.7%) |
| $75,000 to $99,999 | 22 (19.6%) | 1 (0.7%) |
| $100,000+ | 3 (2.7%) | 6 (4.5%) |
| Total | 112 (100.0%) | 134 (100.0%) |
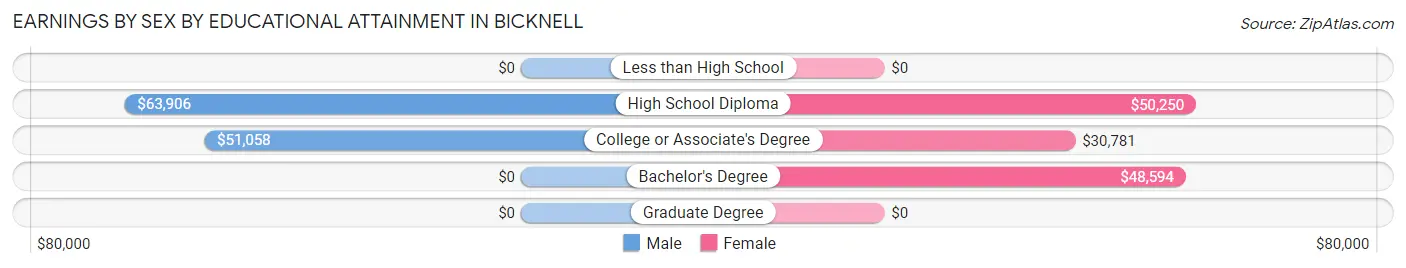
Earnings by Sex by Educational Attainment in Bicknell
Average earnings in Bicknell are $55,729 for men and $38,571 for women, a difference of 30.8%. Men with an educational attainment of high school diploma enjoy the highest average annual earnings of $63,906, while those with college or associate's degree education earn the least with $51,058. Women with an educational attainment of high school diploma earn the most with the average annual earnings of $50,250, while those with college or associate's degree education have the smallest earnings of $30,781.
| Educational Attainment | Male Income | Female Income |
| Less than High School | - | - |
| High School Diploma | $63,906 | $50,250 |
| College or Associate's Degree | $51,058 | $30,781 |
| Bachelor's Degree | - | - |
| Graduate Degree | - | - |
| Total | $55,729 | $38,571 |
Family Income in Bicknell
Family Income Brackets in Bicknell
According to the Bicknell family income data, there are 67 families falling into the $100,000 to $149,999 income range, which is the most common income bracket and makes up 45.3% of all families.
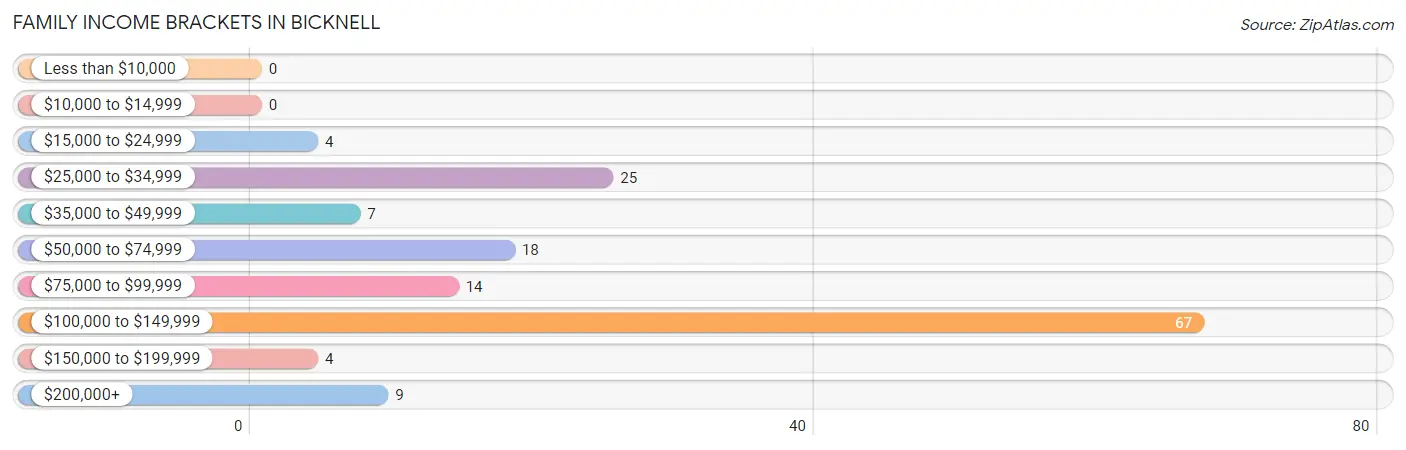
| Income Bracket | # Families | % Families |
| Less than $10,000 | 0 | 0.0% |
| $10,000 to $14,999 | 0 | 0.0% |
| $15,000 to $24,999 | 4 | 2.7% |
| $25,000 to $34,999 | 25 | 16.9% |
| $35,000 to $49,999 | 7 | 4.7% |
| $50,000 to $74,999 | 18 | 12.2% |
| $75,000 to $99,999 | 14 | 9.5% |
| $100,000 to $149,999 | 67 | 45.3% |
| $150,000 to $199,999 | 4 | 2.7% |
| $200,000+ | 9 | 6.1% |
Family Income by Famaliy Size in Bicknell
4-person families (29 | 19.6%) account for the highest median family income in Bicknell with $106,083 per family, while 2-person families (55 | 37.2%) have the highest median income of $51,438 per family member.
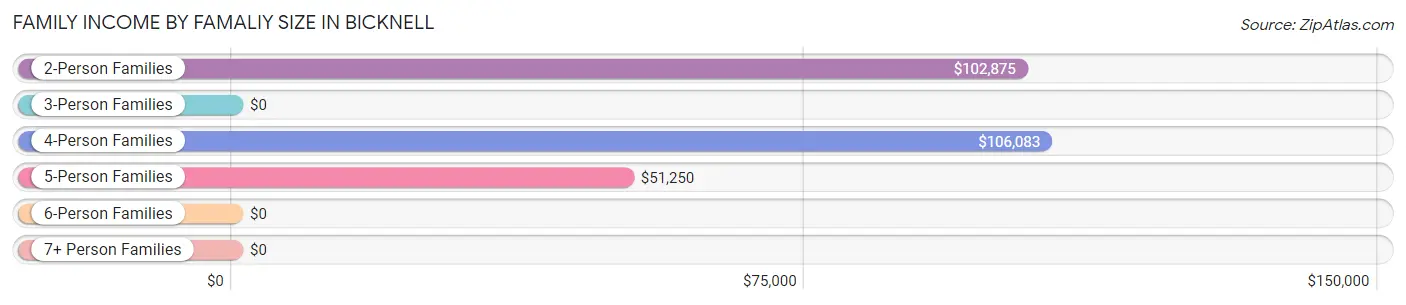
| Income Bracket | # Families | Median Income |
| 2-Person Families | 55 (37.2%) | $102,875 |
| 3-Person Families | 36 (24.3%) | $0 |
| 4-Person Families | 29 (19.6%) | $106,083 |
| 5-Person Families | 23 (15.5%) | $51,250 |
| 6-Person Families | 5 (3.4%) | $0 |
| 7+ Person Families | 0 (0.0%) | $0 |
| Total | 148 (100.0%) | $102,639 |
Family Income by Number of Earners in Bicknell
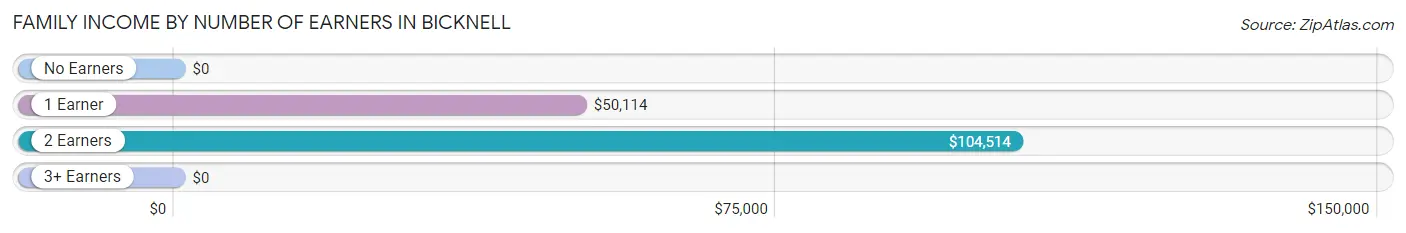
| Number of Earners | # Families | Median Income |
| No Earners | 15 (10.1%) | $0 |
| 1 Earner | 35 (23.6%) | $50,114 |
| 2 Earners | 79 (53.4%) | $104,514 |
| 3+ Earners | 19 (12.8%) | $0 |
| Total | 148 (100.0%) | $102,639 |
Household Income in Bicknell
Household Income Brackets in Bicknell
With 71 households falling in the category, the $100,000 to $149,999 income range is the most frequent in Bicknell, accounting for 40.3% of all households.
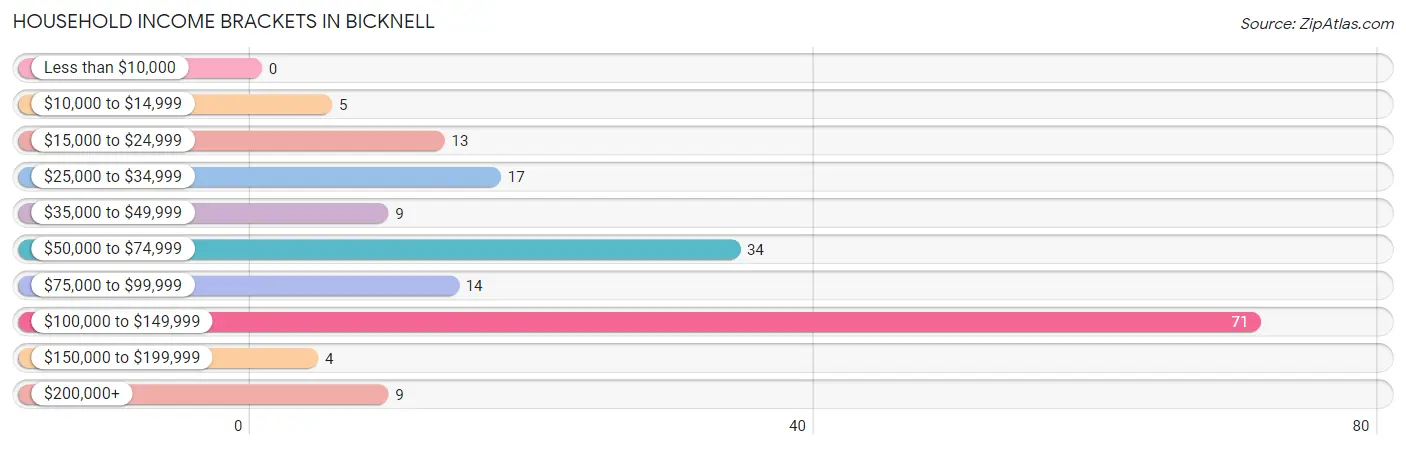
| Income Bracket | # Households | % Households |
| Less than $10,000 | 0 | 0.0% |
| $10,000 to $14,999 | 5 | 2.8% |
| $15,000 to $24,999 | 13 | 7.4% |
| $25,000 to $34,999 | 17 | 9.7% |
| $35,000 to $49,999 | 9 | 5.1% |
| $50,000 to $74,999 | 34 | 19.3% |
| $75,000 to $99,999 | 14 | 8.0% |
| $100,000 to $149,999 | 71 | 40.3% |
| $150,000 to $199,999 | 4 | 2.3% |
| $200,000+ | 9 | 5.1% |
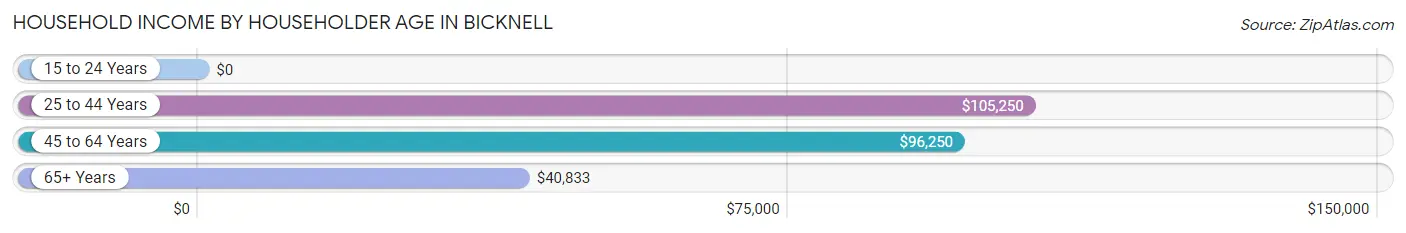
Household Income by Householder Age in Bicknell
The median household income in Bicknell is $90,833, with the highest median household income of $105,250 found in the 25 to 44 years age bracket for the primary householder. A total of 63 households (35.8%) fall into this category. Meanwhile, the 15 to 24 years age bracket for the primary householder has the lowest median household income of $0, with 11 households (6.2%) in this group.
| Income Bracket | # Households | Median Income |
| 15 to 24 Years | 11 (6.2%) | $0 |
| 25 to 44 Years | 63 (35.8%) | $105,250 |
| 45 to 64 Years | 68 (38.6%) | $96,250 |
| 65+ Years | 34 (19.3%) | $40,833 |
| Total | 176 (100.0%) | $90,833 |
Poverty in Bicknell
Income Below Poverty by Sex and Age in Bicknell
With 3.4% poverty level for males and 15.8% for females among the residents of Bicknell, 45 to 54 year old males and 16 and 17 year old females are the most vulnerable to poverty, with 6 males (19.4%) and 4 females (100.0%) in their respective age groups living below the poverty level.
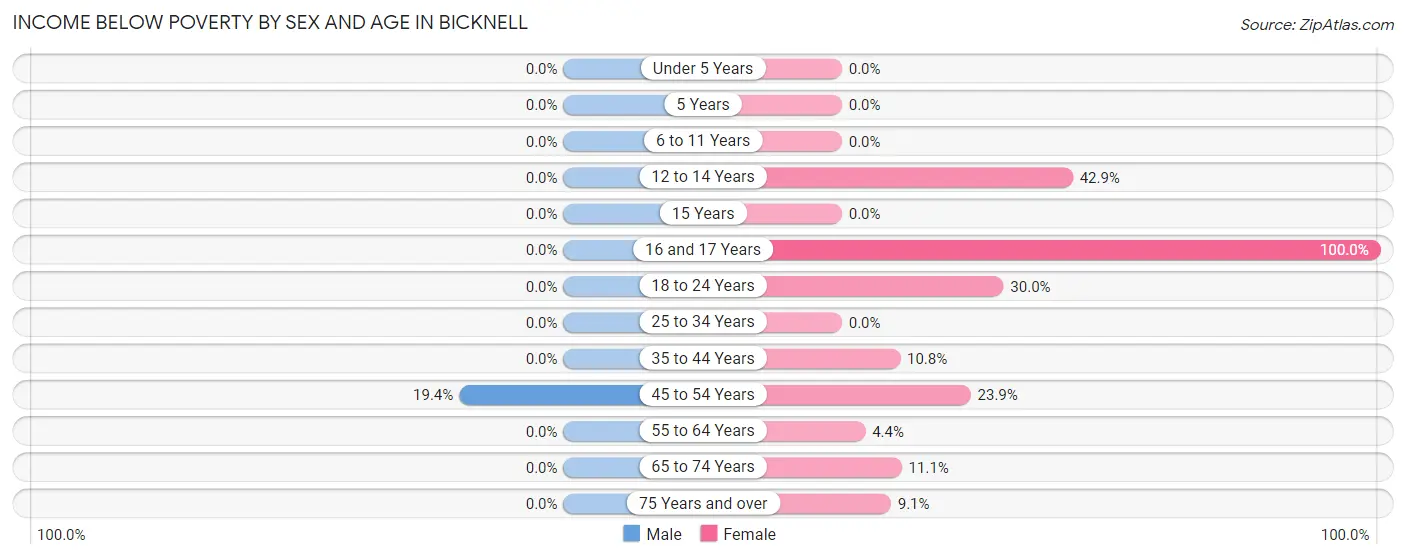
| Age Bracket | Male | Female |
| Under 5 Years | 0 (0.0%) | 0 (0.0%) |
| 5 Years | 0 (0.0%) | 0 (0.0%) |
| 6 to 11 Years | 0 (0.0%) | 0 (0.0%) |
| 12 to 14 Years | 0 (0.0%) | 9 (42.9%) |
| 15 Years | 0 (0.0%) | 0 (0.0%) |
| 16 and 17 Years | 0 (0.0%) | 4 (100.0%) |
| 18 to 24 Years | 0 (0.0%) | 6 (30.0%) |
| 25 to 34 Years | 0 (0.0%) | 0 (0.0%) |
| 35 to 44 Years | 0 (0.0%) | 4 (10.8%) |
| 45 to 54 Years | 6 (19.4%) | 11 (23.9%) |
| 55 to 64 Years | 0 (0.0%) | 1 (4.3%) |
| 65 to 74 Years | 0 (0.0%) | 1 (11.1%) |
| 75 Years and over | 0 (0.0%) | 1 (9.1%) |
| Total | 6 (3.4%) | 37 (15.8%) |
Income Above Poverty by Sex and Age in Bicknell
According to the poverty statistics in Bicknell, males aged under 5 years and females aged under 5 years are the age groups that are most secure financially, with 100.0% of males and 100.0% of females in these age groups living above the poverty line.
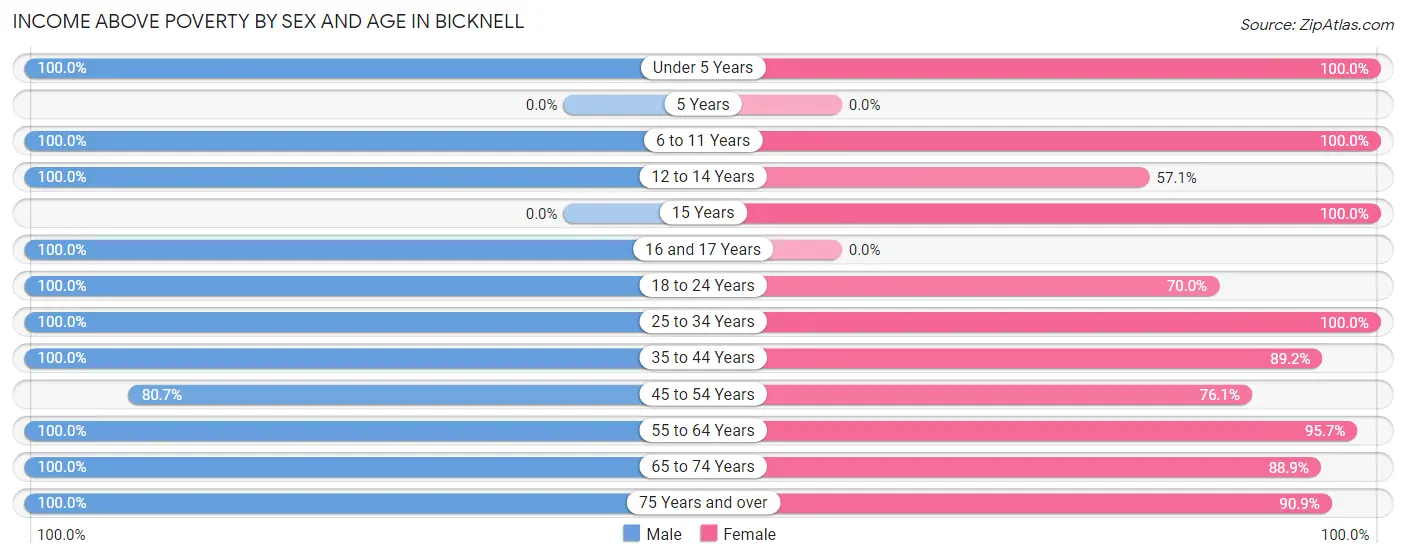
| Age Bracket | Male | Female |
| Under 5 Years | 15 (100.0%) | 24 (100.0%) |
| 5 Years | 0 (0.0%) | 0 (0.0%) |
| 6 to 11 Years | 11 (100.0%) | 6 (100.0%) |
| 12 to 14 Years | 1 (100.0%) | 12 (57.1%) |
| 15 Years | 0 (0.0%) | 2 (100.0%) |
| 16 and 17 Years | 3 (100.0%) | 0 (0.0%) |
| 18 to 24 Years | 12 (100.0%) | 14 (70.0%) |
| 25 to 34 Years | 22 (100.0%) | 31 (100.0%) |
| 35 to 44 Years | 50 (100.0%) | 33 (89.2%) |
| 45 to 54 Years | 25 (80.6%) | 35 (76.1%) |
| 55 to 64 Years | 9 (100.0%) | 22 (95.7%) |
| 65 to 74 Years | 16 (100.0%) | 8 (88.9%) |
| 75 Years and over | 9 (100.0%) | 10 (90.9%) |
| Total | 173 (96.7%) | 197 (84.2%) |
Income Below Poverty Among Married-Couple Families in Bicknell
The poverty statistics for married-couple families in Bicknell show that 5.0% or 6 of the total 121 families live below the poverty line. Families with 1 or 2 children have the highest poverty rate of 12.8%, comprising of 6 families. On the other hand, families with no children have the lowest poverty rate of 0.0%, which includes 0 families.
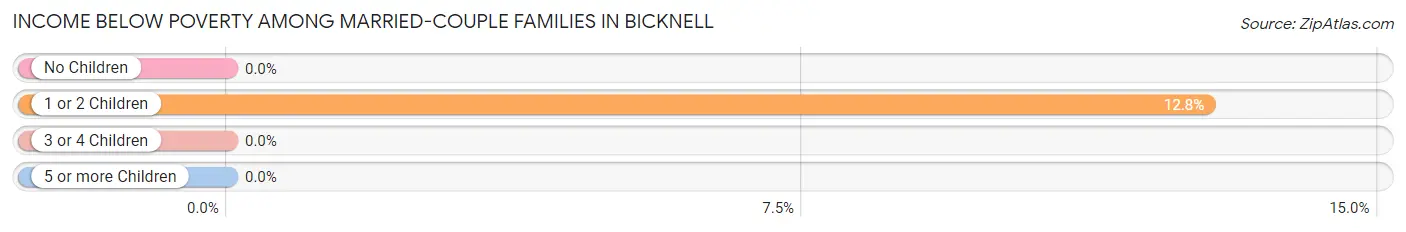
| Children | Above Poverty | Below Poverty |
| No Children | 57 (100.0%) | 0 (0.0%) |
| 1 or 2 Children | 41 (87.2%) | 6 (12.8%) |
| 3 or 4 Children | 17 (100.0%) | 0 (0.0%) |
| 5 or more Children | 0 (0.0%) | 0 (0.0%) |
| Total | 115 (95.0%) | 6 (5.0%) |
Income Below Poverty Among Single-Parent Households in Bicknell
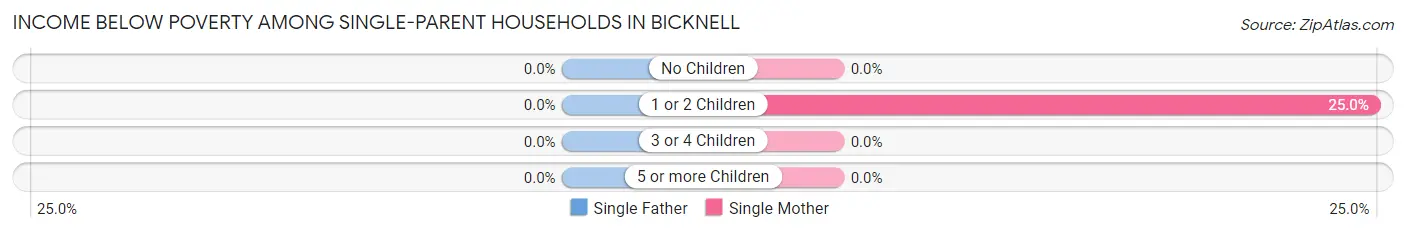
| Children | Single Father | Single Mother |
| No Children | 0 (0.0%) | 0 (0.0%) |
| 1 or 2 Children | 0 (0.0%) | 4 (25.0%) |
| 3 or 4 Children | 0 (0.0%) | 0 (0.0%) |
| 5 or more Children | 0 (0.0%) | 0 (0.0%) |
| Total | 0 (0.0%) | 4 (16.7%) |
Income Below Poverty Among Married-Couple vs Single-Parent Households in Bicknell
The poverty data for Bicknell shows that 6 of the married-couple family households (5.0%) and 4 of the single-parent households (14.8%) are living below the poverty level. Within the married-couple family households, those with 1 or 2 children have the highest poverty rate, with 6 households (12.8%) falling below the poverty line. Among the single-parent households, those with 1 or 2 children have the highest poverty rate, with 4 household (25.0%) living below poverty.
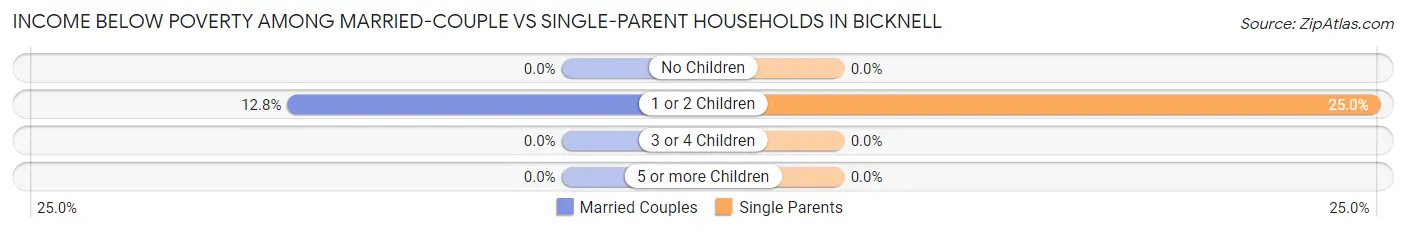
| Children | Married-Couple Families | Single-Parent Households |
| No Children | 0 (0.0%) | 0 (0.0%) |
| 1 or 2 Children | 6 (12.8%) | 4 (25.0%) |
| 3 or 4 Children | 0 (0.0%) | 0 (0.0%) |
| 5 or more Children | 0 (0.0%) | 0 (0.0%) |
| Total | 6 (5.0%) | 4 (14.8%) |
Race in Bicknell
The most populous races in Bicknell are White / Caucasian (396 | 95.9%), Two or more Races (16 | 3.9%), and Hispanic or Latino (1 | 0.2%).
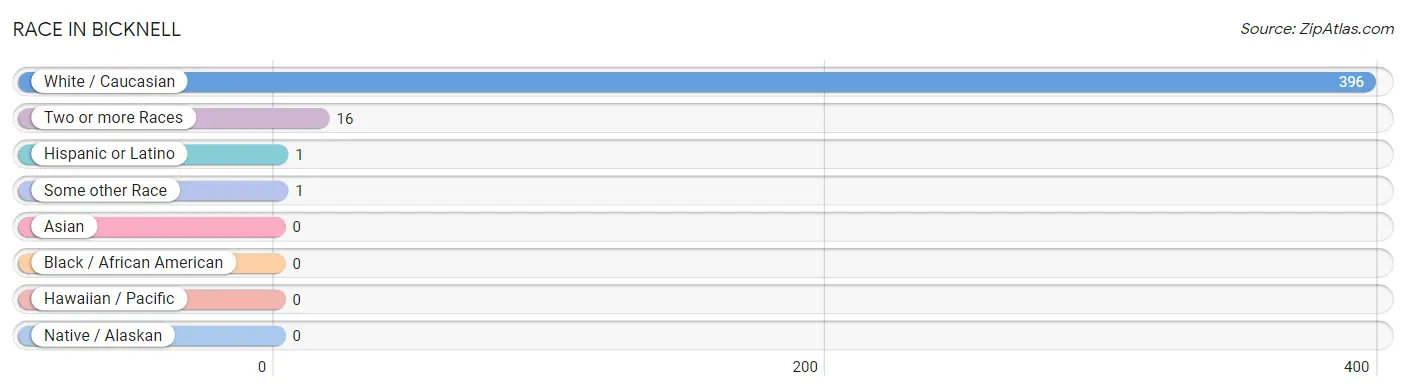
| Race | # Population | % Population |
| Asian | 0 | 0.0% |
| Black / African American | 0 | 0.0% |
| Hawaiian / Pacific | 0 | 0.0% |
| Hispanic or Latino | 1 | 0.2% |
| Native / Alaskan | 0 | 0.0% |
| White / Caucasian | 396 | 95.9% |
| Two or more Races | 16 | 3.9% |
| Some other Race | 1 | 0.2% |
| Total | 413 | 100.0% |
Ancestry in Bicknell
The most populous ancestries reported in Bicknell are English (139 | 33.7%), German (52 | 12.6%), European (26 | 6.3%), Dutch (24 | 5.8%), and Scottish (18 | 4.4%), together accounting for 62.7% of all Bicknell residents.
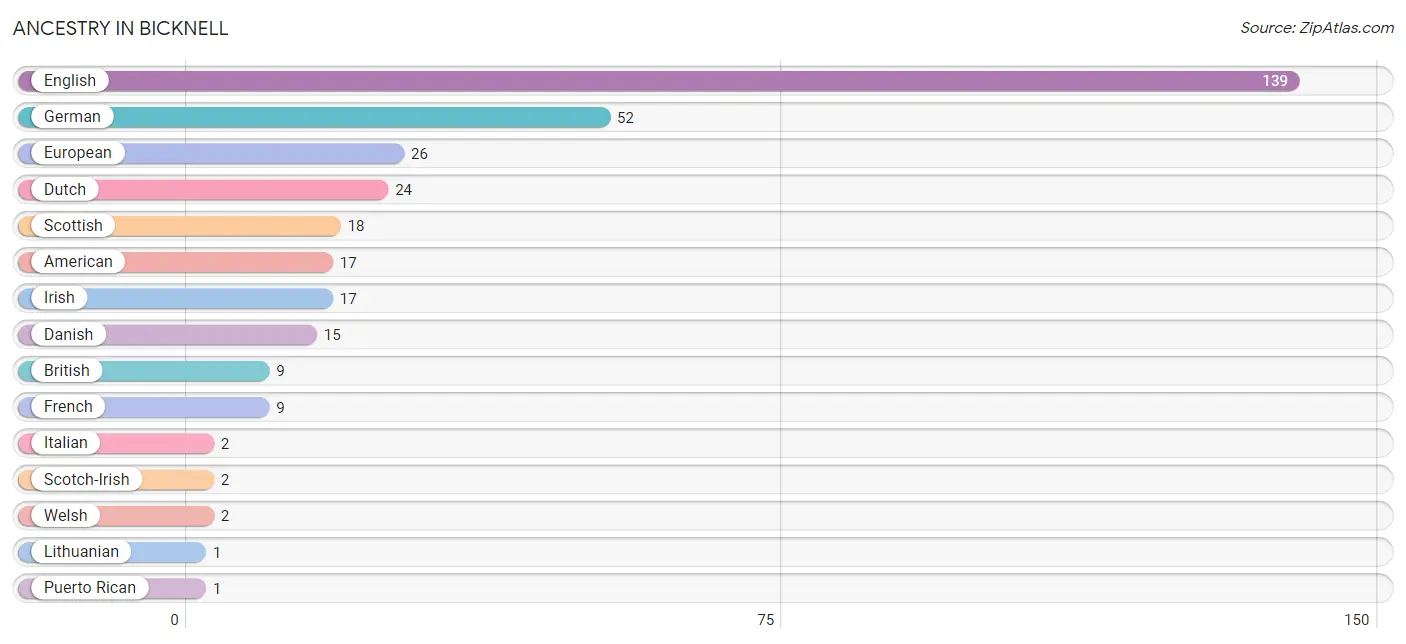
| Ancestry | # Population | % Population |
| American | 17 | 4.1% |
| British | 9 | 2.2% |
| Danish | 15 | 3.6% |
| Dutch | 24 | 5.8% |
| English | 139 | 33.7% |
| European | 26 | 6.3% |
| French | 9 | 2.2% |
| German | 52 | 12.6% |
| Irish | 17 | 4.1% |
| Italian | 2 | 0.5% |
| Lithuanian | 1 | 0.2% |
| Puerto Rican | 1 | 0.2% |
| Scotch-Irish | 2 | 0.5% |
| Scottish | 18 | 4.4% |
| Welsh | 2 | 0.5% | View All 15 Rows |
Immigrants in Bicknell
The most numerous immigrant groups reported in Bicknell came from Europe (2 | 0.5%), Germany (2 | 0.5%), Western Europe (2 | 0.5%), Latin America (1 | 0.2%), and Peru (1 | 0.2%), together accounting for 1.9% of all Bicknell residents.
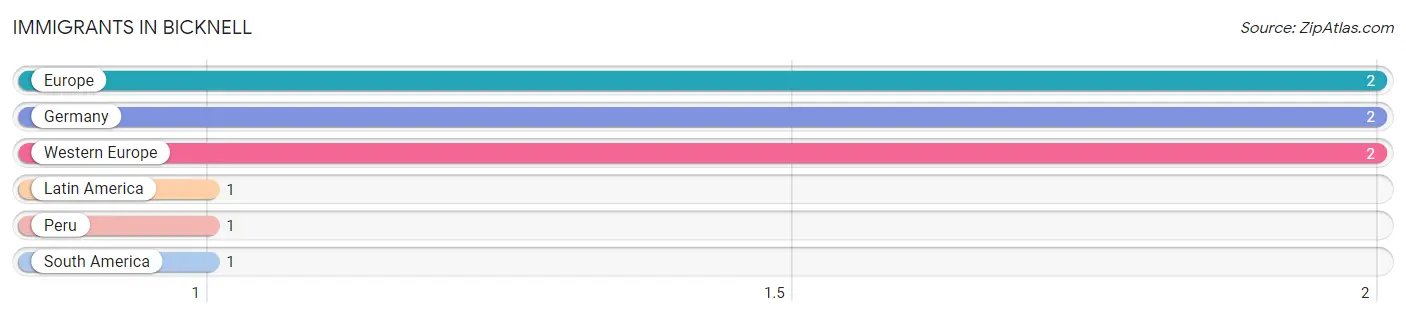
| Immigration Origin | # Population | % Population |
| Europe | 2 | 0.5% |
| Germany | 2 | 0.5% |
| Latin America | 1 | 0.2% |
| Peru | 1 | 0.2% |
| South America | 1 | 0.2% |
| Western Europe | 2 | 0.5% | View All 6 Rows |
Sex and Age in Bicknell
Sex and Age in Bicknell
The most populous age groups in Bicknell are 40 to 44 Years (35 | 19.6%) for men and 50 to 54 Years (38 | 16.2%) for women.
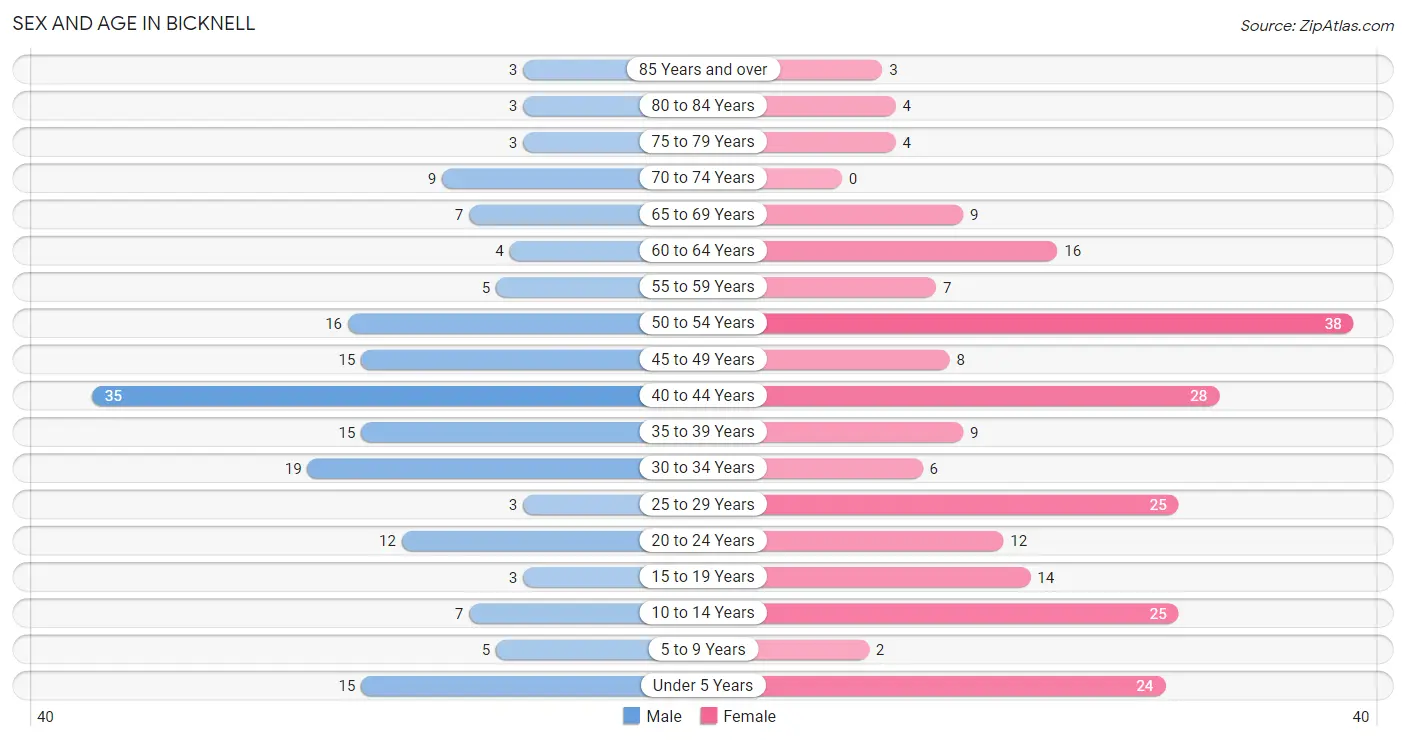
| Age Bracket | Male | Female |
| Under 5 Years | 15 (8.4%) | 24 (10.3%) |
| 5 to 9 Years | 5 (2.8%) | 2 (0.9%) |
| 10 to 14 Years | 7 (3.9%) | 25 (10.7%) |
| 15 to 19 Years | 3 (1.7%) | 14 (6.0%) |
| 20 to 24 Years | 12 (6.7%) | 12 (5.1%) |
| 25 to 29 Years | 3 (1.7%) | 25 (10.7%) |
| 30 to 34 Years | 19 (10.6%) | 6 (2.6%) |
| 35 to 39 Years | 15 (8.4%) | 9 (3.8%) |
| 40 to 44 Years | 35 (19.6%) | 28 (12.0%) |
| 45 to 49 Years | 15 (8.4%) | 8 (3.4%) |
| 50 to 54 Years | 16 (8.9%) | 38 (16.2%) |
| 55 to 59 Years | 5 (2.8%) | 7 (3.0%) |
| 60 to 64 Years | 4 (2.2%) | 16 (6.8%) |
| 65 to 69 Years | 7 (3.9%) | 9 (3.8%) |
| 70 to 74 Years | 9 (5.0%) | 0 (0.0%) |
| 75 to 79 Years | 3 (1.7%) | 4 (1.7%) |
| 80 to 84 Years | 3 (1.7%) | 4 (1.7%) |
| 85 Years and over | 3 (1.7%) | 3 (1.3%) |
| Total | 179 (100.0%) | 234 (100.0%) |
Families and Households in Bicknell
Median Family Size in Bicknell
The median family size in Bicknell is 2.51 persons per family, with married-couple families (121 | 81.8%) accounting for the largest median family size of 2.68 persons per family. On the other hand, single male/father families (3 | 2.0%) represent the smallest median family size with 1.67 persons per family.
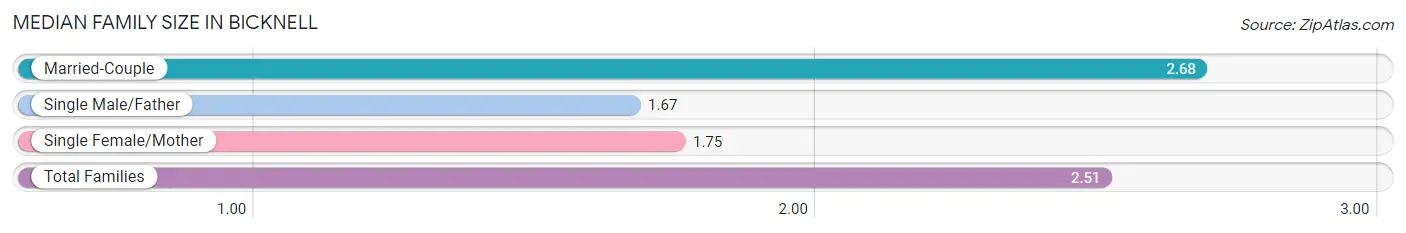
| Family Type | # Families | Family Size |
| Married-Couple | 121 (81.8%) | 2.68 |
| Single Male/Father | 3 (2.0%) | 1.67 |
| Single Female/Mother | 24 (16.2%) | 1.75 |
| Total Families | 148 (100.0%) | 2.51 |
Median Household Size in Bicknell
The median household size in Bicknell is 2.35 persons per household, with married-couple households (121 | 68.8%) accounting for the largest median household size of 2.68 persons per household. non-family households (28 | 15.9%) represent the smallest median household size with 1.25 persons per household.
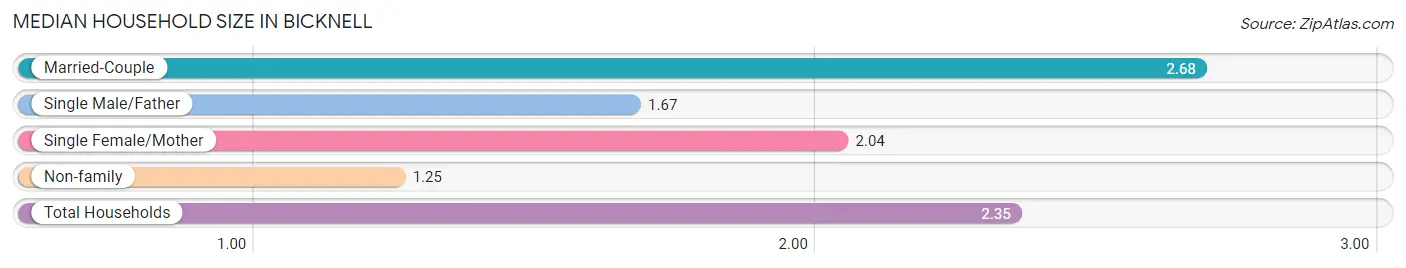
| Household Type | # Households | Household Size |
| Married-Couple | 121 (68.8%) | 2.68 |
| Single Male/Father | 3 (1.7%) | 1.67 |
| Single Female/Mother | 24 (13.6%) | 2.04 |
| Non-family | 28 (15.9%) | 1.25 |
| Total Households | 176 (100.0%) | 2.35 |
Household Size by Marriage Status in Bicknell
Out of a total of 176 households in Bicknell, 148 (84.1%) are family households, while 28 (15.9%) are nonfamily households. The most numerous type of family households are 2-person households, comprising 55, and the most common type of nonfamily households are 1-person households, comprising 24.
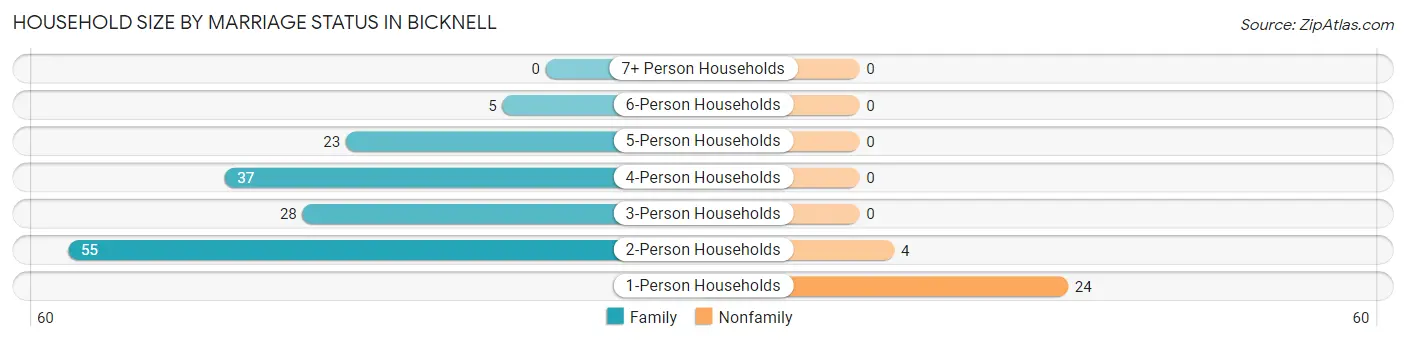
| Household Size | Family Households | Nonfamily Households |
| 1-Person Households | - | 24 (13.6%) |
| 2-Person Households | 55 (31.2%) | 4 (2.3%) |
| 3-Person Households | 28 (15.9%) | 0 (0.0%) |
| 4-Person Households | 37 (21.0%) | 0 (0.0%) |
| 5-Person Households | 23 (13.1%) | 0 (0.0%) |
| 6-Person Households | 5 (2.8%) | 0 (0.0%) |
| 7+ Person Households | 0 (0.0%) | 0 (0.0%) |
| Total | 148 (84.1%) | 28 (15.9%) |
Female Fertility in Bicknell
Fertility by Age in Bicknell
Average fertility rate in Bicknell is 136.0 births per 1,000 women. Women in the age bracket of 20 to 34 years have the highest fertility rate with 349.0 births per 1,000 women. Women in the age bracket of 20 to 34 years acount for 100.0% of all women with births.
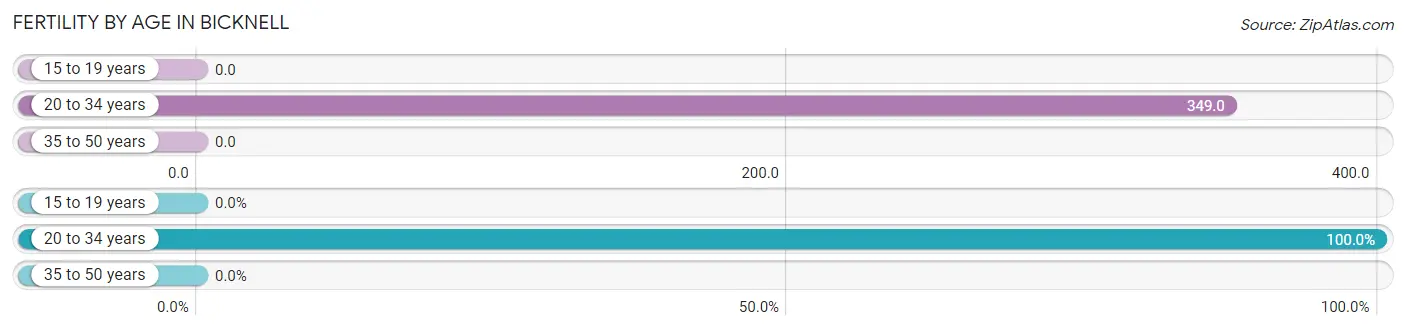
| Age Bracket | Women with Births | Births / 1,000 Women |
| 15 to 19 years | 0 (0.0%) | 0.0 |
| 20 to 34 years | 15 (100.0%) | 349.0 |
| 35 to 50 years | 0 (0.0%) | 0.0 |
| Total | 15 (100.0%) | 136.0 |
Fertility by Age by Marriage Status in Bicknell
93.3% of women with births (15) in Bicknell are married. The highest percentage of unmarried women with births falls into 20 to 34 years age bracket with 6.7% of them unmarried at the time of birth, while the lowest percentage of unmarried women with births belong to 20 to 34 years age bracket with 6.7% of them unmarried.
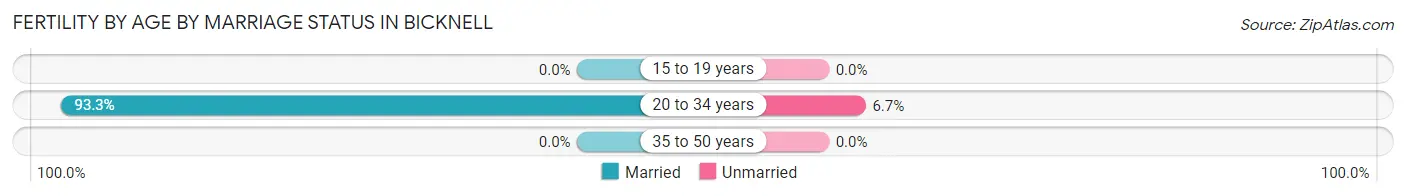
| Age Bracket | Married | Unmarried |
| 15 to 19 years | 0 (0.0%) | 0 (0.0%) |
| 20 to 34 years | 14 (93.3%) | 1 (6.7%) |
| 35 to 50 years | 0 (0.0%) | 0 (0.0%) |
| Total | 14 (93.3%) | 1 (6.7%) |
Fertility by Education in Bicknell
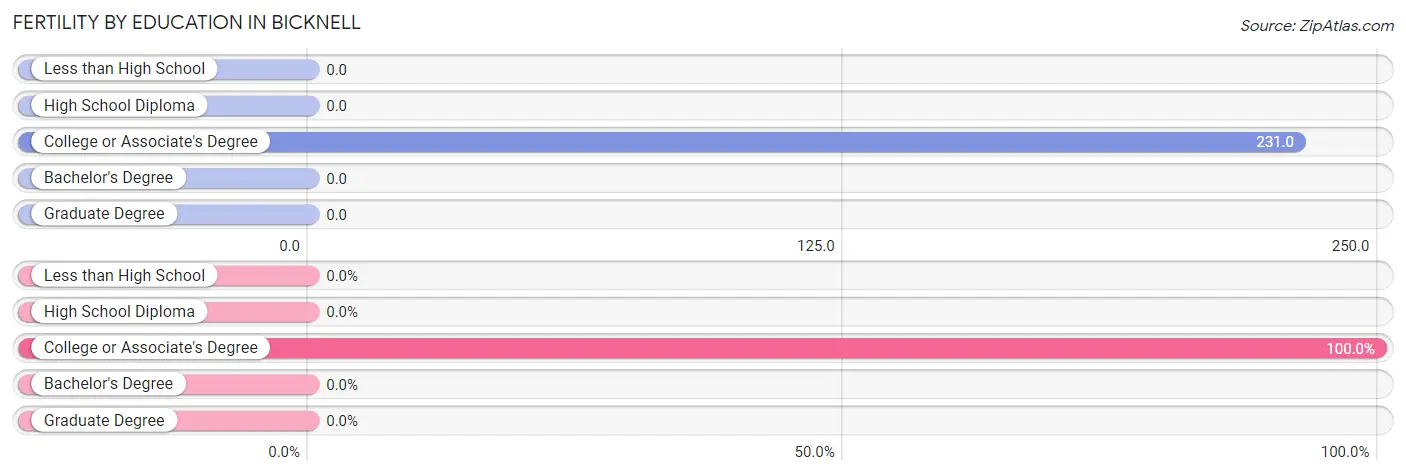
| Educational Attainment | Women with Births | Births / 1,000 Women |
| Less than High School | 0 (0.0%) | 0.0 |
| High School Diploma | 0 (0.0%) | 0.0 |
| College or Associate's Degree | 15 (100.0%) | 231.0 |
| Bachelor's Degree | 0 (0.0%) | 0.0 |
| Graduate Degree | 0 (0.0%) | 0.0 |
| Total | 15 (100.0%) | 136.0 |
Fertility by Education by Marriage Status in Bicknell
6.7% of women with births in Bicknell are unmarried. Women with the educational attainment of college or associate's degree are most likely to be married with 93.3% of them married at childbirth, while women with the educational attainment of college or associate's degree are least likely to be married with 6.7% of them unmarried at childbirth.
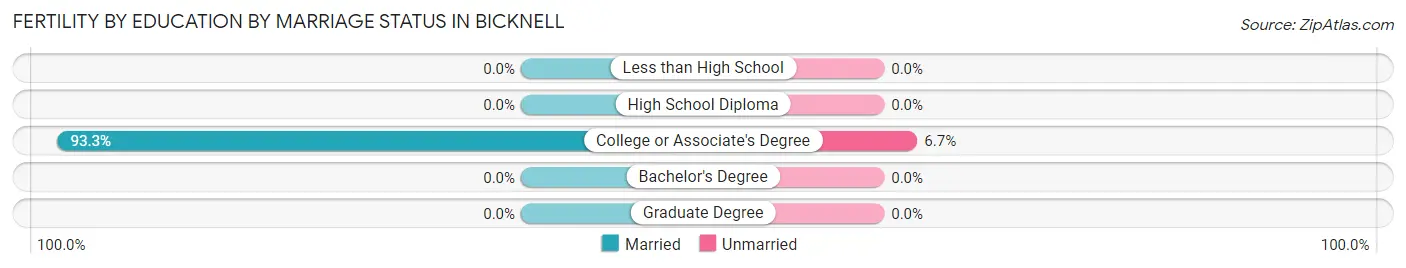
| Educational Attainment | Married | Unmarried |
| Less than High School | 0 (0.0%) | 0 (0.0%) |
| High School Diploma | 0 (0.0%) | 0 (0.0%) |
| College or Associate's Degree | 14 (93.3%) | 1 (6.7%) |
| Bachelor's Degree | 0 (0.0%) | 0 (0.0%) |
| Graduate Degree | 0 (0.0%) | 0 (0.0%) |
| Total | 14 (93.3%) | 1 (6.7%) |
Employment Characteristics in Bicknell
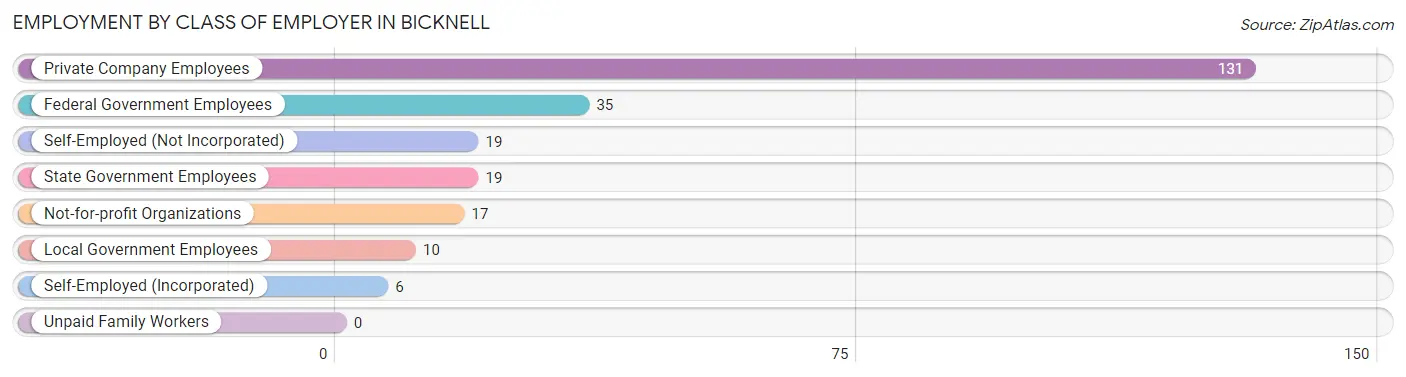
Employment by Class of Employer in Bicknell
Among the 237 employed individuals in Bicknell, private company employees (131 | 55.3%), federal government employees (35 | 14.8%), and self-employed (not incorporated) (19 | 8.0%) make up the most common classes of employment.
| Employer Class | # Employees | % Employees |
| Private Company Employees | 131 | 55.3% |
| Self-Employed (Incorporated) | 6 | 2.5% |
| Self-Employed (Not Incorporated) | 19 | 8.0% |
| Not-for-profit Organizations | 17 | 7.2% |
| Local Government Employees | 10 | 4.2% |
| State Government Employees | 19 | 8.0% |
| Federal Government Employees | 35 | 14.8% |
| Unpaid Family Workers | 0 | 0.0% |
| Total | 237 | 100.0% |
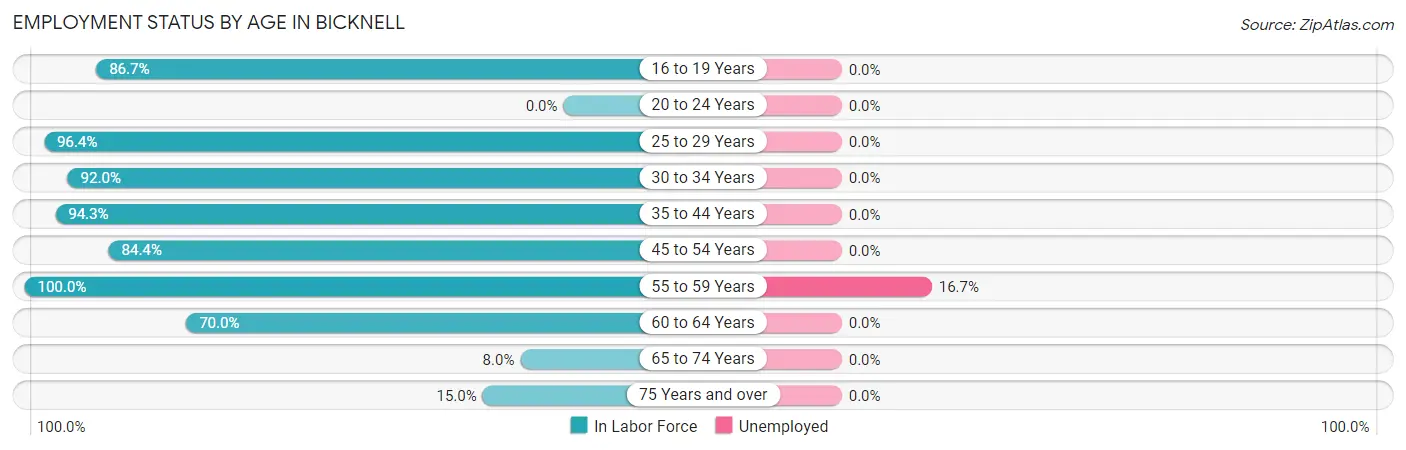
Employment Status by Age in Bicknell
According to the labor force statistics for Bicknell, out of the total population over 16 years of age (333), 72.4% or 241 individuals are in the labor force, with 0.8% or 2 of them unemployed. The age group with the highest labor force participation rate is 55 to 59 years, with 100.0% or 12 individuals in the labor force. Within the labor force, the 55 to 59 years age range has the highest percentage of unemployed individuals, with 16.7% or 2 of them being unemployed.
| Age Bracket | In Labor Force | Unemployed |
| 16 to 19 Years | 13 (86.7%) | 0 (0.0%) |
| 20 to 24 Years | 0 (0.0%) | 0 (0.0%) |
| 25 to 29 Years | 27 (96.4%) | 0 (0.0%) |
| 30 to 34 Years | 23 (92.0%) | 0 (0.0%) |
| 35 to 44 Years | 82 (94.3%) | 0 (0.0%) |
| 45 to 54 Years | 65 (84.4%) | 0 (0.0%) |
| 55 to 59 Years | 12 (100.0%) | 2 (16.7%) |
| 60 to 64 Years | 14 (70.0%) | 0 (0.0%) |
| 65 to 74 Years | 2 (8.0%) | 0 (0.0%) |
| 75 Years and over | 3 (15.0%) | 0 (0.0%) |
| Total | 241 (72.4%) | 2 (0.8%) |
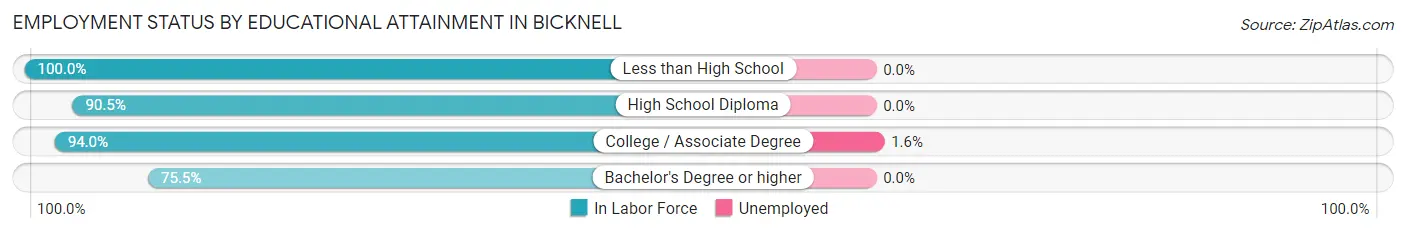
Employment Status by Educational Attainment in Bicknell
According to labor force statistics for Bicknell, 89.6% of individuals (223) out of the total population between 25 and 64 years of age (249) are in the labor force, with 0.9% or 2 of them being unemployed. The group with the highest labor force participation rate are those with the educational attainment of less than high school, with 100.0% or 4 individuals in the labor force. Within the labor force, individuals with college / associate degree education have the highest percentage of unemployment, with 1.6% or 2 of them being unemployed.
| Educational Attainment | In Labor Force | Unemployed |
| Less than High School | 4 (100.0%) | 0 (0.0%) |
| High School Diploma | 57 (90.5%) | 0 (0.0%) |
| College / Associate Degree | 125 (94.0%) | 2 (1.6%) |
| Bachelor's Degree or higher | 37 (75.5%) | 0 (0.0%) |
| Total | 223 (89.6%) | 2 (0.9%) |
Employment Occupations by Sex in Bicknell
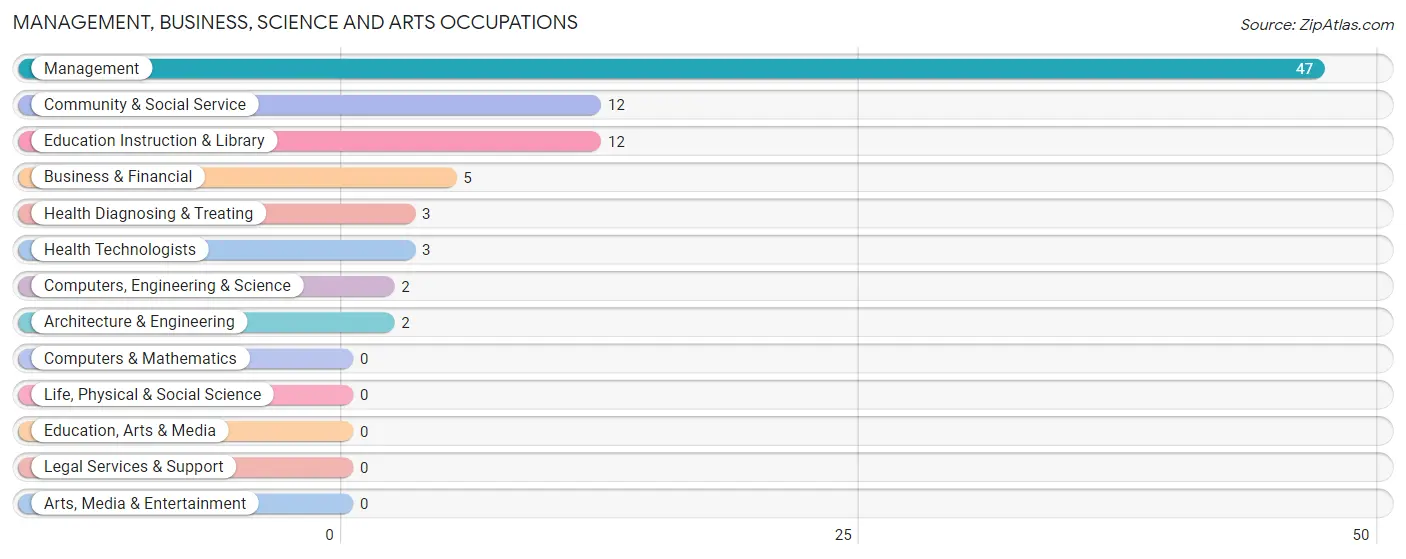
Management, Business, Science and Arts Occupations
The most common Management, Business, Science and Arts occupations in Bicknell are Management (47 | 19.7%), Community & Social Service (12 | 5.0%), Education Instruction & Library (12 | 5.0%), Business & Financial (5 | 2.1%), and Health Diagnosing & Treating (3 | 1.3%).
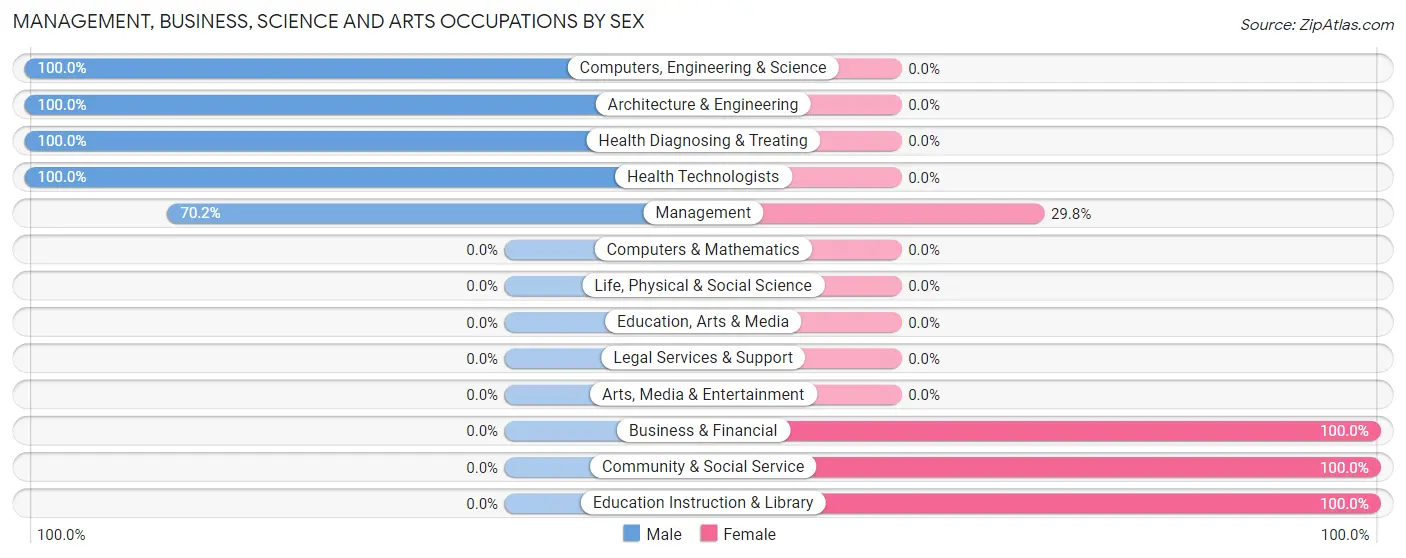
Management, Business, Science and Arts Occupations by Sex
Within the Management, Business, Science and Arts occupations in Bicknell, the most male-oriented occupations are Computers, Engineering & Science (100.0%), Architecture & Engineering (100.0%), and Health Diagnosing & Treating (100.0%), while the most female-oriented occupations are Business & Financial (100.0%), Community & Social Service (100.0%), and Education Instruction & Library (100.0%).
| Occupation | Male | Female |
| Management | 33 (70.2%) | 14 (29.8%) |
| Business & Financial | 0 (0.0%) | 5 (100.0%) |
| Computers, Engineering & Science | 2 (100.0%) | 0 (0.0%) |
| Computers & Mathematics | 0 (0.0%) | 0 (0.0%) |
| Architecture & Engineering | 2 (100.0%) | 0 (0.0%) |
| Life, Physical & Social Science | 0 (0.0%) | 0 (0.0%) |
| Community & Social Service | 0 (0.0%) | 12 (100.0%) |
| Education, Arts & Media | 0 (0.0%) | 0 (0.0%) |
| Legal Services & Support | 0 (0.0%) | 0 (0.0%) |
| Education Instruction & Library | 0 (0.0%) | 12 (100.0%) |
| Arts, Media & Entertainment | 0 (0.0%) | 0 (0.0%) |
| Health Diagnosing & Treating | 3 (100.0%) | 0 (0.0%) |
| Health Technologists | 3 (100.0%) | 0 (0.0%) |
| Total (Category) | 38 (55.1%) | 31 (44.9%) |
| Total (Overall) | 110 (46.0%) | 129 (54.0%) |
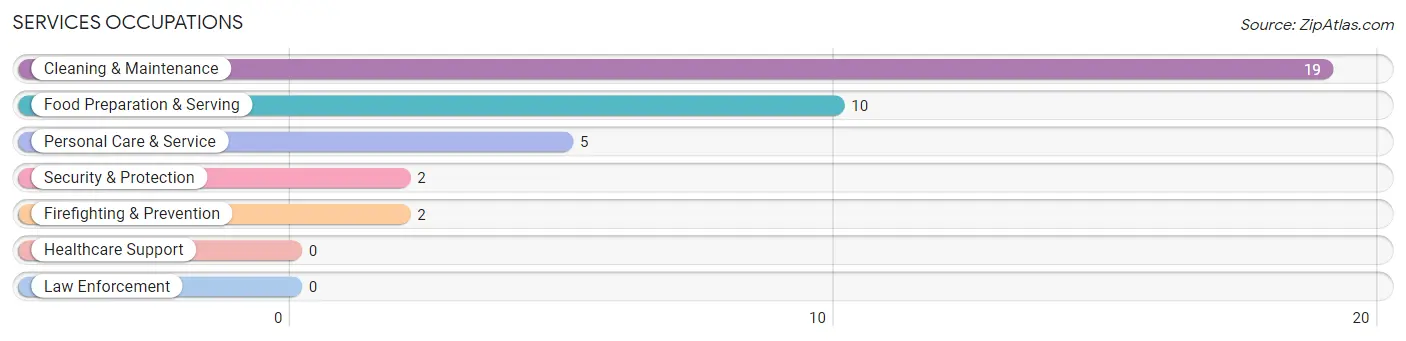
Services Occupations
The most common Services occupations in Bicknell are Cleaning & Maintenance (19 | 8.0%), Food Preparation & Serving (10 | 4.2%), Personal Care & Service (5 | 2.1%), Security & Protection (2 | 0.8%), and Firefighting & Prevention (2 | 0.8%).
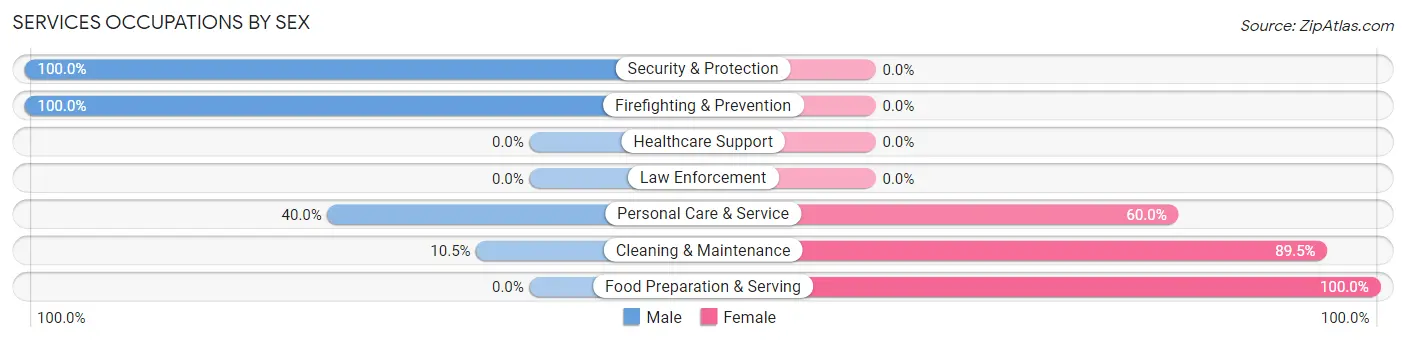
Services Occupations by Sex
Within the Services occupations in Bicknell, the most male-oriented occupations are Security & Protection (100.0%), Firefighting & Prevention (100.0%), and Personal Care & Service (40.0%), while the most female-oriented occupations are Food Preparation & Serving (100.0%), Cleaning & Maintenance (89.5%), and Personal Care & Service (60.0%).
| Occupation | Male | Female |
| Healthcare Support | 0 (0.0%) | 0 (0.0%) |
| Security & Protection | 2 (100.0%) | 0 (0.0%) |
| Firefighting & Prevention | 2 (100.0%) | 0 (0.0%) |
| Law Enforcement | 0 (0.0%) | 0 (0.0%) |
| Food Preparation & Serving | 0 (0.0%) | 10 (100.0%) |
| Cleaning & Maintenance | 2 (10.5%) | 17 (89.5%) |
| Personal Care & Service | 2 (40.0%) | 3 (60.0%) |
| Total (Category) | 6 (16.7%) | 30 (83.3%) |
| Total (Overall) | 110 (46.0%) | 129 (54.0%) |
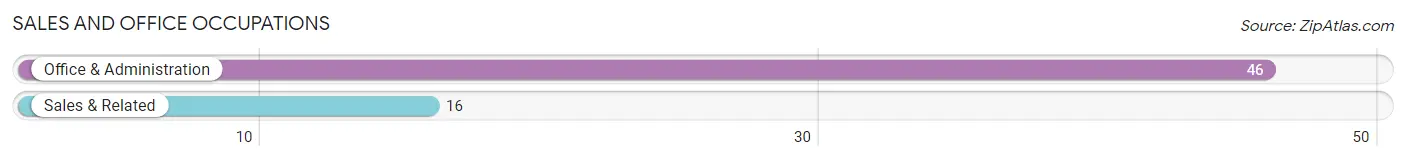
Sales and Office Occupations
The most common Sales and Office occupations in Bicknell are Office & Administration (46 | 19.3%), and Sales & Related (16 | 6.7%).
Sales and Office Occupations by Sex
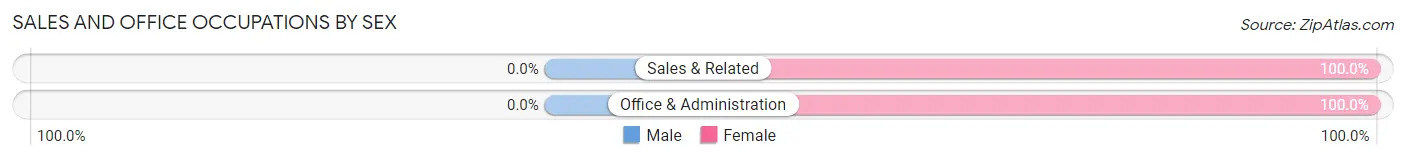
| Occupation | Male | Female |
| Sales & Related | 0 (0.0%) | 16 (100.0%) |
| Office & Administration | 0 (0.0%) | 46 (100.0%) |
| Total (Category) | 0 (0.0%) | 62 (100.0%) |
| Total (Overall) | 110 (46.0%) | 129 (54.0%) |
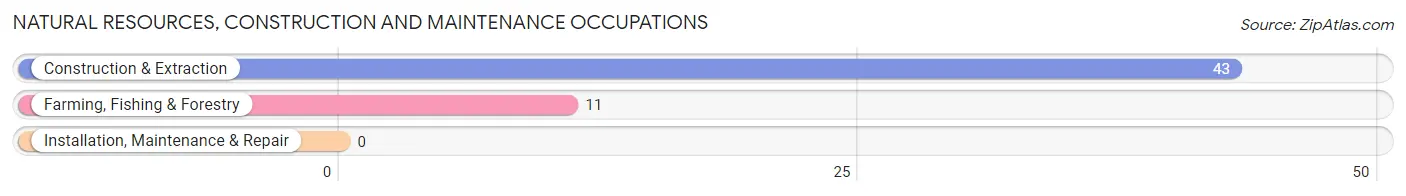
Natural Resources, Construction and Maintenance Occupations
The most common Natural Resources, Construction and Maintenance occupations in Bicknell are Construction & Extraction (43 | 18.0%), and Farming, Fishing & Forestry (11 | 4.6%).
Natural Resources, Construction and Maintenance Occupations by Sex
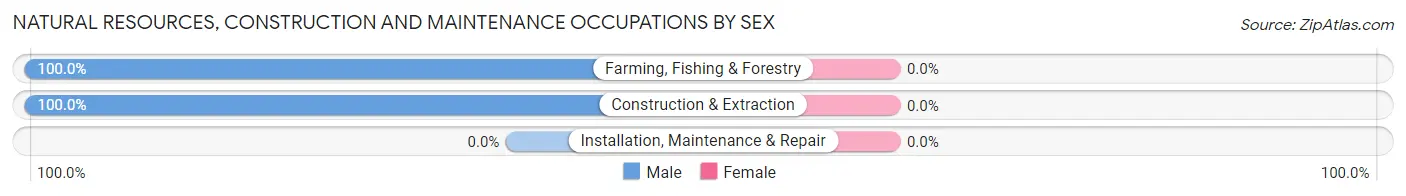
| Occupation | Male | Female |
| Farming, Fishing & Forestry | 11 (100.0%) | 0 (0.0%) |
| Construction & Extraction | 43 (100.0%) | 0 (0.0%) |
| Installation, Maintenance & Repair | 0 (0.0%) | 0 (0.0%) |
| Total (Category) | 54 (100.0%) | 0 (0.0%) |
| Total (Overall) | 110 (46.0%) | 129 (54.0%) |
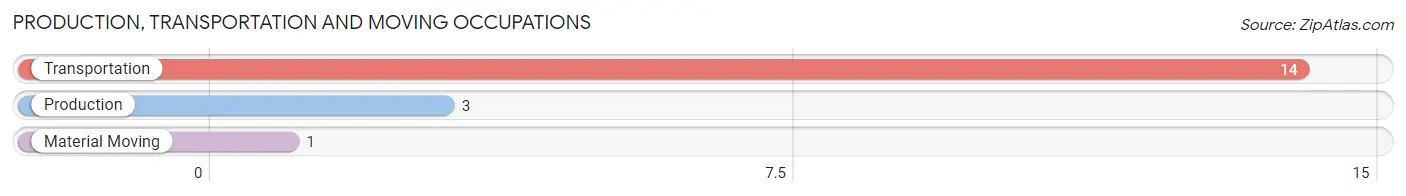
Production, Transportation and Moving Occupations
The most common Production, Transportation and Moving occupations in Bicknell are Transportation (14 | 5.9%), Production (3 | 1.3%), and Material Moving (1 | 0.4%).
Production, Transportation and Moving Occupations by Sex
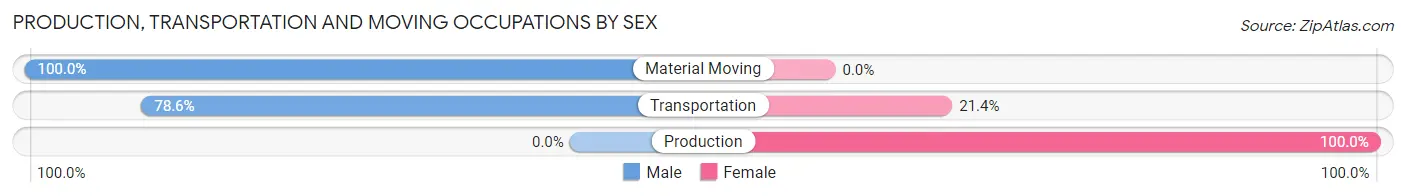
| Occupation | Male | Female |
| Production | 0 (0.0%) | 3 (100.0%) |
| Transportation | 11 (78.6%) | 3 (21.4%) |
| Material Moving | 1 (100.0%) | 0 (0.0%) |
| Total (Category) | 12 (66.7%) | 6 (33.3%) |
| Total (Overall) | 110 (46.0%) | 129 (54.0%) |
Employment Industries by Sex in Bicknell
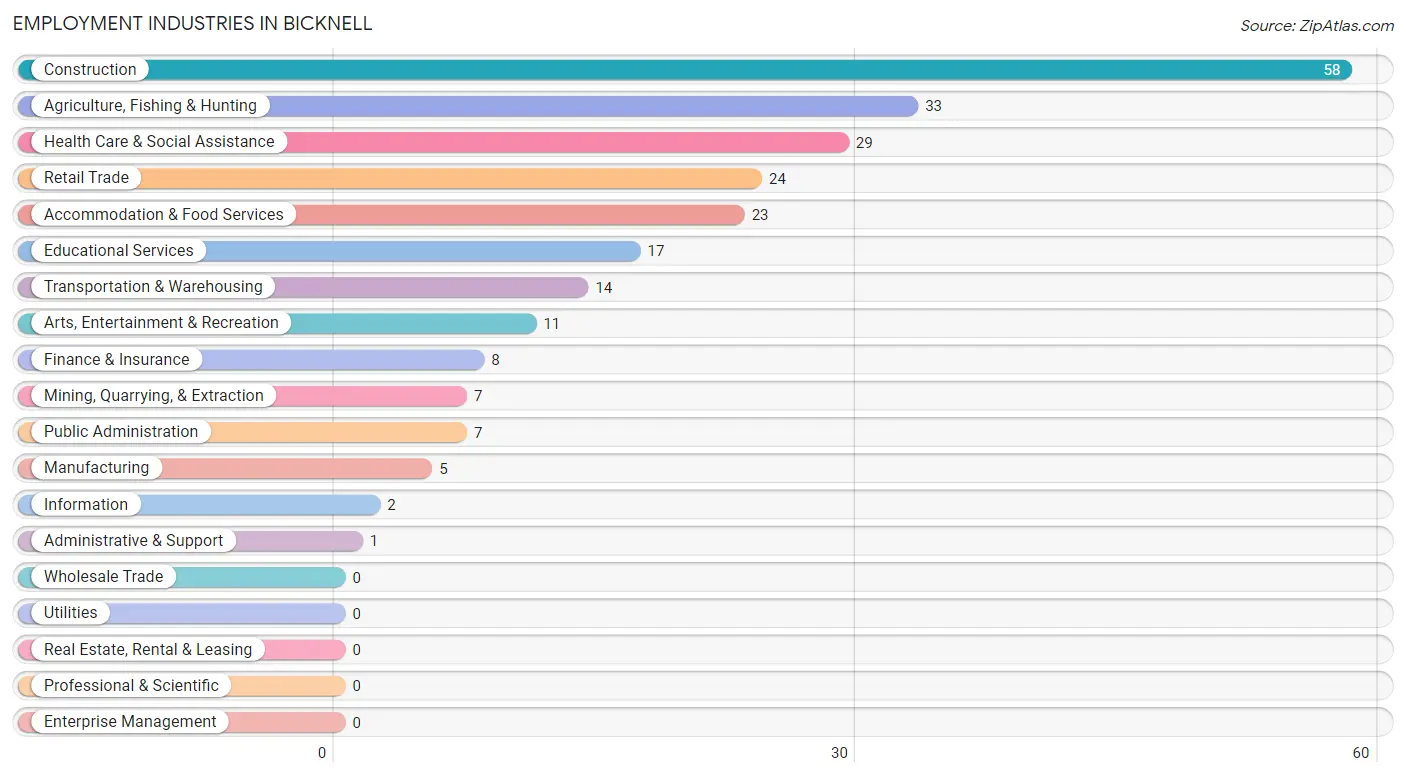
Employment Industries in Bicknell
The major employment industries in Bicknell include Construction (58 | 24.3%), Agriculture, Fishing & Hunting (33 | 13.8%), Health Care & Social Assistance (29 | 12.1%), Retail Trade (24 | 10.0%), and Accommodation & Food Services (23 | 9.6%).
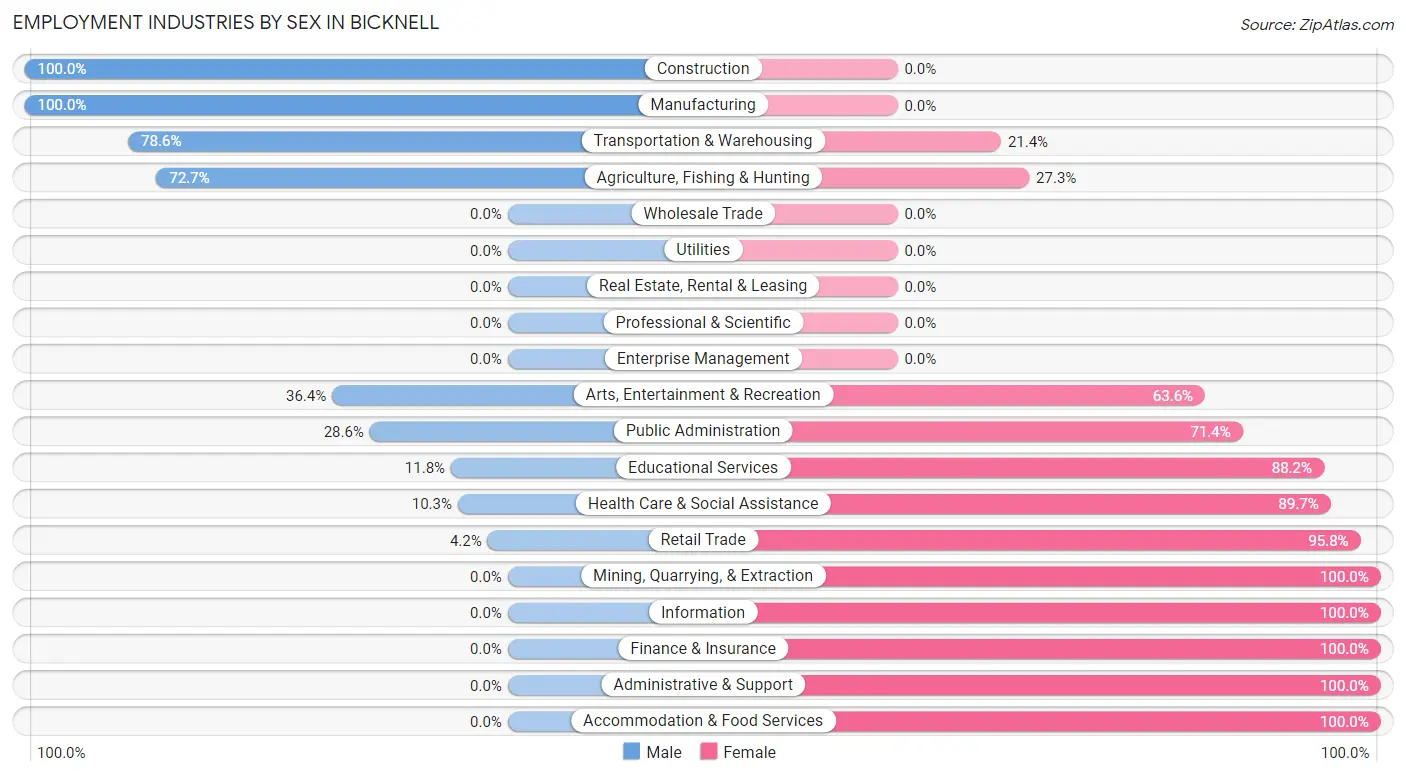
Employment Industries by Sex in Bicknell
The Bicknell industries that see more men than women are Construction (100.0%), Manufacturing (100.0%), and Transportation & Warehousing (78.6%), whereas the industries that tend to have a higher number of women are Mining, Quarrying, & Extraction (100.0%), Information (100.0%), and Finance & Insurance (100.0%).
| Industry | Male | Female |
| Agriculture, Fishing & Hunting | 24 (72.7%) | 9 (27.3%) |
| Mining, Quarrying, & Extraction | 0 (0.0%) | 7 (100.0%) |
| Construction | 58 (100.0%) | 0 (0.0%) |
| Manufacturing | 5 (100.0%) | 0 (0.0%) |
| Wholesale Trade | 0 (0.0%) | 0 (0.0%) |
| Retail Trade | 1 (4.2%) | 23 (95.8%) |
| Transportation & Warehousing | 11 (78.6%) | 3 (21.4%) |
| Utilities | 0 (0.0%) | 0 (0.0%) |
| Information | 0 (0.0%) | 2 (100.0%) |
| Finance & Insurance | 0 (0.0%) | 8 (100.0%) |
| Real Estate, Rental & Leasing | 0 (0.0%) | 0 (0.0%) |
| Professional & Scientific | 0 (0.0%) | 0 (0.0%) |
| Enterprise Management | 0 (0.0%) | 0 (0.0%) |
| Administrative & Support | 0 (0.0%) | 1 (100.0%) |
| Educational Services | 2 (11.8%) | 15 (88.2%) |
| Health Care & Social Assistance | 3 (10.3%) | 26 (89.7%) |
| Arts, Entertainment & Recreation | 4 (36.4%) | 7 (63.6%) |
| Accommodation & Food Services | 0 (0.0%) | 23 (100.0%) |
| Public Administration | 2 (28.6%) | 5 (71.4%) |
| Total | 110 (46.0%) | 129 (54.0%) |
Education in Bicknell
School Enrollment in Bicknell
The most common levels of schooling among the 74 students in Bicknell are middle school (28 | 37.8%), high school (17 | 23.0%), and college / undergraduate (13 | 17.6%).
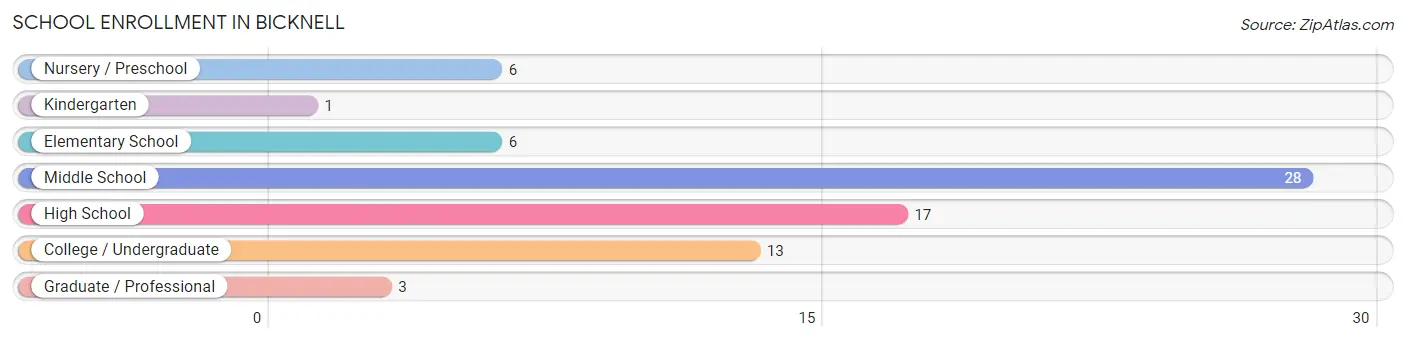
| School Level | # Students | % Students |
| Nursery / Preschool | 6 | 8.1% |
| Kindergarten | 1 | 1.3% |
| Elementary School | 6 | 8.1% |
| Middle School | 28 | 37.8% |
| High School | 17 | 23.0% |
| College / Undergraduate | 13 | 17.6% |
| Graduate / Professional | 3 | 4.1% |
| Total | 74 | 100.0% |
School Enrollment by Age by Funding Source in Bicknell
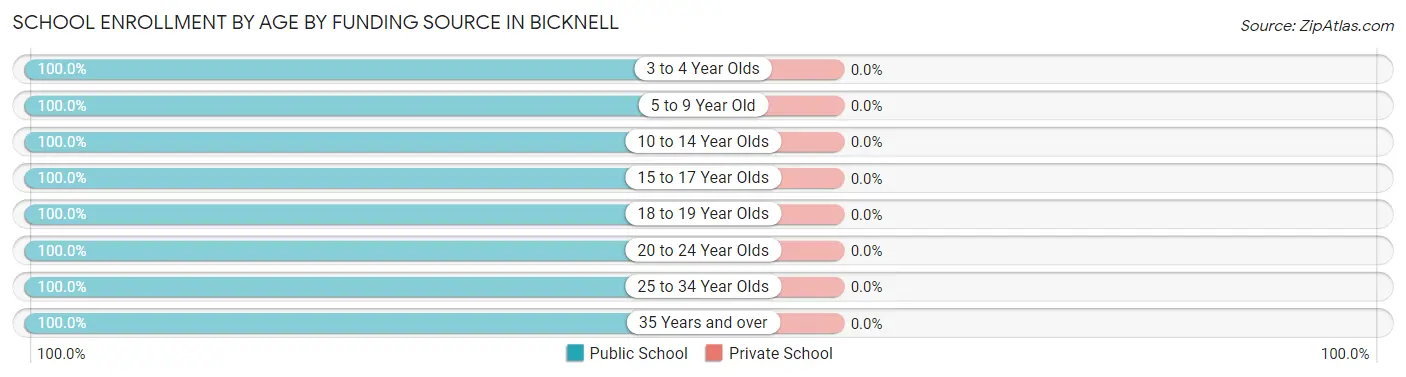
| Age Bracket | Public School | Private School |
| 3 to 4 Year Olds | 6 (100.0%) | 0 (0.0%) |
| 5 to 9 Year Old | 7 (100.0%) | 0 (0.0%) |
| 10 to 14 Year Olds | 32 (100.0%) | 0 (0.0%) |
| 15 to 17 Year Olds | 9 (100.0%) | 0 (0.0%) |
| 18 to 19 Year Olds | 4 (100.0%) | 0 (0.0%) |
| 20 to 24 Year Olds | 7 (100.0%) | 0 (0.0%) |
| 25 to 34 Year Olds | 6 (100.0%) | 0 (0.0%) |
| 35 Years and over | 3 (100.0%) | 0 (0.0%) |
| Total | 74 (100.0%) | 0 (0.0%) |
Educational Attainment by Field of Study in Bicknell
Education (19 | 33.3%), bio, nature & agricultural (9 | 15.8%), business (9 | 15.8%), psychology (8 | 14.0%), and computers & mathematics (4 | 7.0%) are the most common fields of study among 57 individuals in Bicknell who have obtained a bachelor's degree or higher.
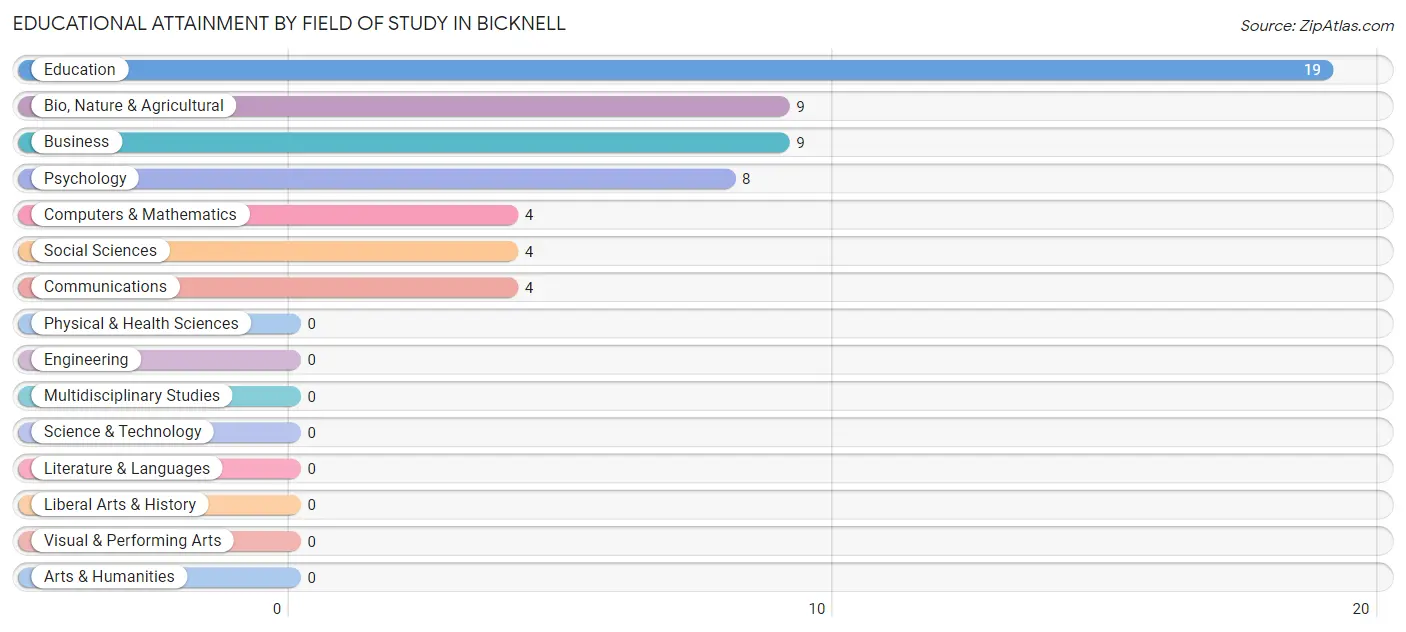
| Field of Study | # Graduates | % Graduates |
| Computers & Mathematics | 4 | 7.0% |
| Bio, Nature & Agricultural | 9 | 15.8% |
| Physical & Health Sciences | 0 | 0.0% |
| Psychology | 8 | 14.0% |
| Social Sciences | 4 | 7.0% |
| Engineering | 0 | 0.0% |
| Multidisciplinary Studies | 0 | 0.0% |
| Science & Technology | 0 | 0.0% |
| Business | 9 | 15.8% |
| Education | 19 | 33.3% |
| Literature & Languages | 0 | 0.0% |
| Liberal Arts & History | 0 | 0.0% |
| Visual & Performing Arts | 0 | 0.0% |
| Communications | 4 | 7.0% |
| Arts & Humanities | 0 | 0.0% |
| Total | 57 | 100.0% |
Transportation & Commute in Bicknell
Vehicle Availability by Sex in Bicknell
The most prevalent vehicle ownership categories in Bicknell are males with 2 vehicles (42, accounting for 38.9%) and females with 2 vehicles (60, making up 32.6%).
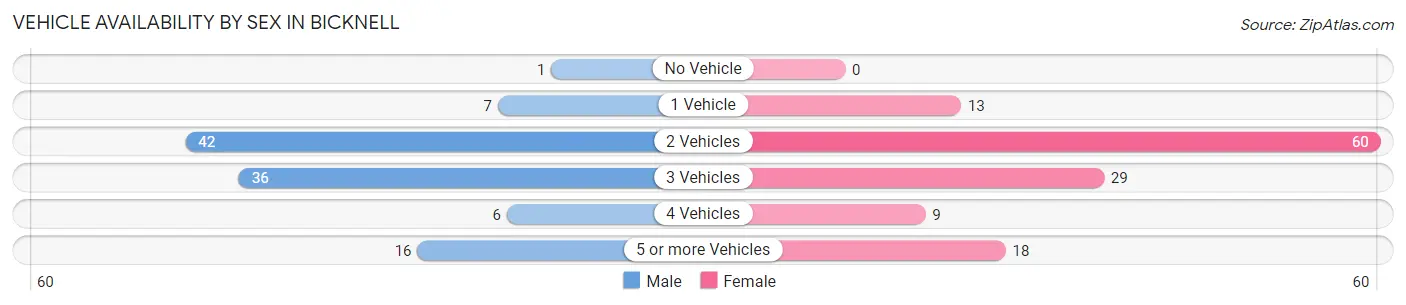
| Vehicles Available | Male | Female |
| No Vehicle | 1 (0.9%) | 0 (0.0%) |
| 1 Vehicle | 7 (6.5%) | 13 (10.1%) |
| 2 Vehicles | 42 (38.9%) | 60 (46.5%) |
| 3 Vehicles | 36 (33.3%) | 29 (22.5%) |
| 4 Vehicles | 6 (5.6%) | 9 (7.0%) |
| 5 or more Vehicles | 16 (14.8%) | 18 (14.0%) |
| Total | 108 (100.0%) | 129 (100.0%) |
Commute Time in Bicknell
The most frequently occuring commute durations in Bicknell are less than 5 minutes (58 commuters, 32.0%), 10 to 14 minutes (37 commuters, 20.4%), and 15 to 19 minutes (22 commuters, 12.1%).
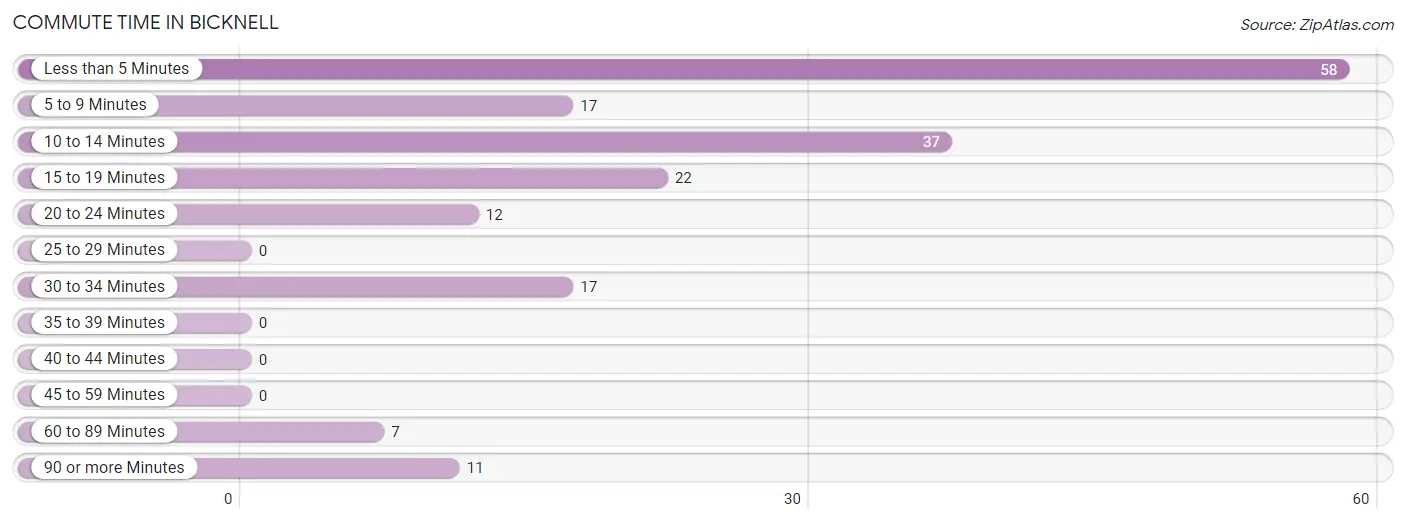
| Commute Time | # Commuters | % Commuters |
| Less than 5 Minutes | 58 | 32.0% |
| 5 to 9 Minutes | 17 | 9.4% |
| 10 to 14 Minutes | 37 | 20.4% |
| 15 to 19 Minutes | 22 | 12.1% |
| 20 to 24 Minutes | 12 | 6.6% |
| 25 to 29 Minutes | 0 | 0.0% |
| 30 to 34 Minutes | 17 | 9.4% |
| 35 to 39 Minutes | 0 | 0.0% |
| 40 to 44 Minutes | 0 | 0.0% |
| 45 to 59 Minutes | 0 | 0.0% |
| 60 to 89 Minutes | 7 | 3.9% |
| 90 or more Minutes | 11 | 6.1% |
Commute Time by Sex in Bicknell
The most common commute times in Bicknell are less than 5 minutes (31 commuters, 32.3%) for males and less than 5 minutes (27 commuters, 31.8%) for females.
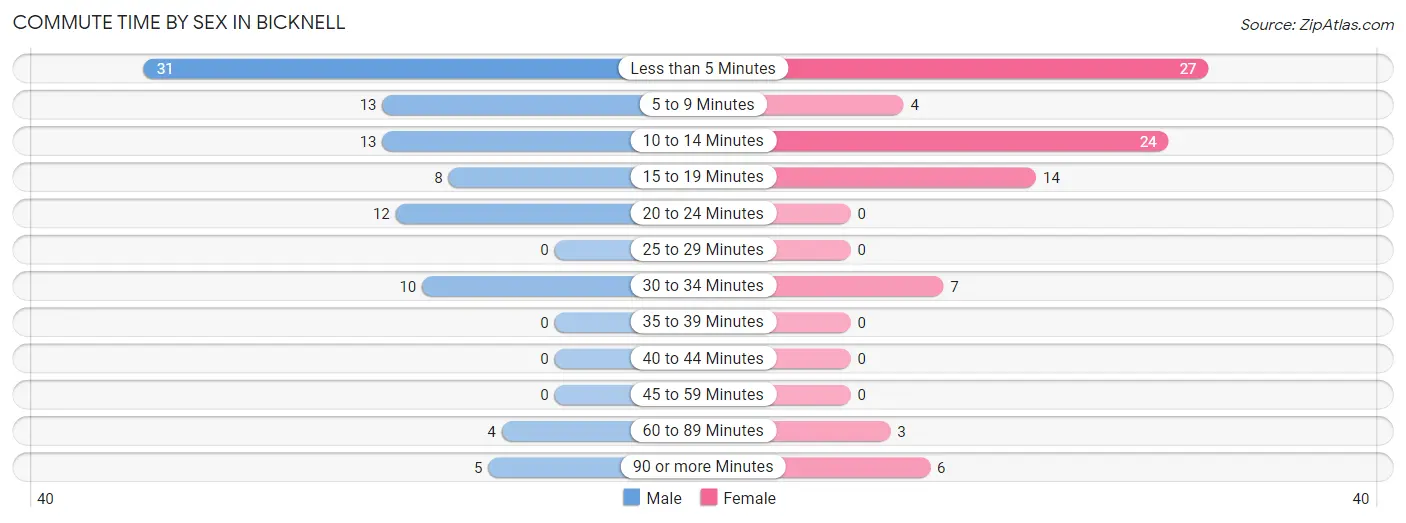
| Commute Time | Male | Female |
| Less than 5 Minutes | 31 (32.3%) | 27 (31.8%) |
| 5 to 9 Minutes | 13 (13.5%) | 4 (4.7%) |
| 10 to 14 Minutes | 13 (13.5%) | 24 (28.2%) |
| 15 to 19 Minutes | 8 (8.3%) | 14 (16.5%) |
| 20 to 24 Minutes | 12 (12.5%) | 0 (0.0%) |
| 25 to 29 Minutes | 0 (0.0%) | 0 (0.0%) |
| 30 to 34 Minutes | 10 (10.4%) | 7 (8.2%) |
| 35 to 39 Minutes | 0 (0.0%) | 0 (0.0%) |
| 40 to 44 Minutes | 0 (0.0%) | 0 (0.0%) |
| 45 to 59 Minutes | 0 (0.0%) | 0 (0.0%) |
| 60 to 89 Minutes | 4 (4.2%) | 3 (3.5%) |
| 90 or more Minutes | 5 (5.2%) | 6 (7.1%) |
Time of Departure to Work by Sex in Bicknell
The most frequent times of departure to work in Bicknell are 7:30 AM to 7:59 AM (25, 26.0%) for males and 7:00 AM to 7:29 AM (22, 25.9%) for females.
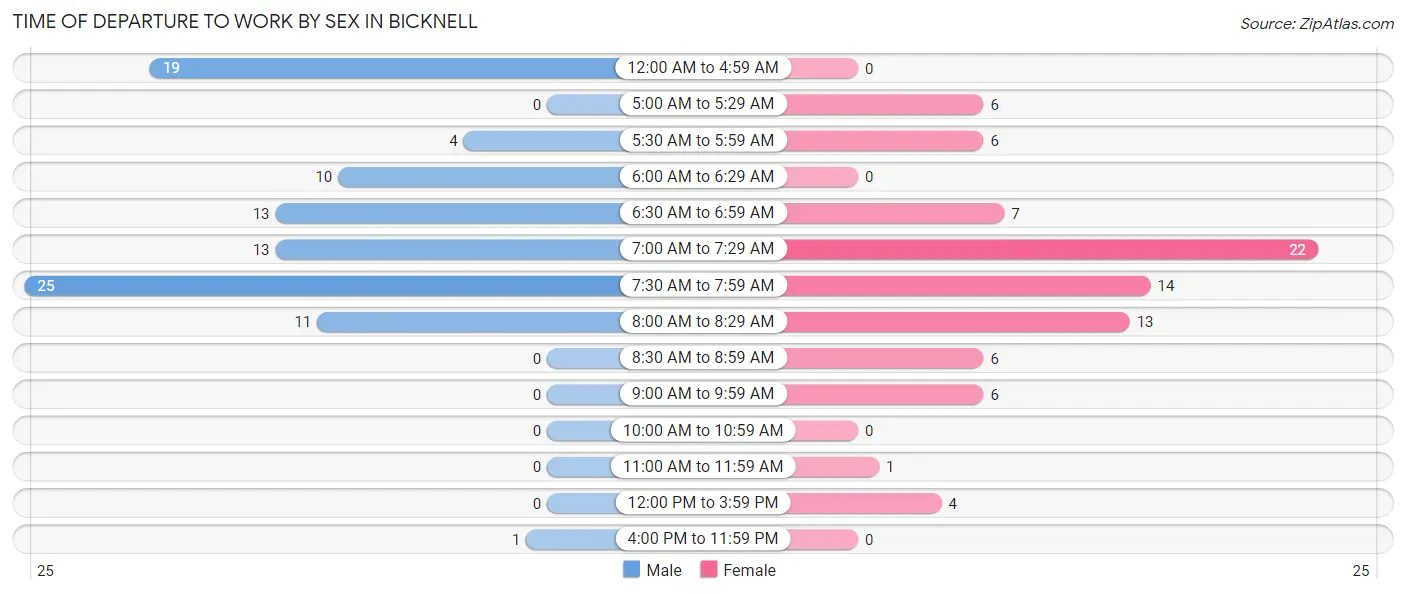
| Time of Departure | Male | Female |
| 12:00 AM to 4:59 AM | 19 (19.8%) | 0 (0.0%) |
| 5:00 AM to 5:29 AM | 0 (0.0%) | 6 (7.1%) |
| 5:30 AM to 5:59 AM | 4 (4.2%) | 6 (7.1%) |
| 6:00 AM to 6:29 AM | 10 (10.4%) | 0 (0.0%) |
| 6:30 AM to 6:59 AM | 13 (13.5%) | 7 (8.2%) |
| 7:00 AM to 7:29 AM | 13 (13.5%) | 22 (25.9%) |
| 7:30 AM to 7:59 AM | 25 (26.0%) | 14 (16.5%) |
| 8:00 AM to 8:29 AM | 11 (11.5%) | 13 (15.3%) |
| 8:30 AM to 8:59 AM | 0 (0.0%) | 6 (7.1%) |
| 9:00 AM to 9:59 AM | 0 (0.0%) | 6 (7.1%) |
| 10:00 AM to 10:59 AM | 0 (0.0%) | 0 (0.0%) |
| 11:00 AM to 11:59 AM | 0 (0.0%) | 1 (1.2%) |
| 12:00 PM to 3:59 PM | 0 (0.0%) | 4 (4.7%) |
| 4:00 PM to 11:59 PM | 1 (1.0%) | 0 (0.0%) |
| Total | 96 (100.0%) | 85 (100.0%) |
Housing Occupancy in Bicknell
Occupancy by Ownership in Bicknell
Of the total 176 dwellings in Bicknell, owner-occupied units account for 137 (77.8%), while renter-occupied units make up 39 (22.2%).
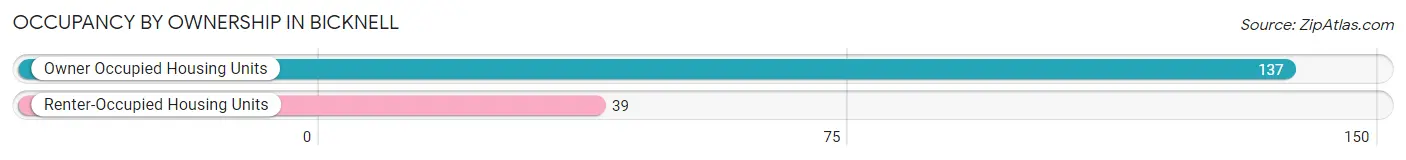
| Occupancy | # Housing Units | % Housing Units |
| Owner Occupied Housing Units | 137 | 77.8% |
| Renter-Occupied Housing Units | 39 | 22.2% |
| Total Occupied Housing Units | 176 | 100.0% |
Occupancy by Household Size in Bicknell
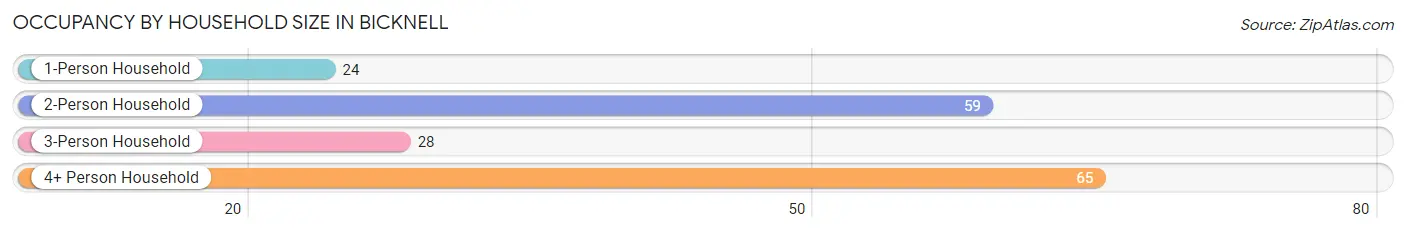
| Household Size | # Housing Units | % Housing Units |
| 1-Person Household | 24 | 13.6% |
| 2-Person Household | 59 | 33.5% |
| 3-Person Household | 28 | 15.9% |
| 4+ Person Household | 65 | 36.9% |
| Total Housing Units | 176 | 100.0% |
Occupancy by Ownership by Household Size in Bicknell
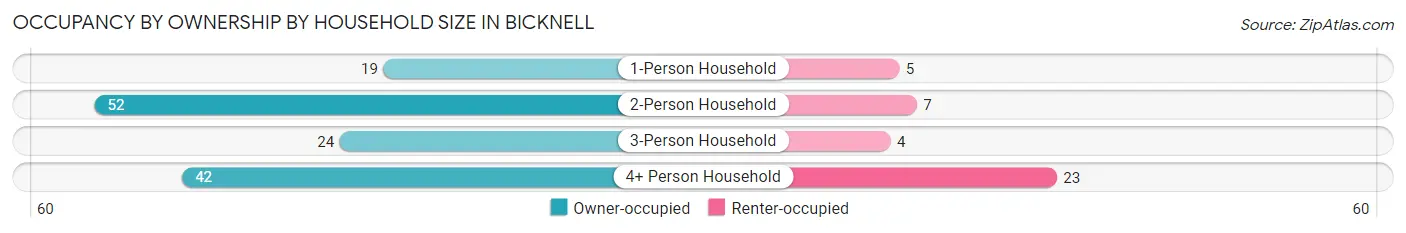
| Household Size | Owner-occupied | Renter-occupied |
| 1-Person Household | 19 (79.2%) | 5 (20.8%) |
| 2-Person Household | 52 (88.1%) | 7 (11.9%) |
| 3-Person Household | 24 (85.7%) | 4 (14.3%) |
| 4+ Person Household | 42 (64.6%) | 23 (35.4%) |
| Total Housing Units | 137 (77.8%) | 39 (22.2%) |
Occupancy by Educational Attainment in Bicknell
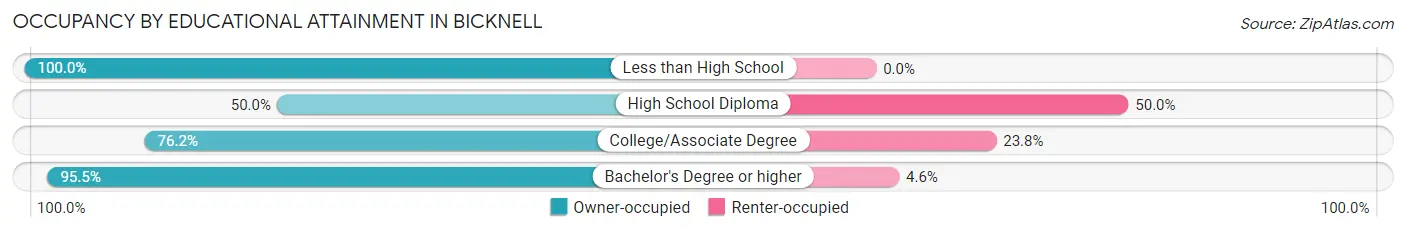
| Household Size | Owner-occupied | Renter-occupied |
| Less than High School | 3 (100.0%) | 0 (0.0%) |
| High School Diploma | 12 (50.0%) | 12 (50.0%) |
| College/Associate Degree | 80 (76.2%) | 25 (23.8%) |
| Bachelor's Degree or higher | 42 (95.5%) | 2 (4.5%) |
Occupancy by Age of Householder in Bicknell
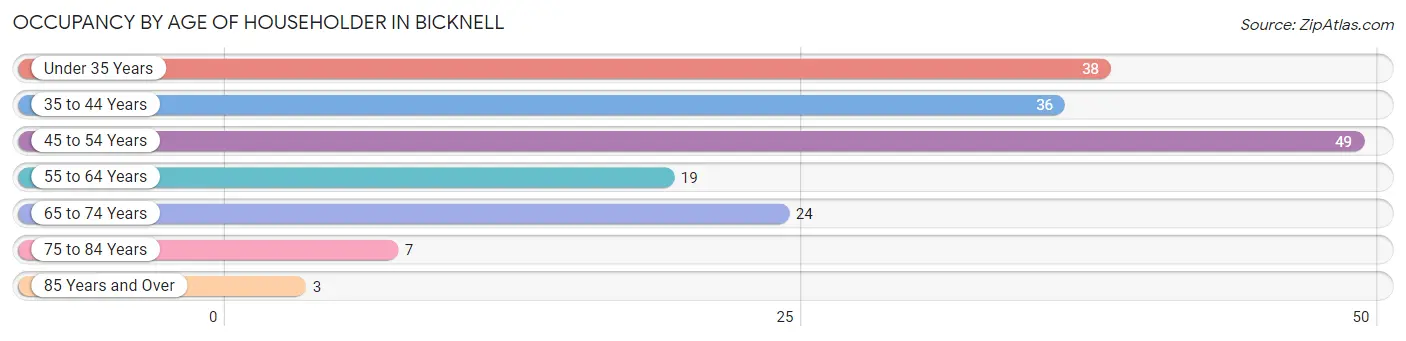
| Age Bracket | # Households | % Households |
| Under 35 Years | 38 | 21.6% |
| 35 to 44 Years | 36 | 20.4% |
| 45 to 54 Years | 49 | 27.8% |
| 55 to 64 Years | 19 | 10.8% |
| 65 to 74 Years | 24 | 13.6% |
| 75 to 84 Years | 7 | 4.0% |
| 85 Years and Over | 3 | 1.7% |
| Total | 176 | 100.0% |
Housing Finances in Bicknell
Median Income by Occupancy in Bicknell
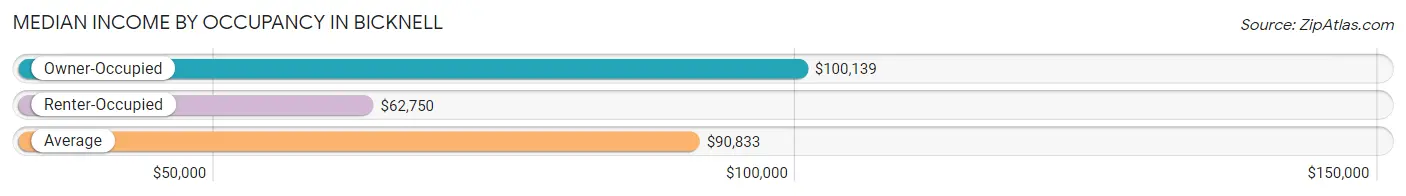
| Occupancy Type | # Households | Median Income |
| Owner-Occupied | 137 (77.8%) | $100,139 |
| Renter-Occupied | 39 (22.2%) | $62,750 |
| Average | 176 (100.0%) | $90,833 |
Occupancy by Householder Income Bracket in Bicknell
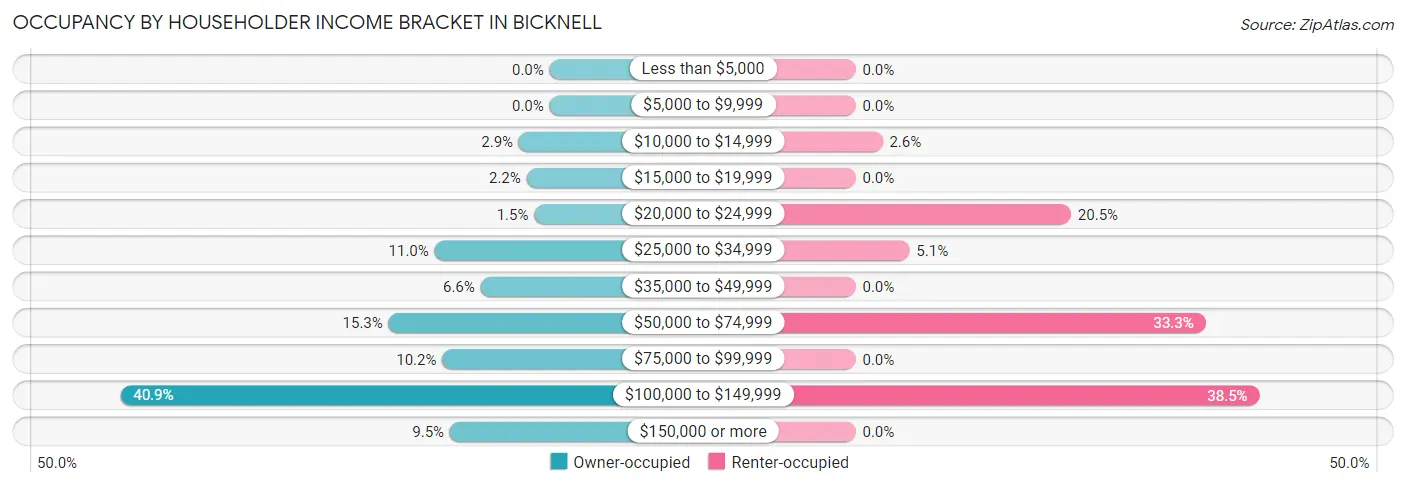
| Income Bracket | Owner-occupied | Renter-occupied |
| Less than $5,000 | 0 (0.0%) | 0 (0.0%) |
| $5,000 to $9,999 | 0 (0.0%) | 0 (0.0%) |
| $10,000 to $14,999 | 4 (2.9%) | 1 (2.6%) |
| $15,000 to $19,999 | 3 (2.2%) | 0 (0.0%) |
| $20,000 to $24,999 | 2 (1.5%) | 8 (20.5%) |
| $25,000 to $34,999 | 15 (11.0%) | 2 (5.1%) |
| $35,000 to $49,999 | 9 (6.6%) | 0 (0.0%) |
| $50,000 to $74,999 | 21 (15.3%) | 13 (33.3%) |
| $75,000 to $99,999 | 14 (10.2%) | 0 (0.0%) |
| $100,000 to $149,999 | 56 (40.9%) | 15 (38.5%) |
| $150,000 or more | 13 (9.5%) | 0 (0.0%) |
| Total | 137 (100.0%) | 39 (100.0%) |
Monthly Housing Cost Tiers in Bicknell
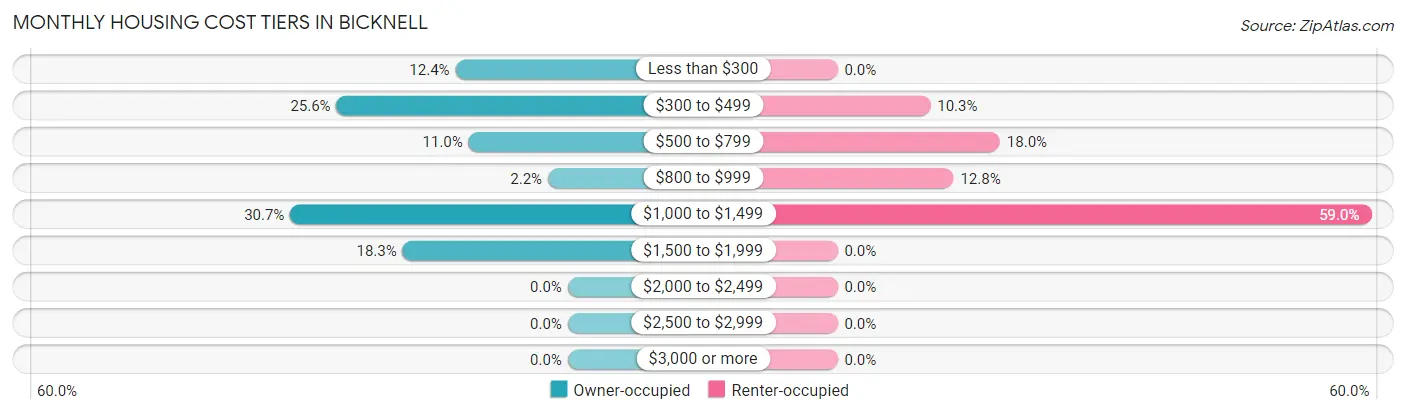
| Monthly Cost | Owner-occupied | Renter-occupied |
| Less than $300 | 17 (12.4%) | 0 (0.0%) |
| $300 to $499 | 35 (25.6%) | 4 (10.3%) |
| $500 to $799 | 15 (11.0%) | 7 (17.9%) |
| $800 to $999 | 3 (2.2%) | 5 (12.8%) |
| $1,000 to $1,499 | 42 (30.7%) | 23 (59.0%) |
| $1,500 to $1,999 | 25 (18.2%) | 0 (0.0%) |
| $2,000 to $2,499 | 0 (0.0%) | 0 (0.0%) |
| $2,500 to $2,999 | 0 (0.0%) | 0 (0.0%) |
| $3,000 or more | 0 (0.0%) | 0 (0.0%) |
| Total | 137 (100.0%) | 39 (100.0%) |
Physical Housing Characteristics in Bicknell
Housing Structures in Bicknell
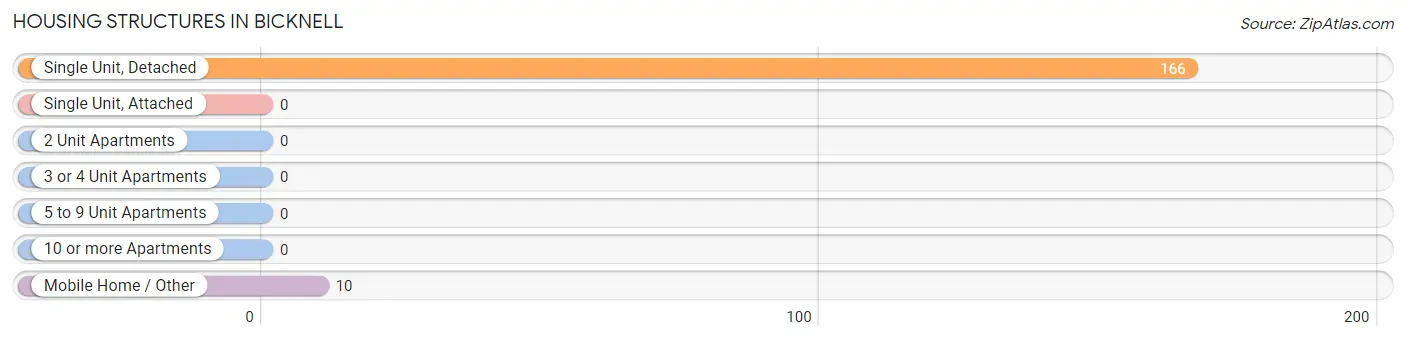
| Structure Type | # Housing Units | % Housing Units |
| Single Unit, Detached | 166 | 94.3% |
| Single Unit, Attached | 0 | 0.0% |
| 2 Unit Apartments | 0 | 0.0% |
| 3 or 4 Unit Apartments | 0 | 0.0% |
| 5 to 9 Unit Apartments | 0 | 0.0% |
| 10 or more Apartments | 0 | 0.0% |
| Mobile Home / Other | 10 | 5.7% |
| Total | 176 | 100.0% |
Housing Structures by Occupancy in Bicknell
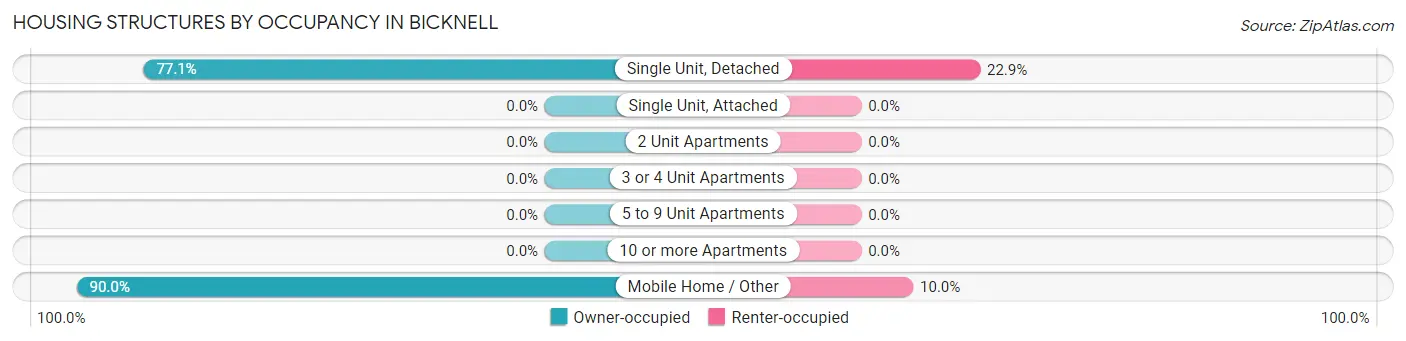
| Structure Type | Owner-occupied | Renter-occupied |
| Single Unit, Detached | 128 (77.1%) | 38 (22.9%) |
| Single Unit, Attached | 0 (0.0%) | 0 (0.0%) |
| 2 Unit Apartments | 0 (0.0%) | 0 (0.0%) |
| 3 or 4 Unit Apartments | 0 (0.0%) | 0 (0.0%) |
| 5 to 9 Unit Apartments | 0 (0.0%) | 0 (0.0%) |
| 10 or more Apartments | 0 (0.0%) | 0 (0.0%) |
| Mobile Home / Other | 9 (90.0%) | 1 (10.0%) |
| Total | 137 (77.8%) | 39 (22.2%) |
Housing Structures by Number of Rooms in Bicknell
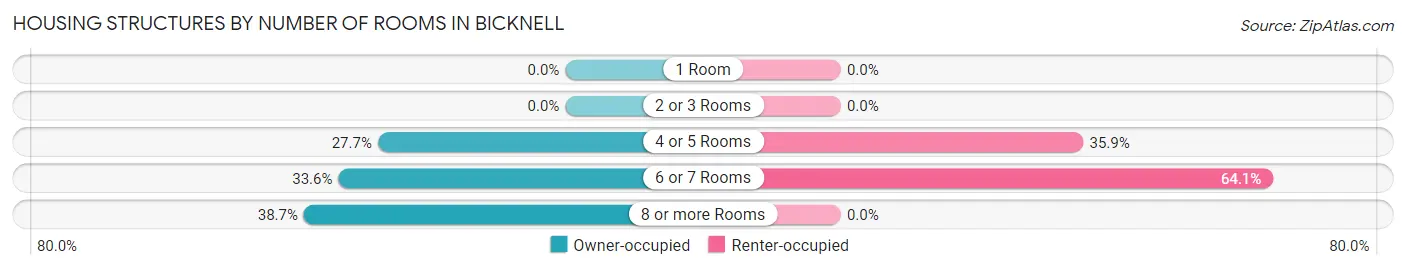
| Number of Rooms | Owner-occupied | Renter-occupied |
| 1 Room | 0 (0.0%) | 0 (0.0%) |
| 2 or 3 Rooms | 0 (0.0%) | 0 (0.0%) |
| 4 or 5 Rooms | 38 (27.7%) | 14 (35.9%) |
| 6 or 7 Rooms | 46 (33.6%) | 25 (64.1%) |
| 8 or more Rooms | 53 (38.7%) | 0 (0.0%) |
| Total | 137 (100.0%) | 39 (100.0%) |
Housing Structure by Heating Type in Bicknell
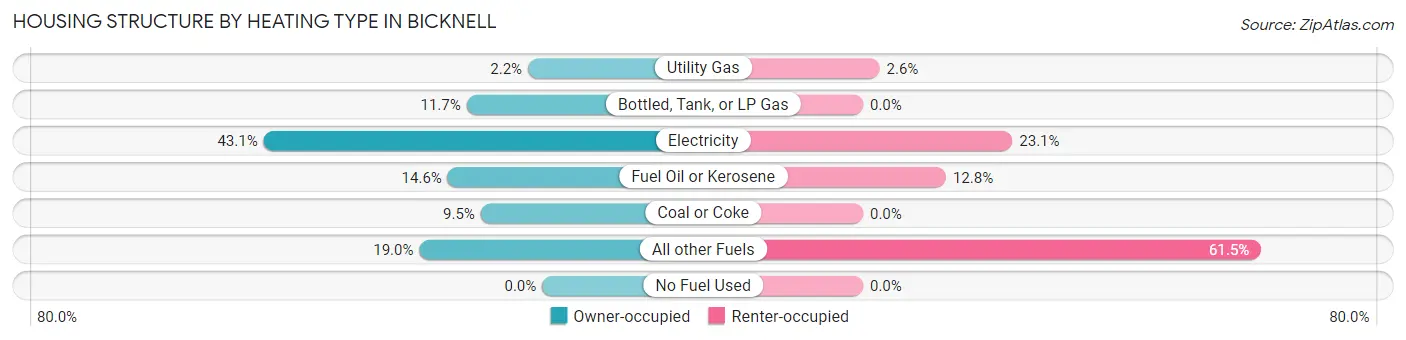
| Heating Type | Owner-occupied | Renter-occupied |
| Utility Gas | 3 (2.2%) | 1 (2.6%) |
| Bottled, Tank, or LP Gas | 16 (11.7%) | 0 (0.0%) |
| Electricity | 59 (43.1%) | 9 (23.1%) |
| Fuel Oil or Kerosene | 20 (14.6%) | 5 (12.8%) |
| Coal or Coke | 13 (9.5%) | 0 (0.0%) |
| All other Fuels | 26 (19.0%) | 24 (61.5%) |
| No Fuel Used | 0 (0.0%) | 0 (0.0%) |
| Total | 137 (100.0%) | 39 (100.0%) |
Household Vehicle Usage in Bicknell
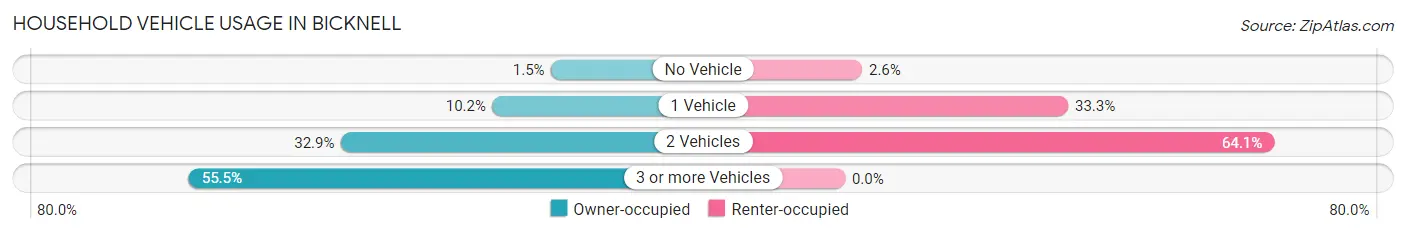
| Vehicles per Household | Owner-occupied | Renter-occupied |
| No Vehicle | 2 (1.5%) | 1 (2.6%) |
| 1 Vehicle | 14 (10.2%) | 13 (33.3%) |
| 2 Vehicles | 45 (32.9%) | 25 (64.1%) |
| 3 or more Vehicles | 76 (55.5%) | 0 (0.0%) |
| Total | 137 (100.0%) | 39 (100.0%) |
Real Estate & Mortgages in Bicknell
Real Estate and Mortgage Overview in Bicknell
| Characteristic | Without Mortgage | With Mortgage |
| Housing Units | 63 | 74 |
| Median Property Value | $253,600 | $360,000 |
| Median Household Income | $69,063 | $9 |
| Monthly Housing Costs | $384 | $0 |
| Real Estate Taxes | $984 | $0 |
Property Value by Mortgage Status in Bicknell
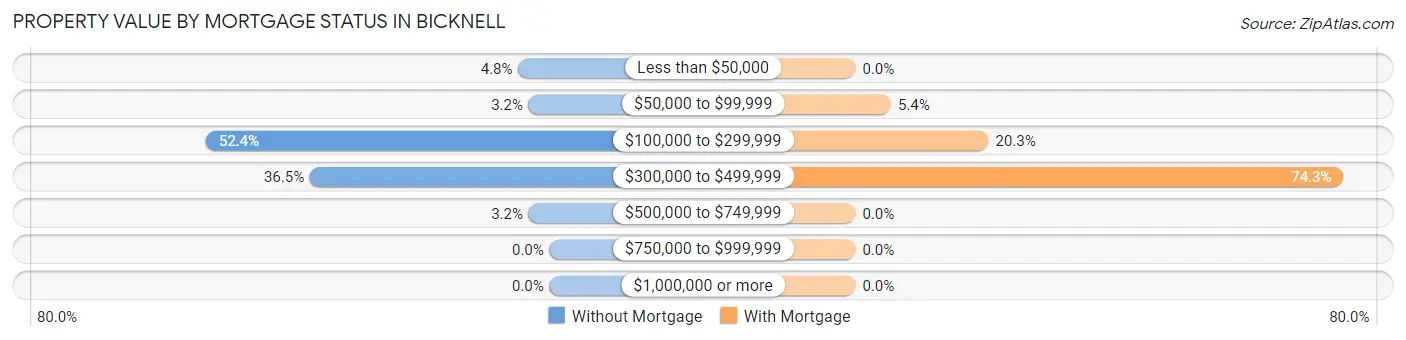
| Property Value | Without Mortgage | With Mortgage |
| Less than $50,000 | 3 (4.8%) | 0 (0.0%) |
| $50,000 to $99,999 | 2 (3.2%) | 4 (5.4%) |
| $100,000 to $299,999 | 33 (52.4%) | 15 (20.3%) |
| $300,000 to $499,999 | 23 (36.5%) | 55 (74.3%) |
| $500,000 to $749,999 | 2 (3.2%) | 0 (0.0%) |
| $750,000 to $999,999 | 0 (0.0%) | 0 (0.0%) |
| $1,000,000 or more | 0 (0.0%) | 0 (0.0%) |
| Total | 63 (100.0%) | 74 (100.0%) |
Household Income by Mortgage Status in Bicknell
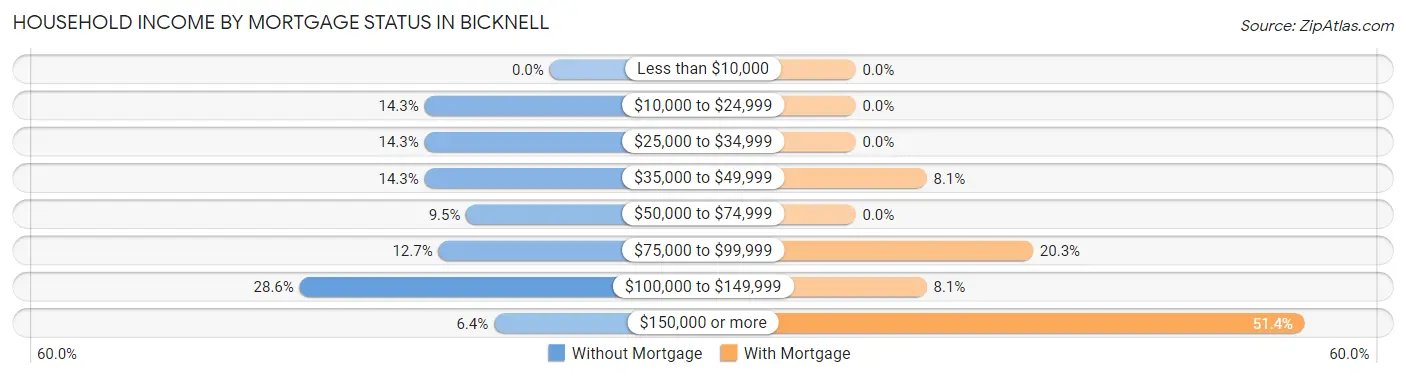
| Household Income | Without Mortgage | With Mortgage |
| Less than $10,000 | 0 (0.0%) | 0 (0.0%) |
| $10,000 to $24,999 | 9 (14.3%) | 0 (0.0%) |
| $25,000 to $34,999 | 9 (14.3%) | 0 (0.0%) |
| $35,000 to $49,999 | 9 (14.3%) | 6 (8.1%) |
| $50,000 to $74,999 | 6 (9.5%) | 0 (0.0%) |
| $75,000 to $99,999 | 8 (12.7%) | 15 (20.3%) |
| $100,000 to $149,999 | 18 (28.6%) | 6 (8.1%) |
| $150,000 or more | 4 (6.4%) | 38 (51.3%) |
| Total | 63 (100.0%) | 74 (100.0%) |
Property Value to Household Income Ratio in Bicknell
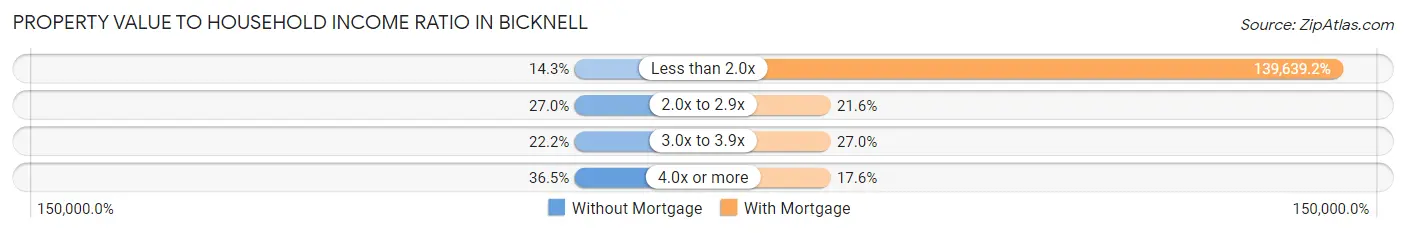
| Value-to-Income Ratio | Without Mortgage | With Mortgage |
| Less than 2.0x | 9 (14.3%) | 103,333 (139,639.2%) |
| 2.0x to 2.9x | 17 (27.0%) | 16 (21.6%) |
| 3.0x to 3.9x | 14 (22.2%) | 20 (27.0%) |
| 4.0x or more | 23 (36.5%) | 13 (17.6%) |
| Total | 63 (100.0%) | 74 (100.0%) |
Real Estate Taxes by Mortgage Status in Bicknell
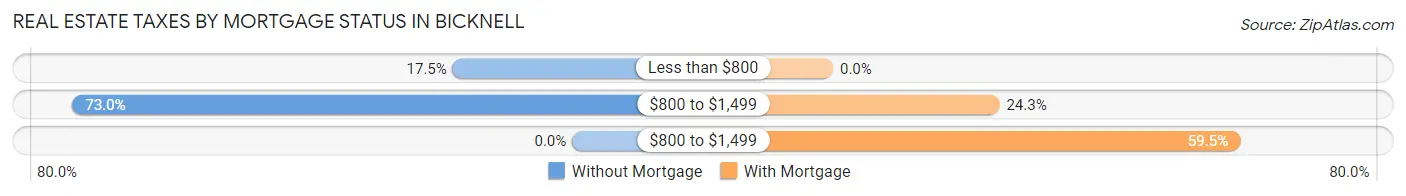
| Property Taxes | Without Mortgage | With Mortgage |
| Less than $800 | 11 (17.5%) | 0 (0.0%) |
| $800 to $1,499 | 46 (73.0%) | 18 (24.3%) |
| $800 to $1,499 | 0 (0.0%) | 44 (59.5%) |
| Total | 63 (100.0%) | 74 (100.0%) |
Health & Disability in Bicknell
Health Insurance Coverage by Age in Bicknell
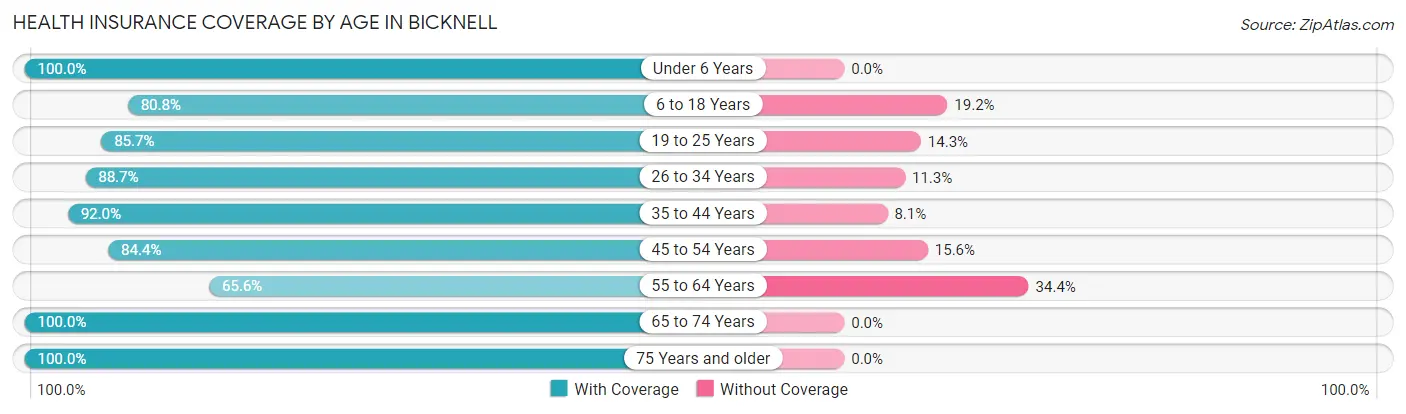
| Age Bracket | With Coverage | Without Coverage |
| Under 6 Years | 39 (100.0%) | 0 (0.0%) |
| 6 to 18 Years | 42 (80.8%) | 10 (19.2%) |
| 19 to 25 Years | 24 (85.7%) | 4 (14.3%) |
| 26 to 34 Years | 47 (88.7%) | 6 (11.3%) |
| 35 to 44 Years | 80 (91.9%) | 7 (8.1%) |
| 45 to 54 Years | 65 (84.4%) | 12 (15.6%) |
| 55 to 64 Years | 21 (65.6%) | 11 (34.4%) |
| 65 to 74 Years | 25 (100.0%) | 0 (0.0%) |
| 75 Years and older | 20 (100.0%) | 0 (0.0%) |
| Total | 363 (87.9%) | 50 (12.1%) |
Health Insurance Coverage by Citizenship Status in Bicknell
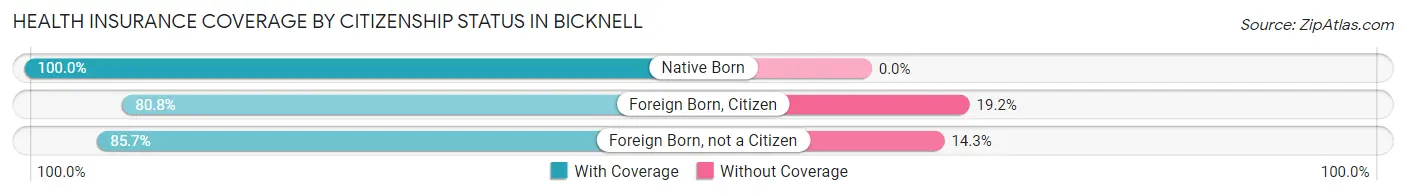
| Citizenship Status | With Coverage | Without Coverage |
| Native Born | 39 (100.0%) | 0 (0.0%) |
| Foreign Born, Citizen | 42 (80.8%) | 10 (19.2%) |
| Foreign Born, not a Citizen | 24 (85.7%) | 4 (14.3%) |
Health Insurance Coverage by Household Income in Bicknell
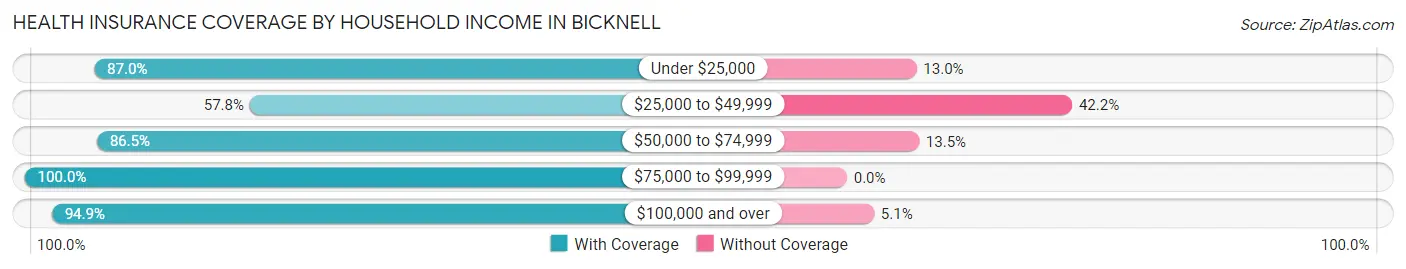
| Household Income | With Coverage | Without Coverage |
| Under $25,000 | 20 (87.0%) | 3 (13.0%) |
| $25,000 to $49,999 | 37 (57.8%) | 27 (42.2%) |
| $50,000 to $74,999 | 64 (86.5%) | 10 (13.5%) |
| $75,000 to $99,999 | 55 (100.0%) | 0 (0.0%) |
| $100,000 and over | 187 (94.9%) | 10 (5.1%) |
Public vs Private Health Insurance Coverage by Age in Bicknell
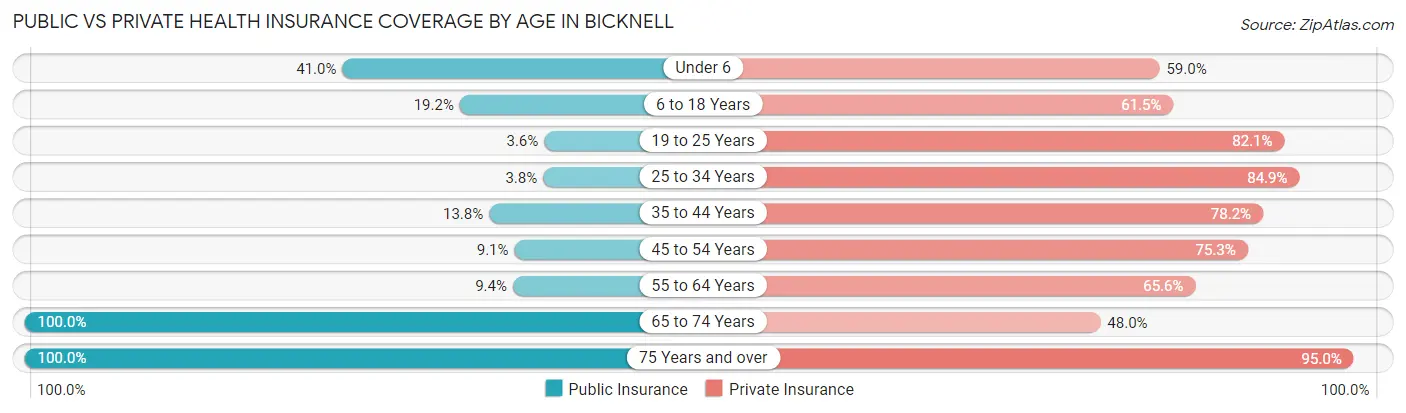
| Age Bracket | Public Insurance | Private Insurance |
| Under 6 | 16 (41.0%) | 23 (59.0%) |
| 6 to 18 Years | 10 (19.2%) | 32 (61.5%) |
| 19 to 25 Years | 1 (3.6%) | 23 (82.1%) |
| 25 to 34 Years | 2 (3.8%) | 45 (84.9%) |
| 35 to 44 Years | 12 (13.8%) | 68 (78.2%) |
| 45 to 54 Years | 7 (9.1%) | 58 (75.3%) |
| 55 to 64 Years | 3 (9.4%) | 21 (65.6%) |
| 65 to 74 Years | 25 (100.0%) | 12 (48.0%) |
| 75 Years and over | 20 (100.0%) | 19 (95.0%) |
| Total | 96 (23.2%) | 301 (72.9%) |
Disability Status by Sex by Age in Bicknell
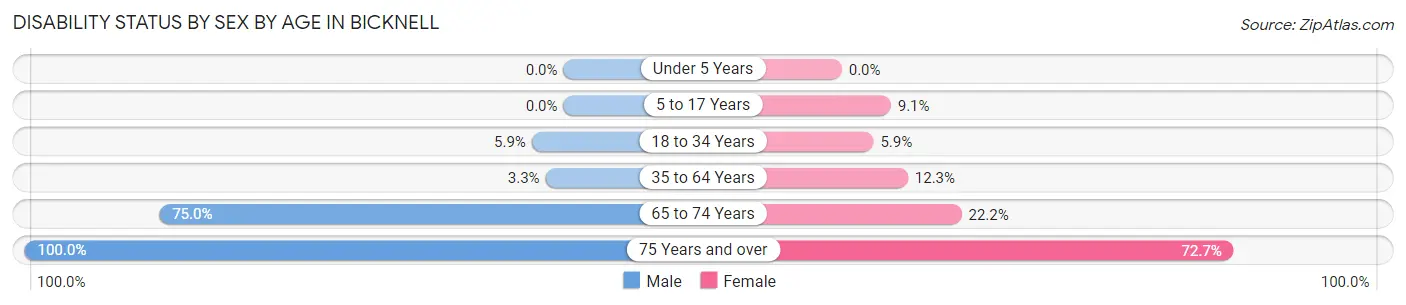
| Age Bracket | Male | Female |
| Under 5 Years | 0 (0.0%) | 0 (0.0%) |
| 5 to 17 Years | 0 (0.0%) | 3 (9.1%) |
| 18 to 34 Years | 2 (5.9%) | 3 (5.9%) |
| 35 to 64 Years | 3 (3.3%) | 13 (12.3%) |
| 65 to 74 Years | 12 (75.0%) | 2 (22.2%) |
| 75 Years and over | 9 (100.0%) | 8 (72.7%) |
Disability Class by Sex by Age in Bicknell
Disability Class: Hearing Difficulty
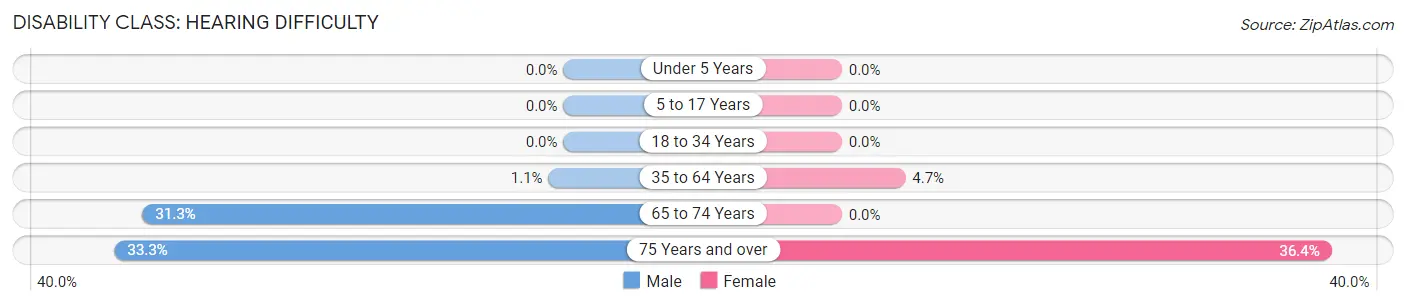
| Age Bracket | Male | Female |
| Under 5 Years | 0 (0.0%) | 0 (0.0%) |
| 5 to 17 Years | 0 (0.0%) | 0 (0.0%) |
| 18 to 34 Years | 0 (0.0%) | 0 (0.0%) |
| 35 to 64 Years | 1 (1.1%) | 5 (4.7%) |
| 65 to 74 Years | 5 (31.2%) | 0 (0.0%) |
| 75 Years and over | 3 (33.3%) | 4 (36.4%) |
Disability Class: Vision Difficulty
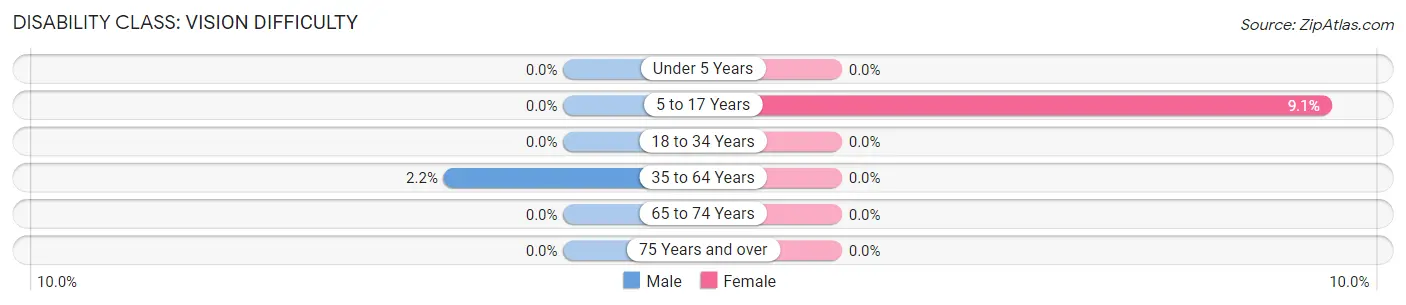
| Age Bracket | Male | Female |
| Under 5 Years | 0 (0.0%) | 0 (0.0%) |
| 5 to 17 Years | 0 (0.0%) | 3 (9.1%) |
| 18 to 34 Years | 0 (0.0%) | 0 (0.0%) |
| 35 to 64 Years | 2 (2.2%) | 0 (0.0%) |
| 65 to 74 Years | 0 (0.0%) | 0 (0.0%) |
| 75 Years and over | 0 (0.0%) | 0 (0.0%) |
Disability Class: Cognitive Difficulty
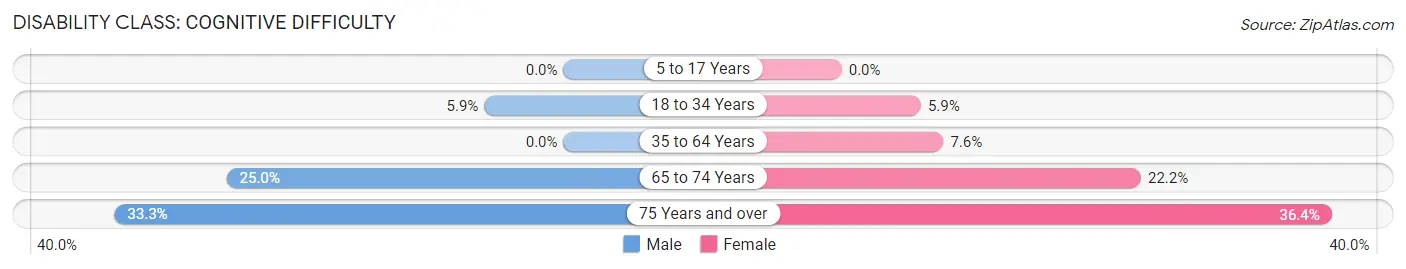
| Age Bracket | Male | Female |
| 5 to 17 Years | 0 (0.0%) | 0 (0.0%) |
| 18 to 34 Years | 2 (5.9%) | 3 (5.9%) |
| 35 to 64 Years | 0 (0.0%) | 8 (7.5%) |
| 65 to 74 Years | 4 (25.0%) | 2 (22.2%) |
| 75 Years and over | 3 (33.3%) | 4 (36.4%) |
Disability Class: Ambulatory Difficulty
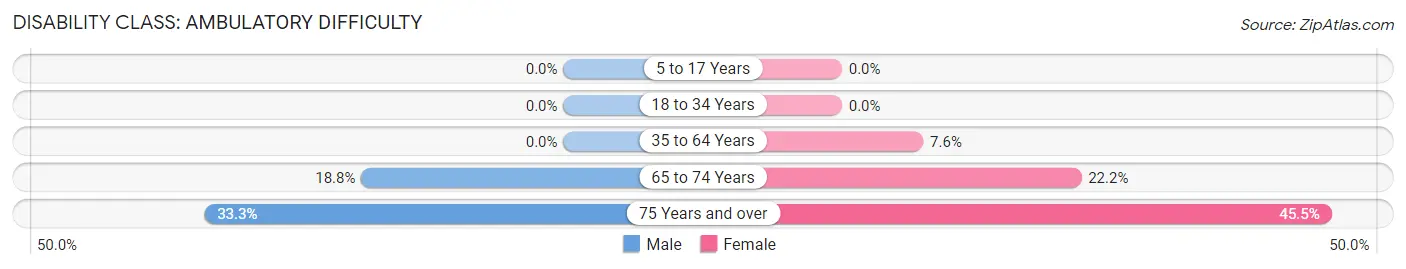
| Age Bracket | Male | Female |
| 5 to 17 Years | 0 (0.0%) | 0 (0.0%) |
| 18 to 34 Years | 0 (0.0%) | 0 (0.0%) |
| 35 to 64 Years | 0 (0.0%) | 8 (7.5%) |
| 65 to 74 Years | 3 (18.8%) | 2 (22.2%) |
| 75 Years and over | 3 (33.3%) | 5 (45.5%) |
Disability Class: Self-Care Difficulty
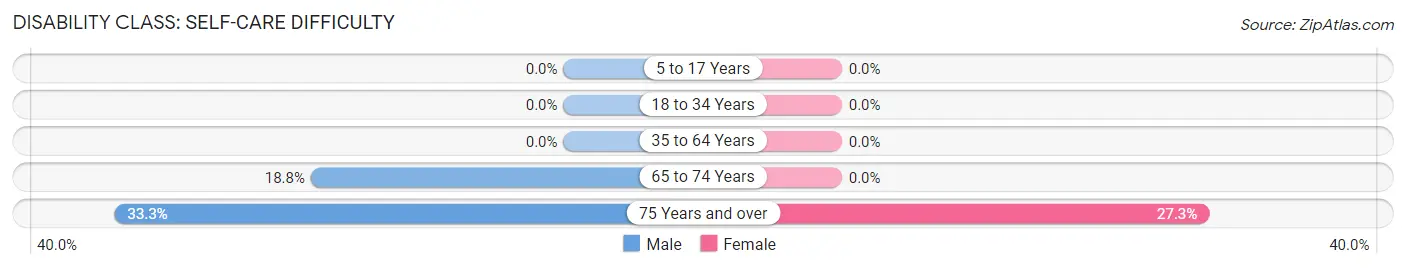
| Age Bracket | Male | Female |
| 5 to 17 Years | 0 (0.0%) | 0 (0.0%) |
| 18 to 34 Years | 0 (0.0%) | 0 (0.0%) |
| 35 to 64 Years | 0 (0.0%) | 0 (0.0%) |
| 65 to 74 Years | 3 (18.8%) | 0 (0.0%) |
| 75 Years and over | 3 (33.3%) | 3 (27.3%) |
Technology Access in Bicknell
Computing Device Access in Bicknell
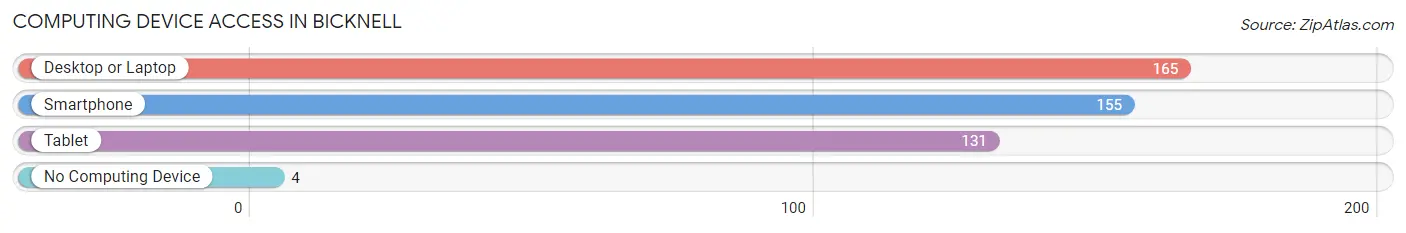
| Device Type | # Households | % Households |
| Desktop or Laptop | 165 | 93.8% |
| Smartphone | 155 | 88.1% |
| Tablet | 131 | 74.4% |
| No Computing Device | 4 | 2.3% |
| Total | 176 | 100.0% |
Internet Access in Bicknell
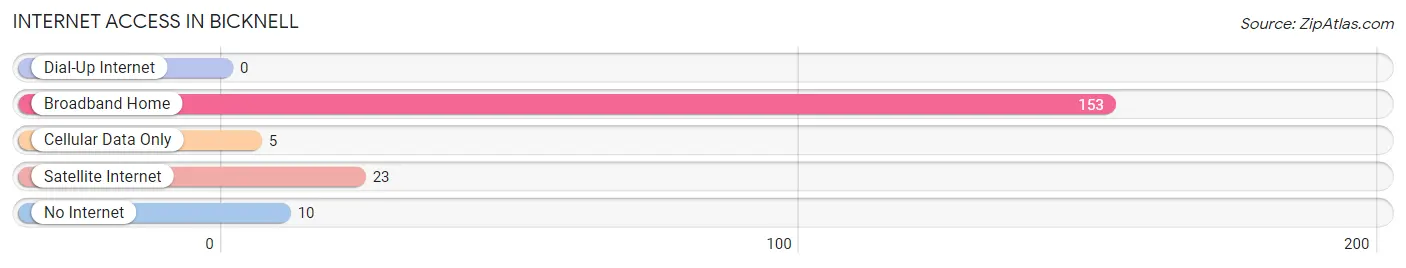
| Internet Type | # Households | % Households |
| Dial-Up Internet | 0 | 0.0% |
| Broadband Home | 153 | 86.9% |
| Cellular Data Only | 5 | 2.8% |
| Satellite Internet | 23 | 13.1% |
| No Internet | 10 | 5.7% |
| Total | 176 | 100.0% |
Bicknell Summary
Bicknell is a small town located in Wayne County, Utah, United States. It is situated in the south-central part of the state, approximately 20 miles south of the city of Richfield. The population of Bicknell was estimated to be 645 in 2019.
History
Bicknell was founded in 1891 by a group of settlers from the Church of Jesus Christ of Latter-day Saints. The town was named after William Bicknell, a prominent early settler. The town was incorporated in 1895 and has remained a small, rural community ever since.
Geography
Bicknell is located in the south-central part of Utah, approximately 20 miles south of the city of Richfield. The town is situated in a valley surrounded by the Tushar Mountains to the east and the Pahvant Range to the west. The town is located at an elevation of 5,890 feet above sea level.
Economy
The economy of Bicknell is largely based on agriculture and tourism. The town is home to several farms and ranches, which produce a variety of crops and livestock. Tourism is also an important part of the local economy, as the town is located near several popular outdoor recreation areas, including the Fishlake National Forest and the Grand Staircase-Escalante National Monument.
Demographics
As of the 2019 census, the population of Bicknell was estimated to be 645. The racial makeup of the town was 95.2% White, 0.2% African American, 0.2% Native American, 0.2% Asian, 0.2% Pacific Islander, 0.2% from other races, and 3.9% from two or more races. The median household income was $41,250, and the median family income was $45,000. The per capita income was $17,845.
Conclusion
Bicknell is a small town located in Wayne County, Utah, United States. It was founded in 1891 by a group of settlers from the Church of Jesus Christ of Latter-day Saints and has remained a small, rural community ever since. The town is situated in a valley surrounded by the Tushar Mountains to the east and the Pahvant Range to the west. The economy of Bicknell is largely based on agriculture and tourism. As of the 2019 census, the population of Bicknell was estimated to be 645. The racial makeup of the town was 95.2% White, 0.2% African American, 0.2% Native American, 0.2% Asian, 0.2% Pacific Islander, 0.2% from other races, and 3.9% from two or more races. The median household income was $41,250, and the median family income was $45,000. The per capita income was $17,845.
Common Questions
What is Per Capita Income in Bicknell?
Per Capita income in Bicknell is $35,366.
What is the Median Family Income in Bicknell?
Median Family Income in Bicknell is $102,639.
What is the Median Household income in Bicknell?
Median Household Income in Bicknell is $90,833.
What is Income or Wage Gap in Bicknell?
Income or Wage Gap in Bicknell is 32.0%.
Women in Bicknell earn 68.0 cents for every dollar earned by a man.
What is Inequality or Gini Index in Bicknell?
Inequality or Gini Index in Bicknell is 0.37.
What is the Total Population of Bicknell?
Total Population of Bicknell is 413.
What is the Total Male Population of Bicknell?
Total Male Population of Bicknell is 179.
What is the Total Female Population of Bicknell?
Total Female Population of Bicknell is 234.
What is the Ratio of Males per 100 Females in Bicknell?
There are 76.50 Males per 100 Females in Bicknell.
What is the Ratio of Females per 100 Males in Bicknell?
There are 130.73 Females per 100 Males in Bicknell.
What is the Median Population Age in Bicknell?
Median Population Age in Bicknell is 40.6 Years.
What is the Average Family Size in Bicknell
Average Family Size in Bicknell is 2.5 People.
What is the Average Household Size in Bicknell
Average Household Size in Bicknell is 2.4 People.
How Large is the Labor Force in Bicknell?
There are 241 People in the Labor Forcein in Bicknell.
What is the Percentage of People in the Labor Force in Bicknell?
72.4% of People are in the Labor Force in Bicknell.
What is the Unemployment Rate in Bicknell?
Unemployment Rate in Bicknell is 0.8%.