Pine Valley, UT Map & Demographics
Pine Valley Map
Pine Valley Overview
$50,100
PER CAPITA INCOME
$128,839
AVG FAMILY INCOME
$119,145
AVG HOUSEHOLD INCOME
0.28
INEQUALITY / GINI INDEX
310
TOTAL POPULATION
213
MALE POPULATION
97
FEMALE POPULATION
219.59
MALES / 100 FEMALES
45.54
FEMALES / 100 MALES
59.7
MEDIAN AGE
2.9
AVG FAMILY SIZE
2.4
AVG HOUSEHOLD SIZE
133
LABOR FORCE [ PEOPLE ]
50.8%
PERCENT IN LABOR FORCE
Pine Valley Zip Codes
Pine Valley Area Codes
Income in Pine Valley
Income Overview in Pine Valley
Per Capita Income in Pine Valley is $50,100, while median incomes of families and households are $128,839 and $119,145 respectively.
| Characteristic | Number | Measure |
| Per Capita Income | 310 | $50,100 |
| Median Family Income | 99 | $128,839 |
| Mean Family Income | 99 | $129,303 |
| Median Household Income | 127 | $119,145 |
| Mean Household Income | 127 | $113,683 |
| Income Deficit | 99 | $0 |
| Wage / Income Gap (%) | 310 | 0.00% |
| Wage / Income Gap ($) | 310 | 100.00¢ per $1 |
| Gini / Inequality Index | 310 | 0.28 |
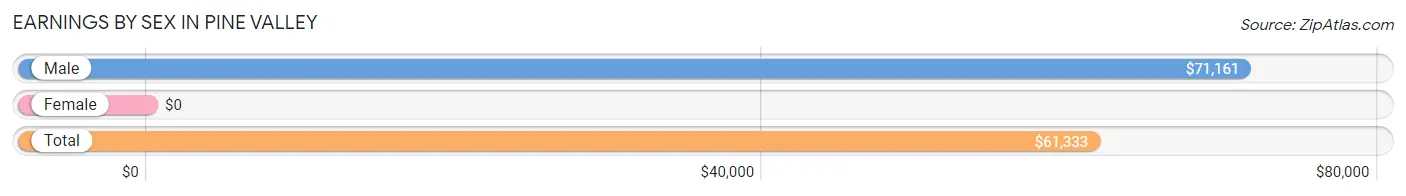
Earnings by Sex in Pine Valley
| Sex | Number | Average Earnings |
| Male | 115 (81.0%) | $71,161 |
| Female | 27 (19.0%) | $0 |
| Total | 142 (100.0%) | $61,333 |
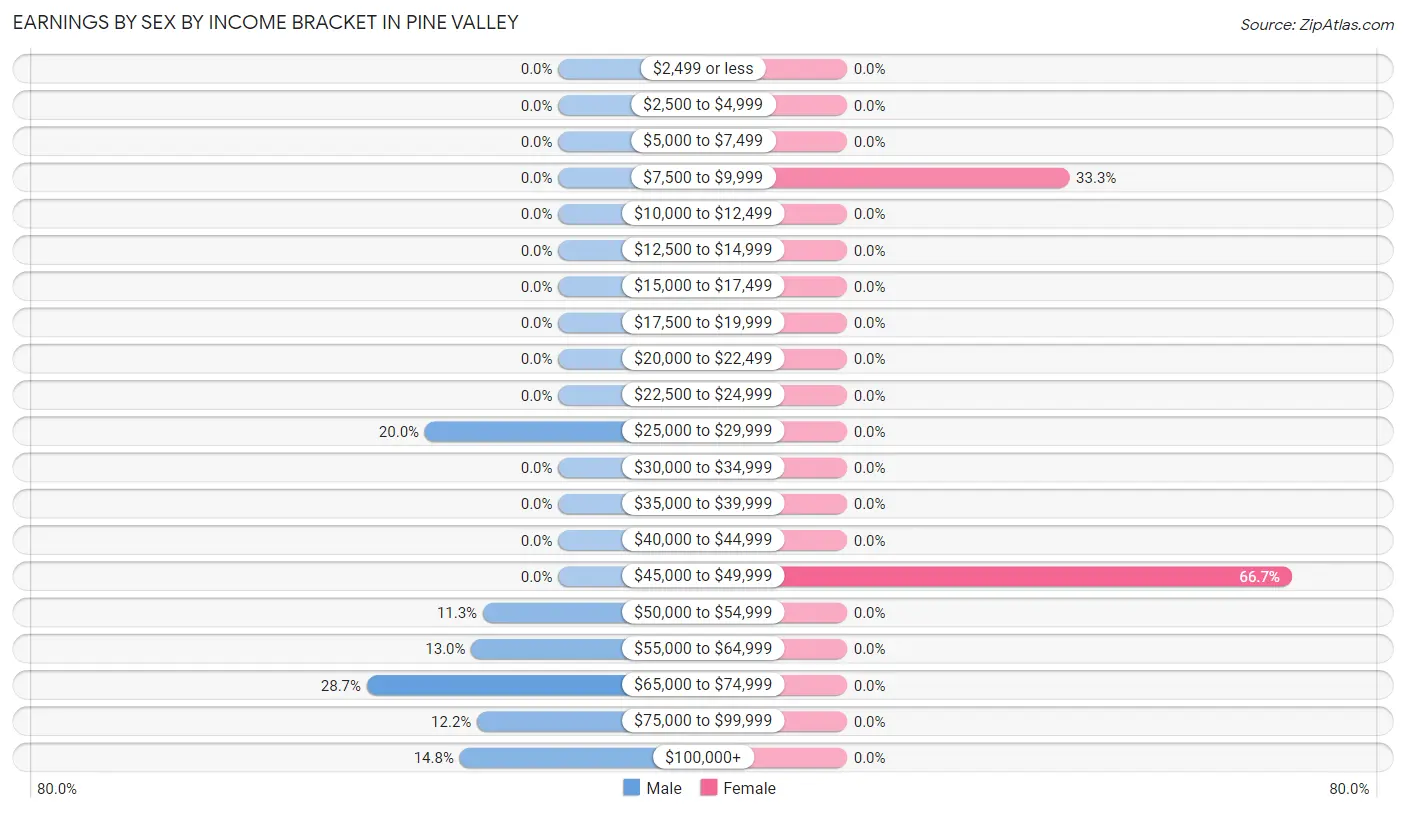
Earnings by Sex by Income Bracket in Pine Valley
The most common earnings brackets in Pine Valley are $65,000 to $74,999 for men (33 | 28.7%) and $45,000 to $49,999 for women (18 | 66.7%).
| Income | Male | Female |
| $2,499 or less | 0 (0.0%) | 0 (0.0%) |
| $2,500 to $4,999 | 0 (0.0%) | 0 (0.0%) |
| $5,000 to $7,499 | 0 (0.0%) | 0 (0.0%) |
| $7,500 to $9,999 | 0 (0.0%) | 9 (33.3%) |
| $10,000 to $12,499 | 0 (0.0%) | 0 (0.0%) |
| $12,500 to $14,999 | 0 (0.0%) | 0 (0.0%) |
| $15,000 to $17,499 | 0 (0.0%) | 0 (0.0%) |
| $17,500 to $19,999 | 0 (0.0%) | 0 (0.0%) |
| $20,000 to $22,499 | 0 (0.0%) | 0 (0.0%) |
| $22,500 to $24,999 | 0 (0.0%) | 0 (0.0%) |
| $25,000 to $29,999 | 23 (20.0%) | 0 (0.0%) |
| $30,000 to $34,999 | 0 (0.0%) | 0 (0.0%) |
| $35,000 to $39,999 | 0 (0.0%) | 0 (0.0%) |
| $40,000 to $44,999 | 0 (0.0%) | 0 (0.0%) |
| $45,000 to $49,999 | 0 (0.0%) | 18 (66.7%) |
| $50,000 to $54,999 | 13 (11.3%) | 0 (0.0%) |
| $55,000 to $64,999 | 15 (13.0%) | 0 (0.0%) |
| $65,000 to $74,999 | 33 (28.7%) | 0 (0.0%) |
| $75,000 to $99,999 | 14 (12.2%) | 0 (0.0%) |
| $100,000+ | 17 (14.8%) | 0 (0.0%) |
| Total | 115 (100.0%) | 27 (100.0%) |
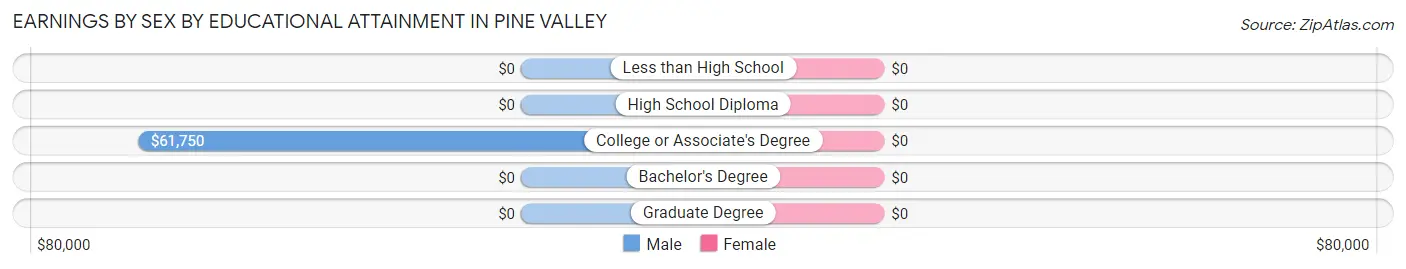
Earnings by Sex by Educational Attainment in Pine Valley
| Educational Attainment | Male Income | Female Income |
| Less than High School | - | - |
| High School Diploma | - | - |
| College or Associate's Degree | $61,750 | $0 |
| Bachelor's Degree | - | - |
| Graduate Degree | - | - |
| Total | $71,161 | $0 |
Family Income in Pine Valley
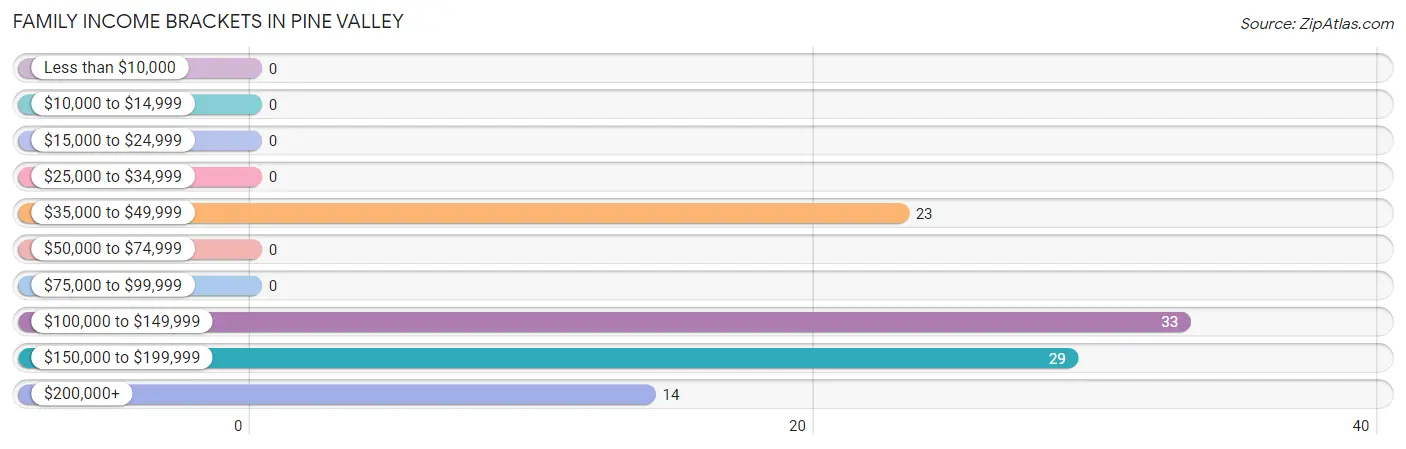
Family Income Brackets in Pine Valley
According to the Pine Valley family income data, there are 33 families falling into the $100,000 to $149,999 income range, which is the most common income bracket and makes up 33.3% of all families.
| Income Bracket | # Families | % Families |
| Less than $10,000 | 0 | 0.0% |
| $10,000 to $14,999 | 0 | 0.0% |
| $15,000 to $24,999 | 0 | 0.0% |
| $25,000 to $34,999 | 0 | 0.0% |
| $35,000 to $49,999 | 23 | 23.2% |
| $50,000 to $74,999 | 0 | 0.0% |
| $75,000 to $99,999 | 0 | 0.0% |
| $100,000 to $149,999 | 33 | 33.3% |
| $150,000 to $199,999 | 29 | 29.3% |
| $200,000+ | 14 | 14.1% |
Family Income by Famaliy Size in Pine Valley
| Income Bracket | # Families | Median Income |
| 2-Person Families | 57 (57.6%) | $0 |
| 3-Person Families | 23 (23.2%) | $0 |
| 4-Person Families | 0 (0.0%) | $0 |
| 5-Person Families | 19 (19.2%) | $0 |
| 6-Person Families | 0 (0.0%) | $0 |
| 7+ Person Families | 0 (0.0%) | $0 |
| Total | 99 (100.0%) | $128,839 |
Family Income by Number of Earners in Pine Valley
| Number of Earners | # Families | Median Income |
| No Earners | 20 (20.2%) | $0 |
| 1 Earner | 51 (51.5%) | $0 |
| 2 Earners | 28 (28.3%) | $0 |
| 3+ Earners | 0 (0.0%) | $0 |
| Total | 99 (100.0%) | $128,839 |
Household Income in Pine Valley
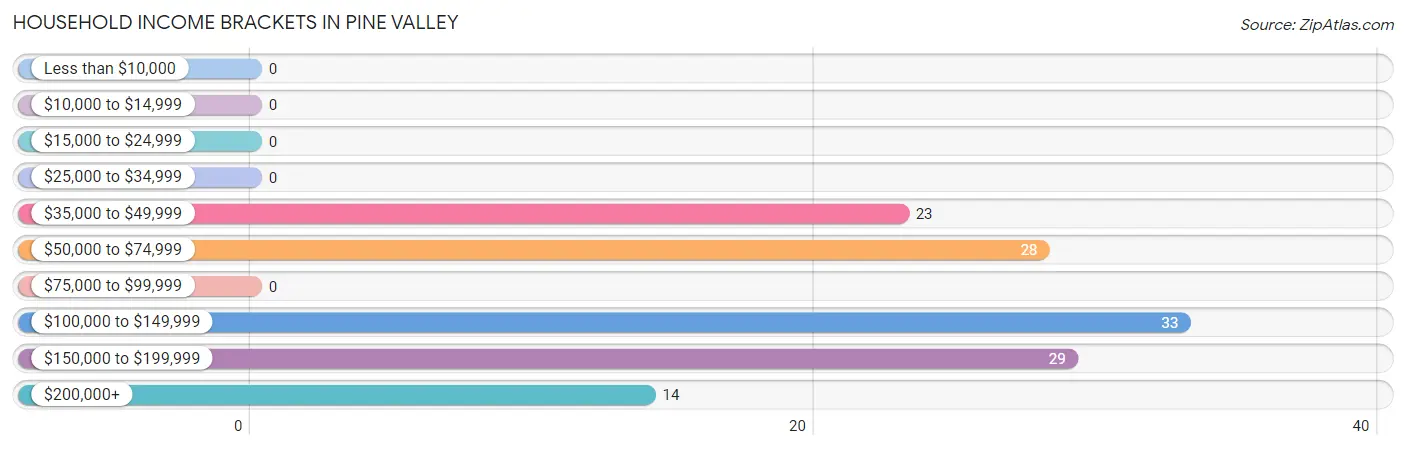
Household Income Brackets in Pine Valley
With 33 households falling in the category, the $100,000 to $149,999 income range is the most frequent in Pine Valley, accounting for 26.0% of all households.
| Income Bracket | # Households | % Households |
| Less than $10,000 | 0 | 0.0% |
| $10,000 to $14,999 | 0 | 0.0% |
| $15,000 to $24,999 | 0 | 0.0% |
| $25,000 to $34,999 | 0 | 0.0% |
| $35,000 to $49,999 | 23 | 18.1% |
| $50,000 to $74,999 | 28 | 22.0% |
| $75,000 to $99,999 | 0 | 0.0% |
| $100,000 to $149,999 | 33 | 26.0% |
| $150,000 to $199,999 | 29 | 22.8% |
| $200,000+ | 14 | 11.0% |
Household Income by Householder Age in Pine Valley
| Income Bracket | # Households | Median Income |
| 15 to 24 Years | 0 (0.0%) | $0 |
| 25 to 44 Years | 33 (26.0%) | $0 |
| 45 to 64 Years | 62 (48.8%) | $0 |
| 65+ Years | 32 (25.2%) | $0 |
| Total | 127 (100.0%) | $119,145 |
Poverty in Pine Valley
Income Below Poverty by Sex and Age in Pine Valley
| Age Bracket | Male | Female |
| Under 5 Years | 0 (0.0%) | 0 (0.0%) |
| 5 Years | 0 (0.0%) | 0 (0.0%) |
| 6 to 11 Years | 0 (0.0%) | 0 (0.0%) |
| 12 to 14 Years | 0 (0.0%) | 0 (0.0%) |
| 15 Years | 0 (0.0%) | 0 (0.0%) |
| 16 and 17 Years | 0 (0.0%) | 0 (0.0%) |
| 18 to 24 Years | 0 (0.0%) | 0 (0.0%) |
| 25 to 34 Years | 0 (0.0%) | 0 (0.0%) |
| 35 to 44 Years | 0 (0.0%) | 0 (0.0%) |
| 45 to 54 Years | 0 (0.0%) | 0 (0.0%) |
| 55 to 64 Years | 0 (0.0%) | 0 (0.0%) |
| 65 to 74 Years | 0 (0.0%) | 0 (0.0%) |
| 75 Years and over | 0 (0.0%) | 0 (0.0%) |
| Total | 0 (0.0%) | 0 (0.0%) |
Income Above Poverty by Sex and Age in Pine Valley
According to the poverty statistics in Pine Valley, males aged under 5 years and females aged 25 to 34 years are the age groups that are most secure financially, with 100.0% of males and 100.0% of females in these age groups living above the poverty line.
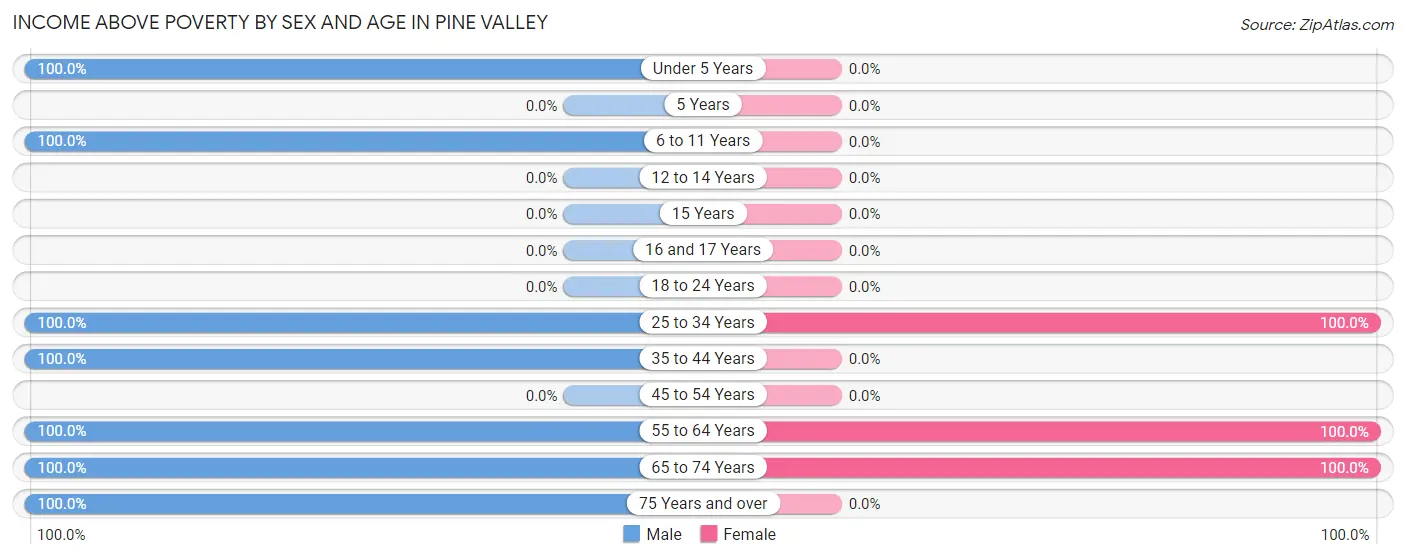
| Age Bracket | Male | Female |
| Under 5 Years | 14 (100.0%) | 0 (0.0%) |
| 5 Years | 0 (0.0%) | 0 (0.0%) |
| 6 to 11 Years | 34 (100.0%) | 0 (0.0%) |
| 12 to 14 Years | 0 (0.0%) | 0 (0.0%) |
| 15 Years | 0 (0.0%) | 0 (0.0%) |
| 16 and 17 Years | 0 (0.0%) | 0 (0.0%) |
| 18 to 24 Years | 0 (0.0%) | 0 (0.0%) |
| 25 to 34 Years | 28 (100.0%) | 18 (100.0%) |
| 35 to 44 Years | 19 (100.0%) | 0 (0.0%) |
| 45 to 54 Years | 0 (0.0%) | 0 (0.0%) |
| 55 to 64 Years | 85 (100.0%) | 48 (100.0%) |
| 65 to 74 Years | 23 (100.0%) | 31 (100.0%) |
| 75 Years and over | 10 (100.0%) | 0 (0.0%) |
| Total | 213 (100.0%) | 97 (100.0%) |
Income Below Poverty Among Married-Couple Families in Pine Valley
| Children | Above Poverty | Below Poverty |
| No Children | 66 (100.0%) | 0 (0.0%) |
| 1 or 2 Children | 0 (0.0%) | 0 (0.0%) |
| 3 or 4 Children | 19 (100.0%) | 0 (0.0%) |
| 5 or more Children | 0 (0.0%) | 0 (0.0%) |
| Total | 85 (100.0%) | 0 (0.0%) |
Income Below Poverty Among Single-Parent Households in Pine Valley
| Children | Single Father | Single Mother |
| No Children | 0 (0.0%) | 0 (0.0%) |
| 1 or 2 Children | 0 (0.0%) | 0 (0.0%) |
| 3 or 4 Children | 0 (0.0%) | 0 (0.0%) |
| 5 or more Children | 0 (0.0%) | 0 (0.0%) |
| Total | 0 (0.0%) | 0 (0.0%) |
Income Below Poverty Among Married-Couple vs Single-Parent Households in Pine Valley
| Children | Married-Couple Families | Single-Parent Households |
| No Children | 0 (0.0%) | 0 (0.0%) |
| 1 or 2 Children | 0 (0.0%) | 0 (0.0%) |
| 3 or 4 Children | 0 (0.0%) | 0 (0.0%) |
| 5 or more Children | 0 (0.0%) | 0 (0.0%) |
| Total | 0 (0.0%) | 0 (0.0%) |
Race in Pine Valley
The most populous races in Pine Valley are , and White / Caucasian (310 | 100.0%).
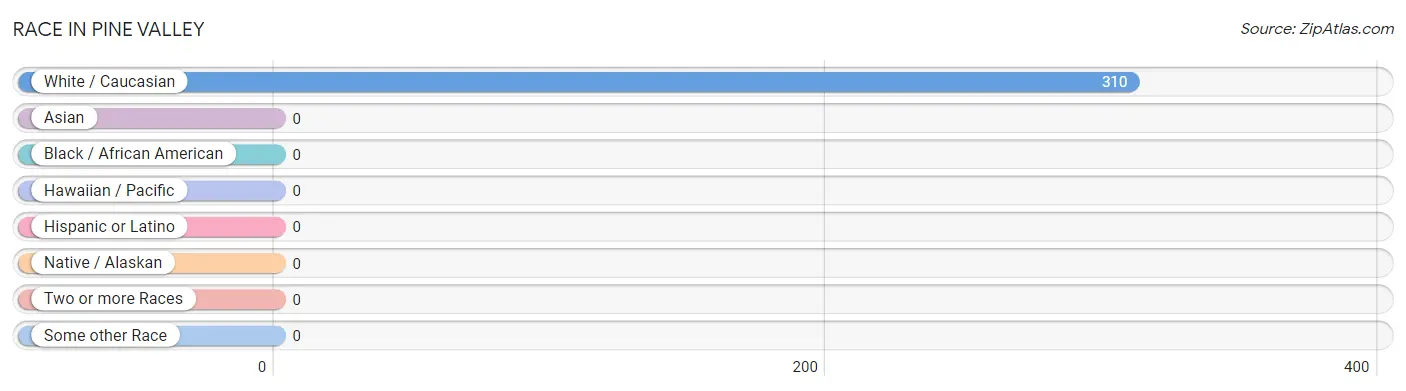
| Race | # Population | % Population |
| Asian | 0 | 0.0% |
| Black / African American | 0 | 0.0% |
| Hawaiian / Pacific | 0 | 0.0% |
| Hispanic or Latino | 0 | 0.0% |
| Native / Alaskan | 0 | 0.0% |
| White / Caucasian | 310 | 100.0% |
| Two or more Races | 0 | 0.0% |
| Some other Race | 0 | 0.0% |
| Total | 310 | 100.0% |
Ancestry in Pine Valley
The most populous ancestries reported in Pine Valley are American (85 | 27.4%), German (71 | 22.9%), English (68 | 21.9%), Czech (38 | 12.3%), and European (33 | 10.6%), together accounting for 95.2% of all Pine Valley residents.
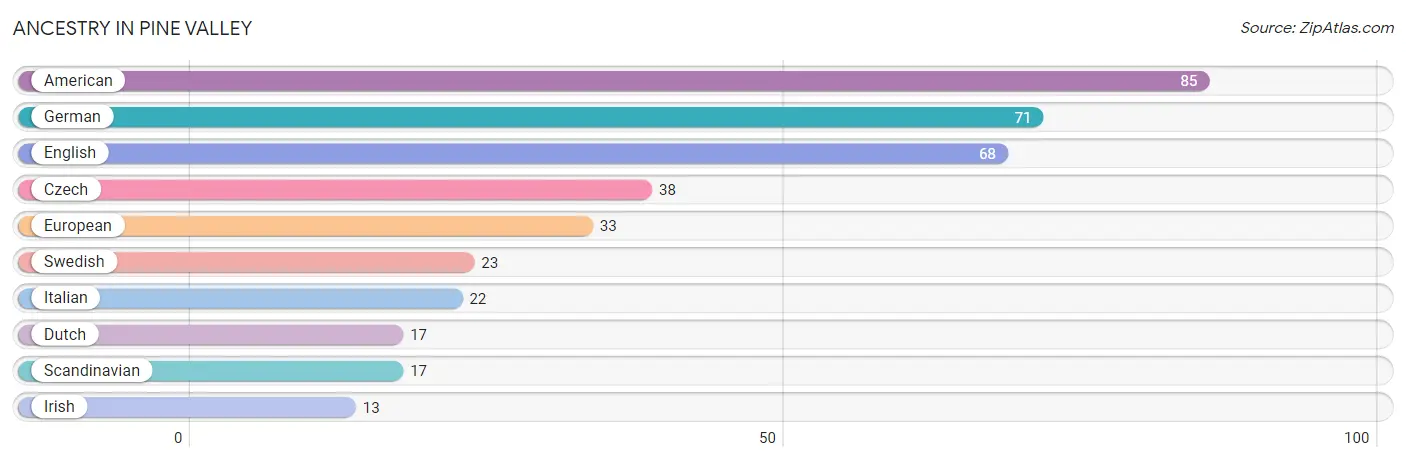
| Ancestry | # Population | % Population |
| American | 85 | 27.4% |
| Czech | 38 | 12.3% |
| Dutch | 17 | 5.5% |
| English | 68 | 21.9% |
| European | 33 | 10.6% |
| German | 71 | 22.9% |
| Irish | 13 | 4.2% |
| Italian | 22 | 7.1% |
| Scandinavian | 17 | 5.5% |
| Swedish | 23 | 7.4% | View All 10 Rows |
Immigrants in Pine Valley

| Immigration Origin | # Population | % Population | View All 0 Rows |
Sex and Age in Pine Valley
Sex and Age in Pine Valley
The most populous age groups in Pine Valley are 55 to 59 Years (48 | 22.5%) for men and 60 to 64 Years (48 | 49.5%) for women.
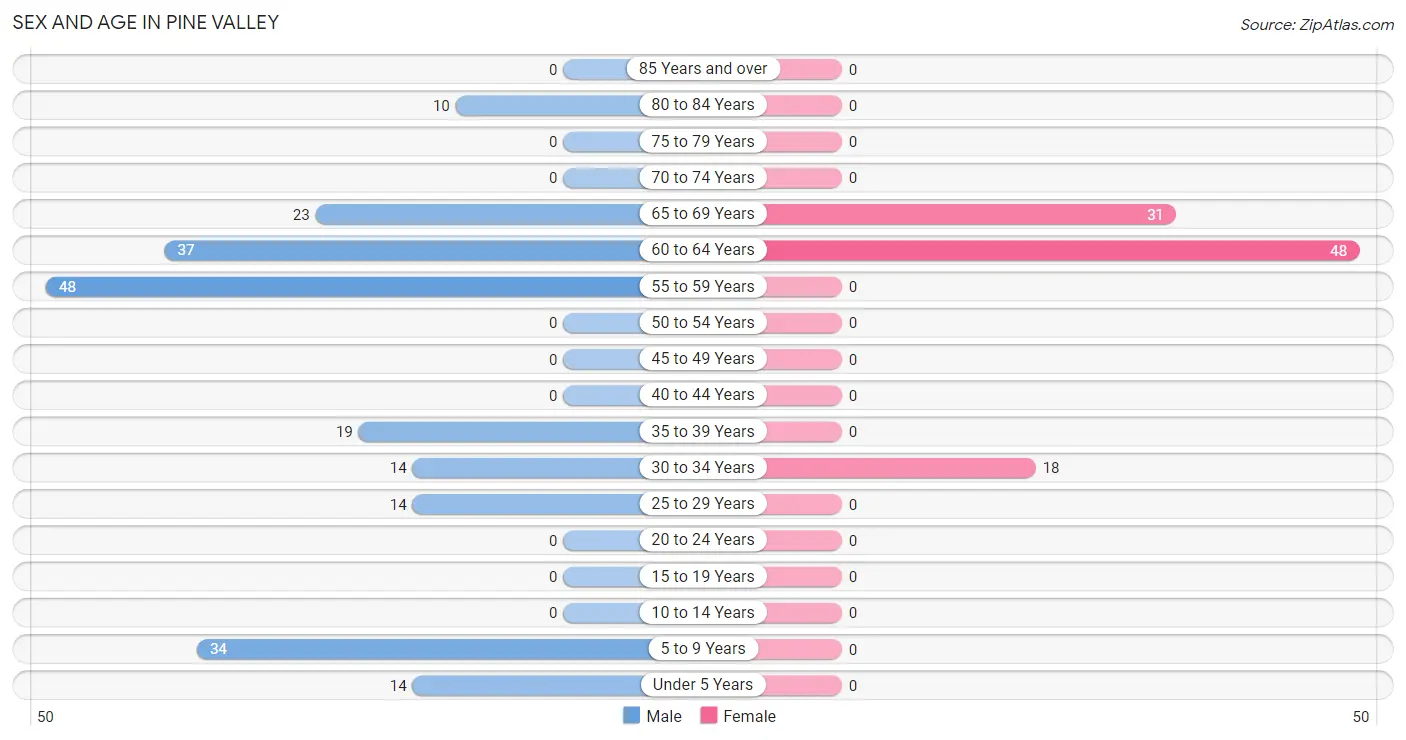
| Age Bracket | Male | Female |
| Under 5 Years | 14 (6.6%) | 0 (0.0%) |
| 5 to 9 Years | 34 (16.0%) | 0 (0.0%) |
| 10 to 14 Years | 0 (0.0%) | 0 (0.0%) |
| 15 to 19 Years | 0 (0.0%) | 0 (0.0%) |
| 20 to 24 Years | 0 (0.0%) | 0 (0.0%) |
| 25 to 29 Years | 14 (6.6%) | 0 (0.0%) |
| 30 to 34 Years | 14 (6.6%) | 18 (18.6%) |
| 35 to 39 Years | 19 (8.9%) | 0 (0.0%) |
| 40 to 44 Years | 0 (0.0%) | 0 (0.0%) |
| 45 to 49 Years | 0 (0.0%) | 0 (0.0%) |
| 50 to 54 Years | 0 (0.0%) | 0 (0.0%) |
| 55 to 59 Years | 48 (22.5%) | 0 (0.0%) |
| 60 to 64 Years | 37 (17.4%) | 48 (49.5%) |
| 65 to 69 Years | 23 (10.8%) | 31 (32.0%) |
| 70 to 74 Years | 0 (0.0%) | 0 (0.0%) |
| 75 to 79 Years | 0 (0.0%) | 0 (0.0%) |
| 80 to 84 Years | 10 (4.7%) | 0 (0.0%) |
| 85 Years and over | 0 (0.0%) | 0 (0.0%) |
| Total | 213 (100.0%) | 97 (100.0%) |
Families and Households in Pine Valley
Median Family Size in Pine Valley
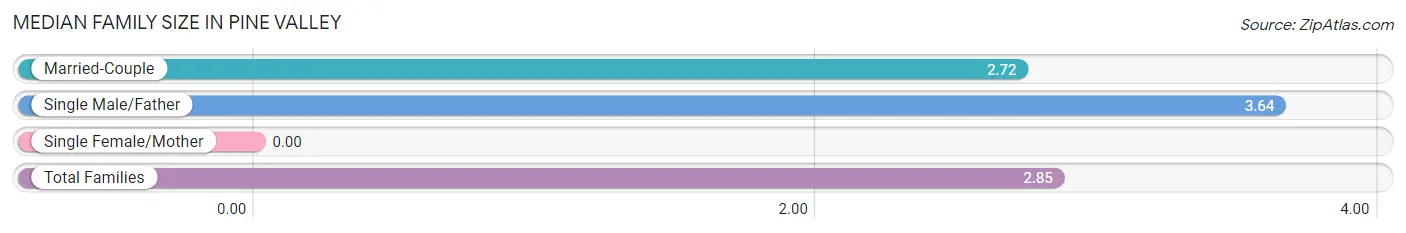
| Family Type | # Families | Family Size |
| Married-Couple | 85 (85.9%) | 2.72 |
| Single Male/Father | 14 (14.1%) | 3.64 |
| Single Female/Mother | 0 (0.0%) | - |
| Total Families | 99 (100.0%) | 2.85 |
Median Household Size in Pine Valley
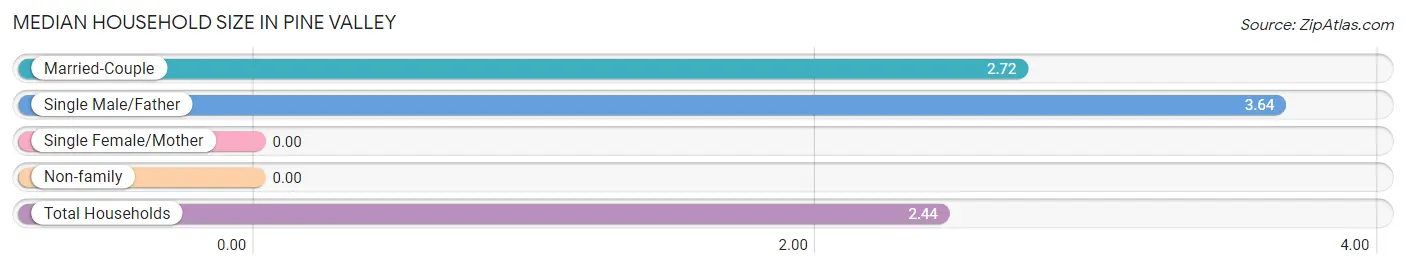
| Household Type | # Households | Household Size |
| Married-Couple | 85 (66.9%) | 2.72 |
| Single Male/Father | 14 (11.0%) | 3.64 |
| Single Female/Mother | 0 (0.0%) | - |
| Non-family | 28 (22.1%) | - |
| Total Households | 127 (100.0%) | 2.44 |
Household Size by Marriage Status in Pine Valley
Out of a total of 127 households in Pine Valley, 99 (77.9%) are family households, while 28 (22.1%) are nonfamily households. The most numerous type of family households are 2-person households, comprising 57, and the most common type of nonfamily households are 1-person households, comprising 28.
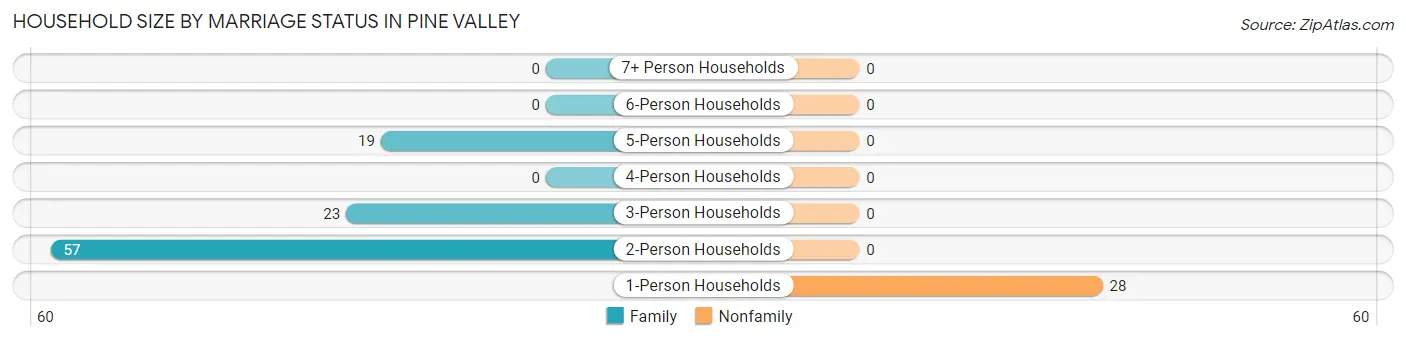
| Household Size | Family Households | Nonfamily Households |
| 1-Person Households | - | 28 (22.1%) |
| 2-Person Households | 57 (44.9%) | 0 (0.0%) |
| 3-Person Households | 23 (18.1%) | 0 (0.0%) |
| 4-Person Households | 0 (0.0%) | 0 (0.0%) |
| 5-Person Households | 19 (15.0%) | 0 (0.0%) |
| 6-Person Households | 0 (0.0%) | 0 (0.0%) |
| 7+ Person Households | 0 (0.0%) | 0 (0.0%) |
| Total | 99 (77.9%) | 28 (22.1%) |
Female Fertility in Pine Valley
Fertility by Age in Pine Valley
| Age Bracket | Women with Births | Births / 1,000 Women |
| 15 to 19 years | 0 (0.0%) | 0.0 |
| 20 to 34 years | 0 (0.0%) | 0.0 |
| 35 to 50 years | 0 (0.0%) | 0.0 |
| Total | 0 (0.0%) | 0.0 |
Fertility by Age by Marriage Status in Pine Valley
| Age Bracket | Married | Unmarried |
| 15 to 19 years | 0 (0.0%) | 0 (0.0%) |
| 20 to 34 years | 0 (0.0%) | 0 (0.0%) |
| 35 to 50 years | 0 (0.0%) | 0 (0.0%) |
| Total | 0 (0.0%) | 0 (0.0%) |
Fertility by Education in Pine Valley
| Educational Attainment | Women with Births | Births / 1,000 Women |
| Less than High School | 0 (0.0%) | 0.0 |
| High School Diploma | 0 (0.0%) | 0.0 |
| College or Associate's Degree | 0 (0.0%) | 0.0 |
| Bachelor's Degree | 0 (0.0%) | 0.0 |
| Graduate Degree | 0 (0.0%) | 0.0 |
| Total | 0 (0.0%) | 0.0 |
Fertility by Education by Marriage Status in Pine Valley
| Educational Attainment | Married | Unmarried |
| Less than High School | 0 (0.0%) | 0 (0.0%) |
| High School Diploma | 0 (0.0%) | 0 (0.0%) |
| College or Associate's Degree | 0 (0.0%) | 0 (0.0%) |
| Bachelor's Degree | 0 (0.0%) | 0 (0.0%) |
| Graduate Degree | 0 (0.0%) | 0 (0.0%) |
| Total | 0 (0.0%) | 0 (0.0%) |
Employment Characteristics in Pine Valley
Employment by Class of Employer in Pine Valley
Among the 133 employed individuals in Pine Valley, private company employees (78 | 58.7%), not-for-profit organizations (36 | 27.1%), and self-employed (incorporated) (19 | 14.3%) make up the most common classes of employment.
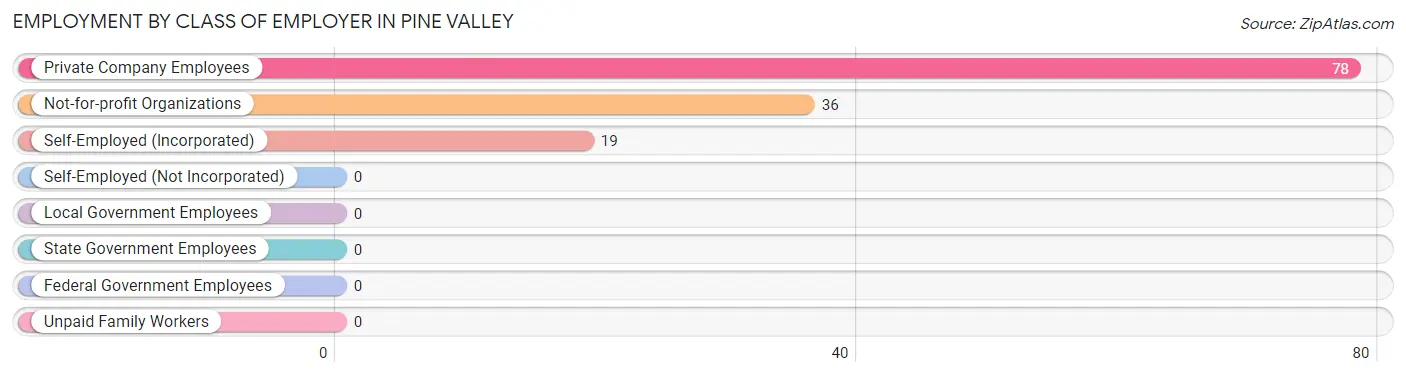
| Employer Class | # Employees | % Employees |
| Private Company Employees | 78 | 58.7% |
| Self-Employed (Incorporated) | 19 | 14.3% |
| Self-Employed (Not Incorporated) | 0 | 0.0% |
| Not-for-profit Organizations | 36 | 27.1% |
| Local Government Employees | 0 | 0.0% |
| State Government Employees | 0 | 0.0% |
| Federal Government Employees | 0 | 0.0% |
| Unpaid Family Workers | 0 | 0.0% |
| Total | 133 | 100.0% |
Employment Status by Age in Pine Valley
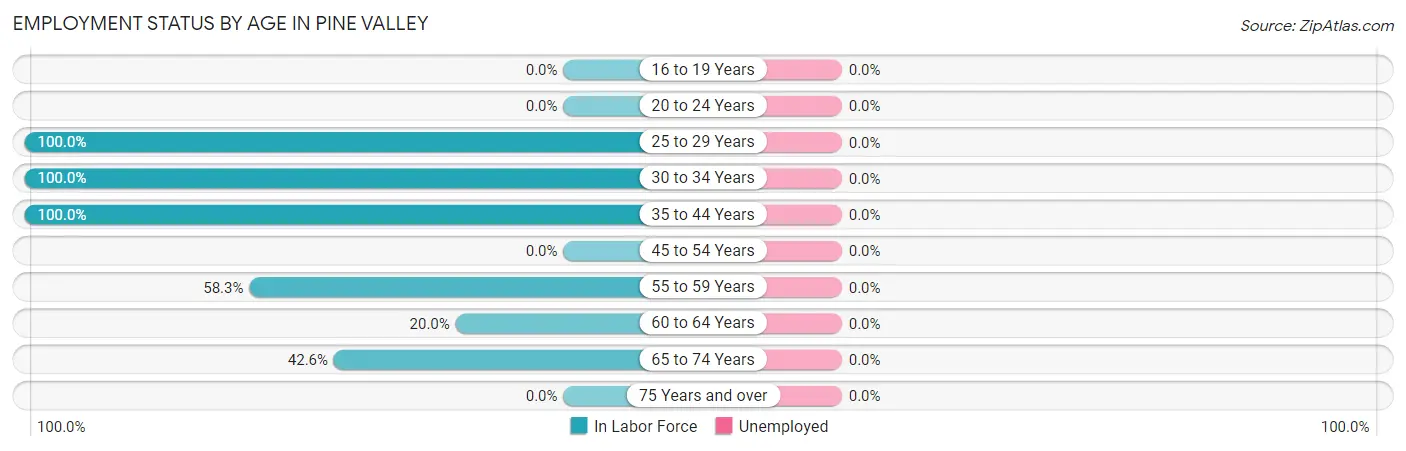
| Age Bracket | In Labor Force | Unemployed |
| 16 to 19 Years | 0 (0.0%) | 0 (0.0%) |
| 20 to 24 Years | 0 (0.0%) | 0 (0.0%) |
| 25 to 29 Years | 14 (100.0%) | 0 (0.0%) |
| 30 to 34 Years | 32 (100.0%) | 0 (0.0%) |
| 35 to 44 Years | 19 (100.0%) | 0 (0.0%) |
| 45 to 54 Years | 0 (0.0%) | 0 (0.0%) |
| 55 to 59 Years | 28 (58.3%) | 0 (0.0%) |
| 60 to 64 Years | 17 (20.0%) | 0 (0.0%) |
| 65 to 74 Years | 23 (42.6%) | 0 (0.0%) |
| 75 Years and over | 0 (0.0%) | 0 (0.0%) |
| Total | 133 (50.8%) | 0 (0.0%) |
Employment Status by Educational Attainment in Pine Valley
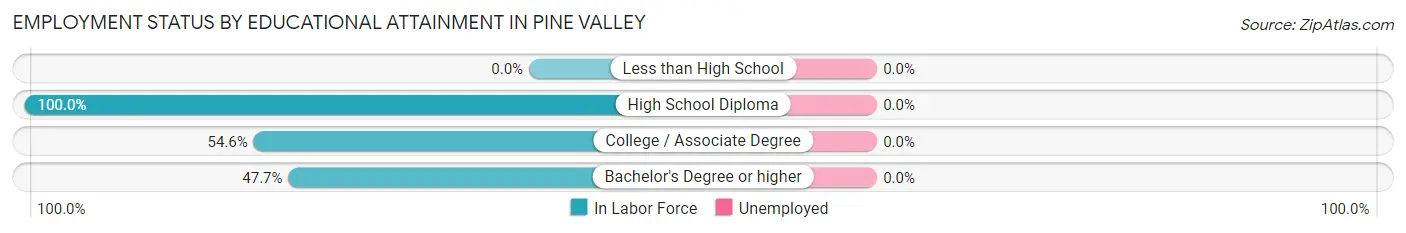
| Educational Attainment | In Labor Force | Unemployed |
| Less than High School | 0 (0.0%) | 0 (0.0%) |
| High School Diploma | 14 (100.0%) | 0 (0.0%) |
| College / Associate Degree | 65 (54.6%) | 0 (0.0%) |
| Bachelor's Degree or higher | 31 (47.7%) | 0 (0.0%) |
| Total | 110 (55.6%) | 0 (0.0%) |
Employment Occupations by Sex in Pine Valley
Management, Business, Science and Arts Occupations
The most common Management, Business, Science and Arts occupations in Pine Valley are Business & Financial (37 | 27.8%), Health Diagnosing & Treating (30 | 22.6%), Health Technologists (30 | 22.6%), Computers, Engineering & Science (18 | 13.5%), and Architecture & Engineering (18 | 13.5%).
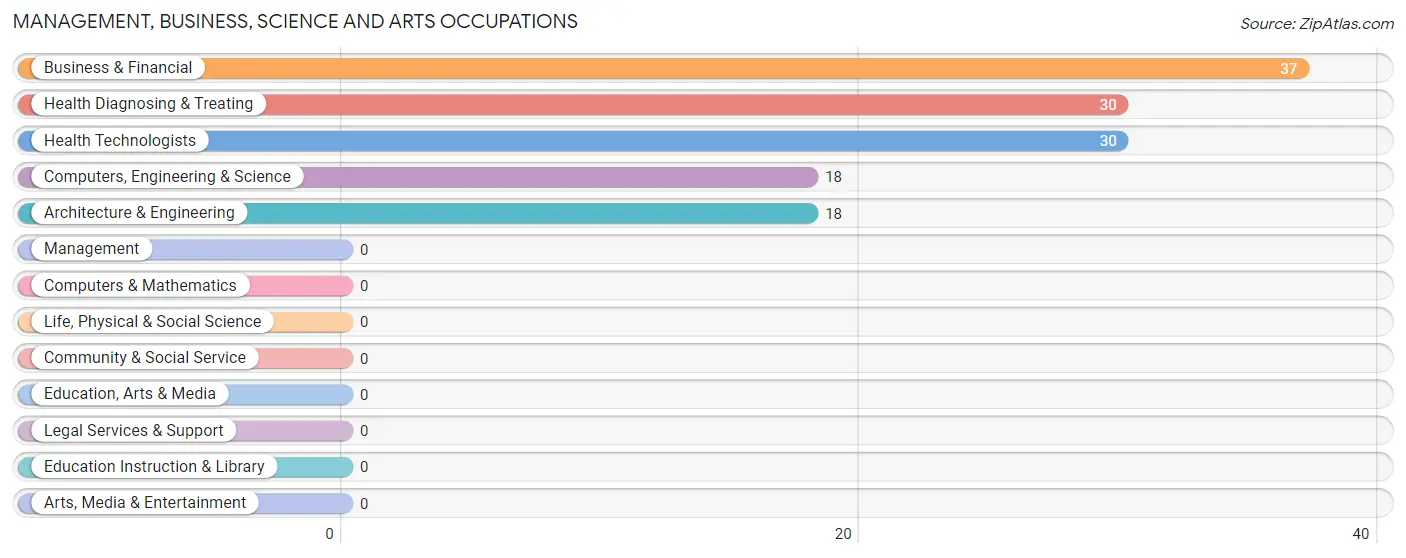
Management, Business, Science and Arts Occupations by Sex
Within the Management, Business, Science and Arts occupations in Pine Valley, the most male-oriented occupations are Business & Financial (100.0%), Health Diagnosing & Treating (100.0%), and Health Technologists (100.0%), while the most female-oriented occupations are Computers, Engineering & Science (100.0%), and Architecture & Engineering (100.0%).
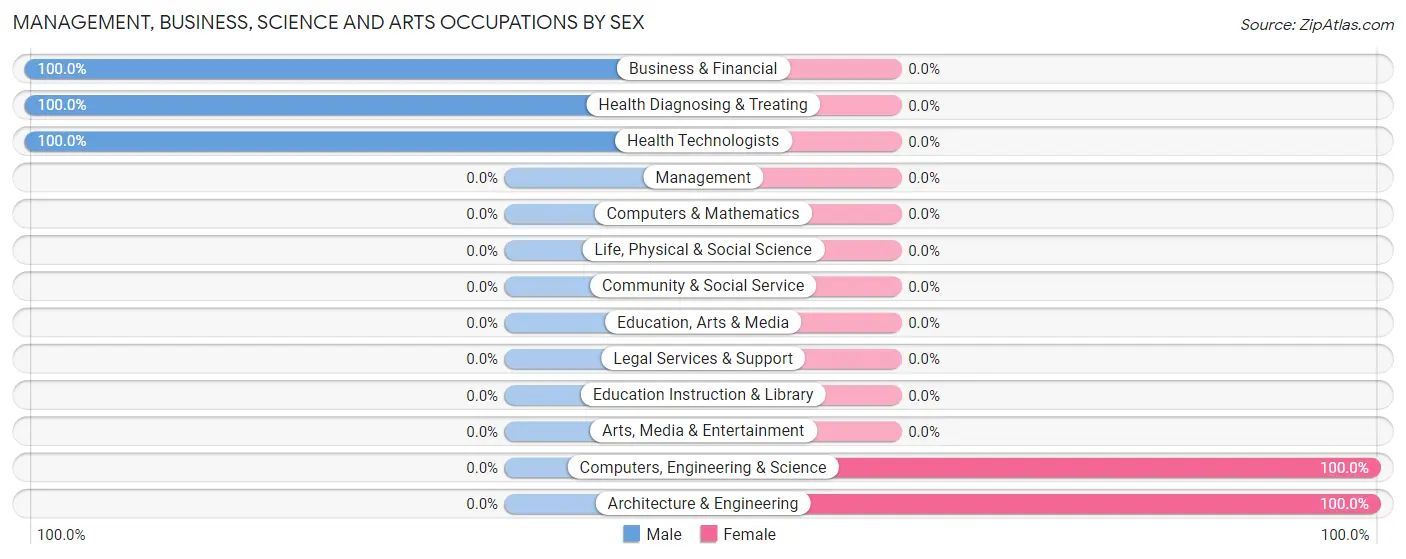
| Occupation | Male | Female |
| Management | 0 (0.0%) | 0 (0.0%) |
| Business & Financial | 37 (100.0%) | 0 (0.0%) |
| Computers, Engineering & Science | 0 (0.0%) | 18 (100.0%) |
| Computers & Mathematics | 0 (0.0%) | 0 (0.0%) |
| Architecture & Engineering | 0 (0.0%) | 18 (100.0%) |
| Life, Physical & Social Science | 0 (0.0%) | 0 (0.0%) |
| Community & Social Service | 0 (0.0%) | 0 (0.0%) |
| Education, Arts & Media | 0 (0.0%) | 0 (0.0%) |
| Legal Services & Support | 0 (0.0%) | 0 (0.0%) |
| Education Instruction & Library | 0 (0.0%) | 0 (0.0%) |
| Arts, Media & Entertainment | 0 (0.0%) | 0 (0.0%) |
| Health Diagnosing & Treating | 30 (100.0%) | 0 (0.0%) |
| Health Technologists | 30 (100.0%) | 0 (0.0%) |
| Total (Category) | 67 (78.8%) | 18 (21.2%) |
| Total (Overall) | 115 (86.5%) | 18 (13.5%) |
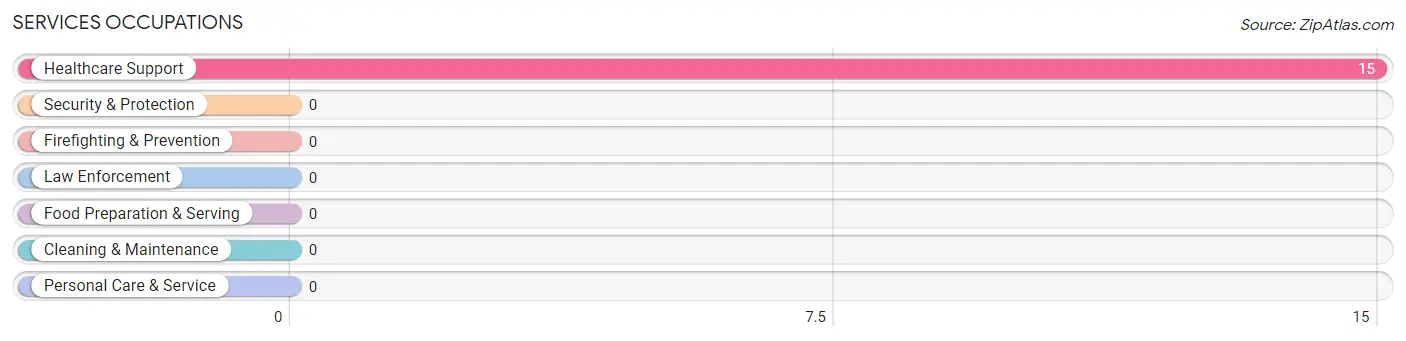
Services Occupations
The most common Services occupations in Pine Valley are , and Healthcare Support (15 | 11.3%).
Services Occupations by Sex
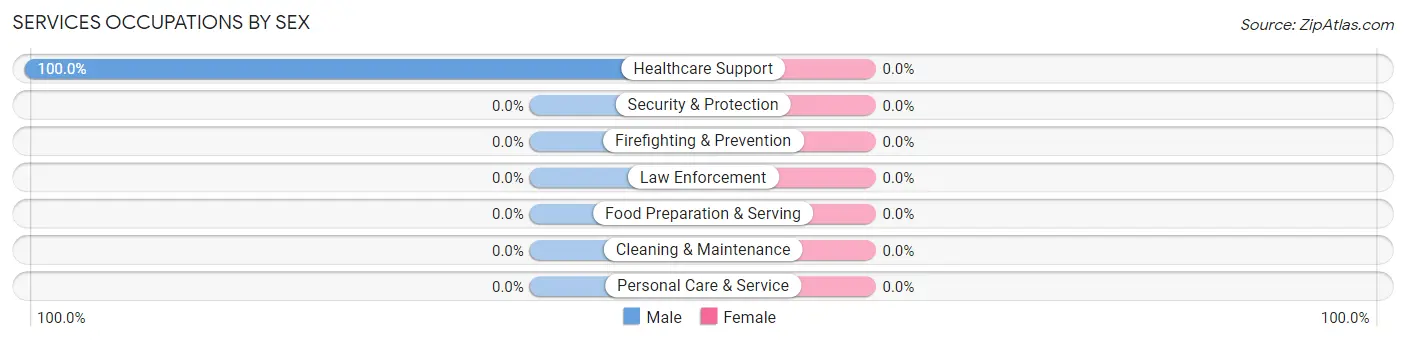
| Occupation | Male | Female |
| Healthcare Support | 15 (100.0%) | 0 (0.0%) |
| Security & Protection | 0 (0.0%) | 0 (0.0%) |
| Firefighting & Prevention | 0 (0.0%) | 0 (0.0%) |
| Law Enforcement | 0 (0.0%) | 0 (0.0%) |
| Food Preparation & Serving | 0 (0.0%) | 0 (0.0%) |
| Cleaning & Maintenance | 0 (0.0%) | 0 (0.0%) |
| Personal Care & Service | 0 (0.0%) | 0 (0.0%) |
| Total (Category) | 15 (100.0%) | 0 (0.0%) |
| Total (Overall) | 115 (86.5%) | 18 (13.5%) |
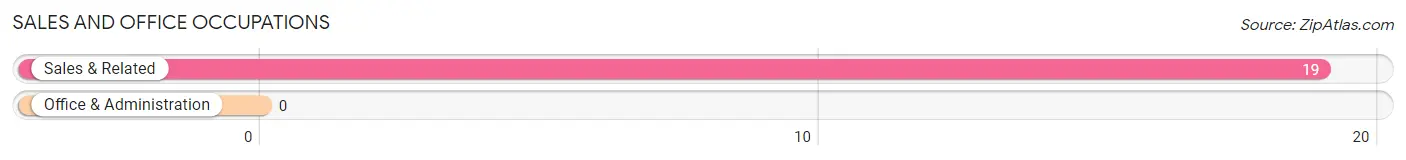
Sales and Office Occupations
The most common Sales and Office occupations in Pine Valley are , and Sales & Related (19 | 14.3%).
Sales and Office Occupations by Sex

| Occupation | Male | Female |
| Sales & Related | 19 (100.0%) | 0 (0.0%) |
| Office & Administration | 0 (0.0%) | 0 (0.0%) |
| Total (Category) | 19 (100.0%) | 0 (0.0%) |
| Total (Overall) | 115 (86.5%) | 18 (13.5%) |
Natural Resources, Construction and Maintenance Occupations
The most common Natural Resources, Construction and Maintenance occupations in Pine Valley are , and Construction & Extraction (14 | 10.5%).
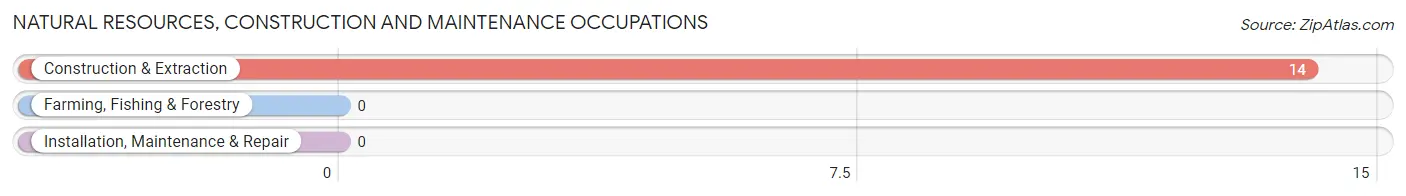
Natural Resources, Construction and Maintenance Occupations by Sex

| Occupation | Male | Female |
| Farming, Fishing & Forestry | 0 (0.0%) | 0 (0.0%) |
| Construction & Extraction | 14 (100.0%) | 0 (0.0%) |
| Installation, Maintenance & Repair | 0 (0.0%) | 0 (0.0%) |
| Total (Category) | 14 (100.0%) | 0 (0.0%) |
| Total (Overall) | 115 (86.5%) | 18 (13.5%) |
Production, Transportation and Moving Occupations
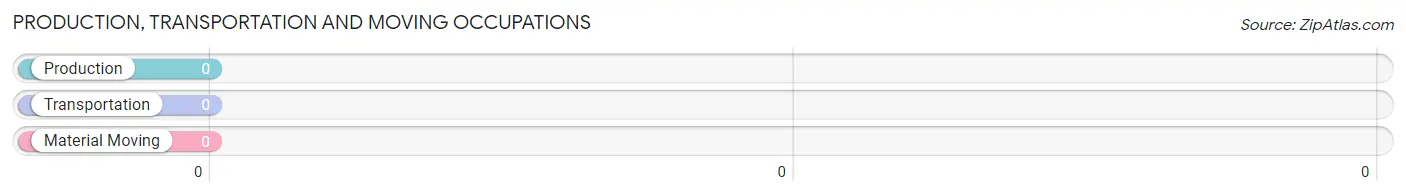
Production, Transportation and Moving Occupations by Sex
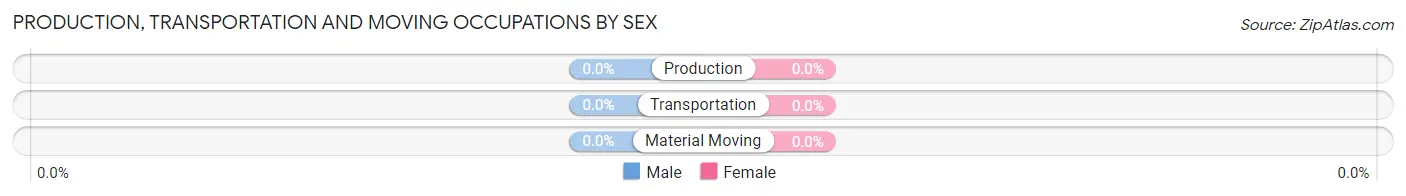
| Occupation | Male | Female |
| Production | 0 (0.0%) | 0 (0.0%) |
| Transportation | 0 (0.0%) | 0 (0.0%) |
| Material Moving | 0 (0.0%) | 0 (0.0%) |
| Total (Category) | 0 (0.0%) | 0 (0.0%) |
| Total (Overall) | 115 (86.5%) | 18 (13.5%) |
Employment Industries by Sex in Pine Valley
Employment Industries in Pine Valley
The major employment industries in Pine Valley include Health Care & Social Assistance (30 | 22.6%), Finance & Insurance (23 | 17.3%), Real Estate, Rental & Leasing (19 | 14.3%), Manufacturing (18 | 13.5%), and Arts, Entertainment & Recreation (15 | 11.3%).
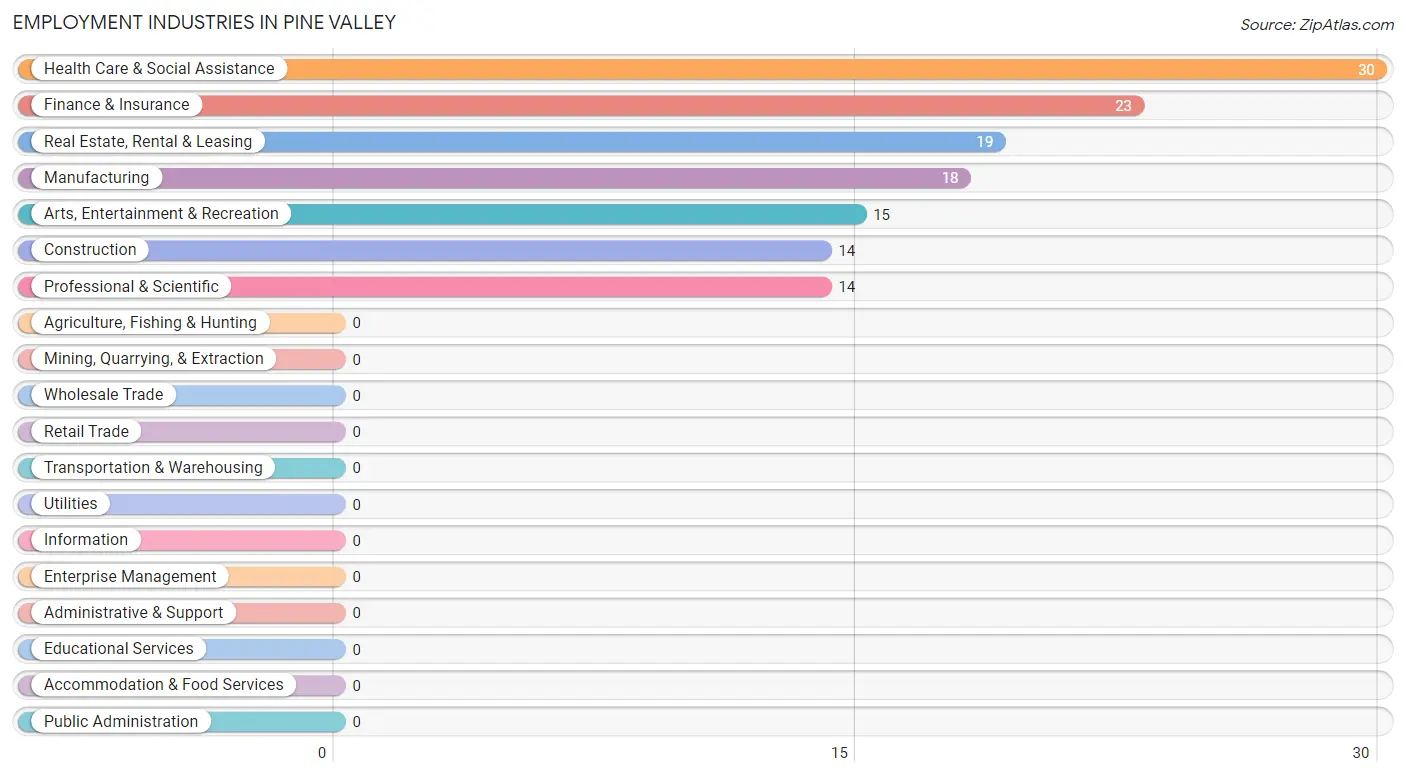
Employment Industries by Sex in Pine Valley
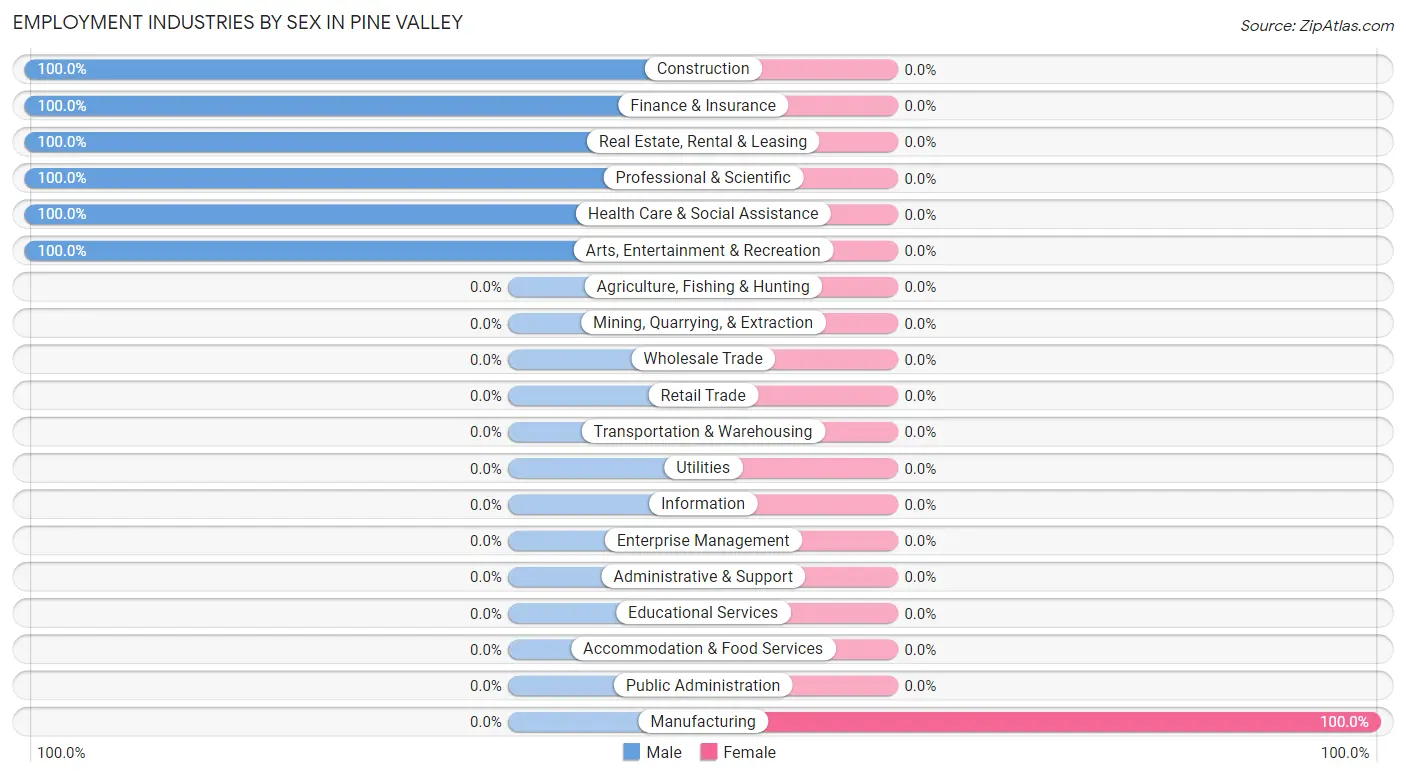
| Industry | Male | Female |
| Agriculture, Fishing & Hunting | 0 (0.0%) | 0 (0.0%) |
| Mining, Quarrying, & Extraction | 0 (0.0%) | 0 (0.0%) |
| Construction | 14 (100.0%) | 0 (0.0%) |
| Manufacturing | 0 (0.0%) | 18 (100.0%) |
| Wholesale Trade | 0 (0.0%) | 0 (0.0%) |
| Retail Trade | 0 (0.0%) | 0 (0.0%) |
| Transportation & Warehousing | 0 (0.0%) | 0 (0.0%) |
| Utilities | 0 (0.0%) | 0 (0.0%) |
| Information | 0 (0.0%) | 0 (0.0%) |
| Finance & Insurance | 23 (100.0%) | 0 (0.0%) |
| Real Estate, Rental & Leasing | 19 (100.0%) | 0 (0.0%) |
| Professional & Scientific | 14 (100.0%) | 0 (0.0%) |
| Enterprise Management | 0 (0.0%) | 0 (0.0%) |
| Administrative & Support | 0 (0.0%) | 0 (0.0%) |
| Educational Services | 0 (0.0%) | 0 (0.0%) |
| Health Care & Social Assistance | 30 (100.0%) | 0 (0.0%) |
| Arts, Entertainment & Recreation | 15 (100.0%) | 0 (0.0%) |
| Accommodation & Food Services | 0 (0.0%) | 0 (0.0%) |
| Public Administration | 0 (0.0%) | 0 (0.0%) |
| Total | 115 (86.5%) | 18 (13.5%) |
Education in Pine Valley
School Enrollment in Pine Valley
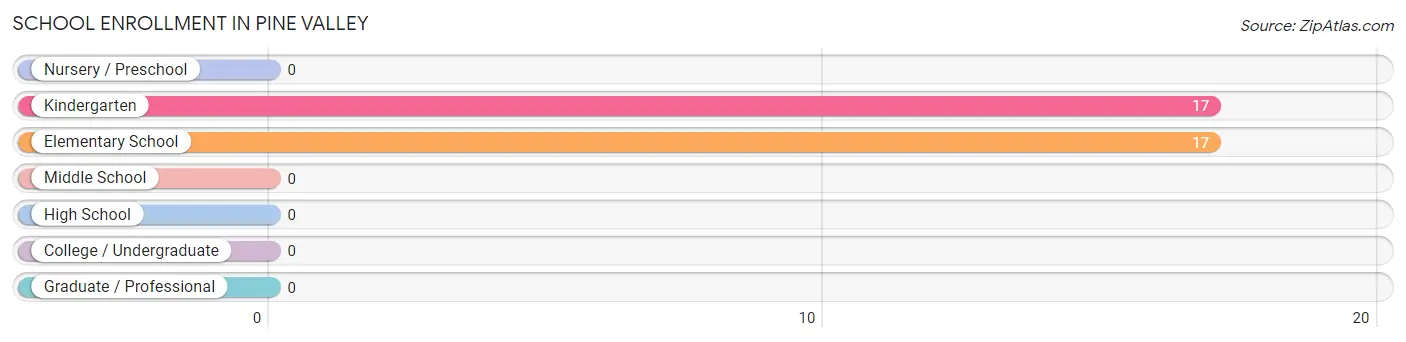
The most common levels of schooling among the 34 students in Pine Valley are kindergarten (17 | 50.0%), and elementary school (17 | 50.0%).
| School Level | # Students | % Students |
| Nursery / Preschool | 0 | 0.0% |
| Kindergarten | 17 | 50.0% |
| Elementary School | 17 | 50.0% |
| Middle School | 0 | 0.0% |
| High School | 0 | 0.0% |
| College / Undergraduate | 0 | 0.0% |
| Graduate / Professional | 0 | 0.0% |
| Total | 34 | 100.0% |
School Enrollment by Age by Funding Source in Pine Valley
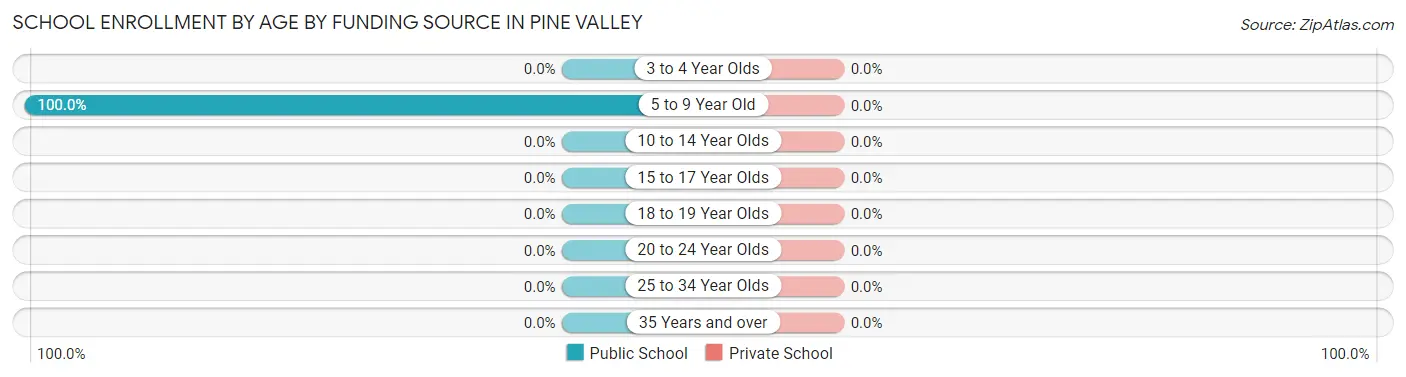
| Age Bracket | Public School | Private School |
| 3 to 4 Year Olds | 0 (0.0%) | 0 (0.0%) |
| 5 to 9 Year Old | 34 (100.0%) | 0 (0.0%) |
| 10 to 14 Year Olds | 0 (0.0%) | 0 (0.0%) |
| 15 to 17 Year Olds | 0 (0.0%) | 0 (0.0%) |
| 18 to 19 Year Olds | 0 (0.0%) | 0 (0.0%) |
| 20 to 24 Year Olds | 0 (0.0%) | 0 (0.0%) |
| 25 to 34 Year Olds | 0 (0.0%) | 0 (0.0%) |
| 35 Years and over | 0 (0.0%) | 0 (0.0%) |
| Total | 34 (100.0%) | 0 (0.0%) |
Educational Attainment by Field of Study in Pine Valley
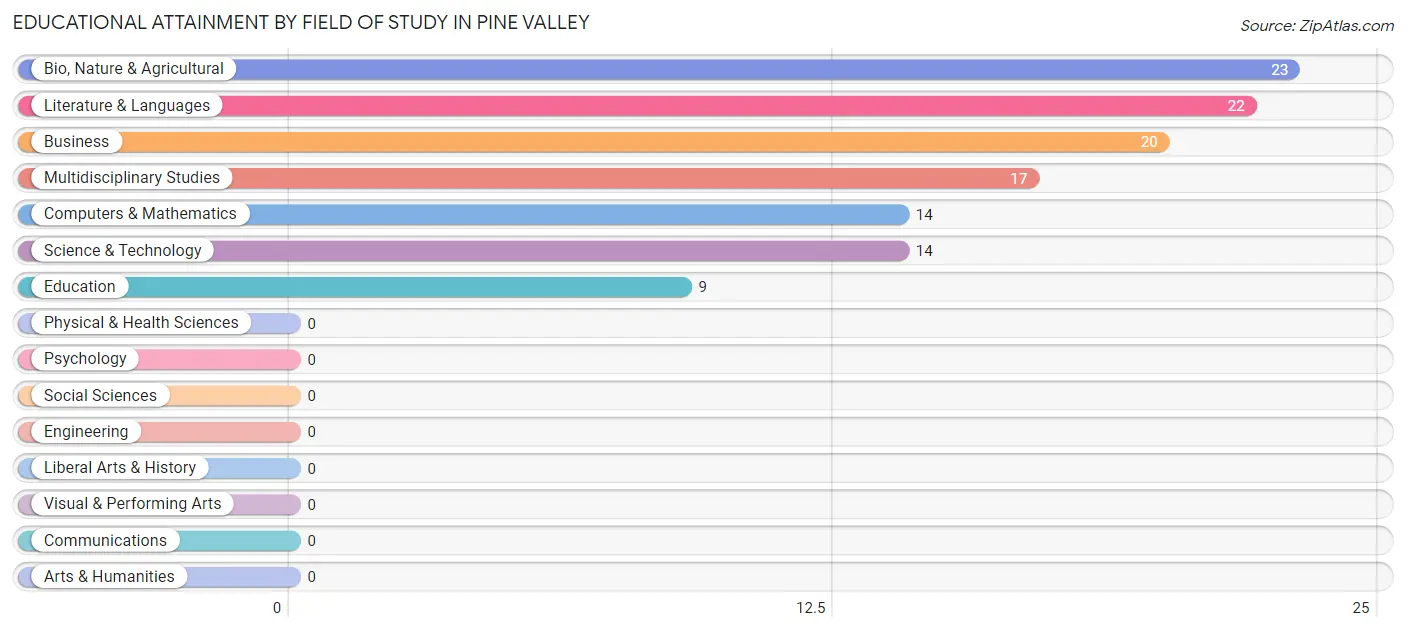
Bio, nature & agricultural (23 | 19.3%), literature & languages (22 | 18.5%), business (20 | 16.8%), multidisciplinary studies (17 | 14.3%), and computers & mathematics (14 | 11.8%) are the most common fields of study among 119 individuals in Pine Valley who have obtained a bachelor's degree or higher.
| Field of Study | # Graduates | % Graduates |
| Computers & Mathematics | 14 | 11.8% |
| Bio, Nature & Agricultural | 23 | 19.3% |
| Physical & Health Sciences | 0 | 0.0% |
| Psychology | 0 | 0.0% |
| Social Sciences | 0 | 0.0% |
| Engineering | 0 | 0.0% |
| Multidisciplinary Studies | 17 | 14.3% |
| Science & Technology | 14 | 11.8% |
| Business | 20 | 16.8% |
| Education | 9 | 7.6% |
| Literature & Languages | 22 | 18.5% |
| Liberal Arts & History | 0 | 0.0% |
| Visual & Performing Arts | 0 | 0.0% |
| Communications | 0 | 0.0% |
| Arts & Humanities | 0 | 0.0% |
| Total | 119 | 100.0% |
Transportation & Commute in Pine Valley
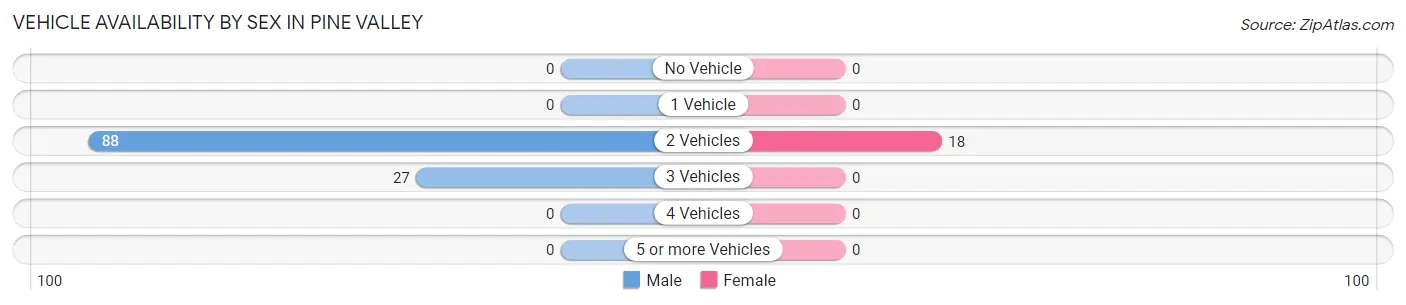
Vehicle Availability by Sex in Pine Valley
The most prevalent vehicle ownership categories in Pine Valley are males with 2 vehicles (88, accounting for 76.5%) and females with 2 vehicles (18, making up 488.9%).
| Vehicles Available | Male | Female |
| No Vehicle | 0 (0.0%) | 0 (0.0%) |
| 1 Vehicle | 0 (0.0%) | 0 (0.0%) |
| 2 Vehicles | 88 (76.5%) | 18 (100.0%) |
| 3 Vehicles | 27 (23.5%) | 0 (0.0%) |
| 4 Vehicles | 0 (0.0%) | 0 (0.0%) |
| 5 or more Vehicles | 0 (0.0%) | 0 (0.0%) |
| Total | 115 (100.0%) | 18 (100.0%) |
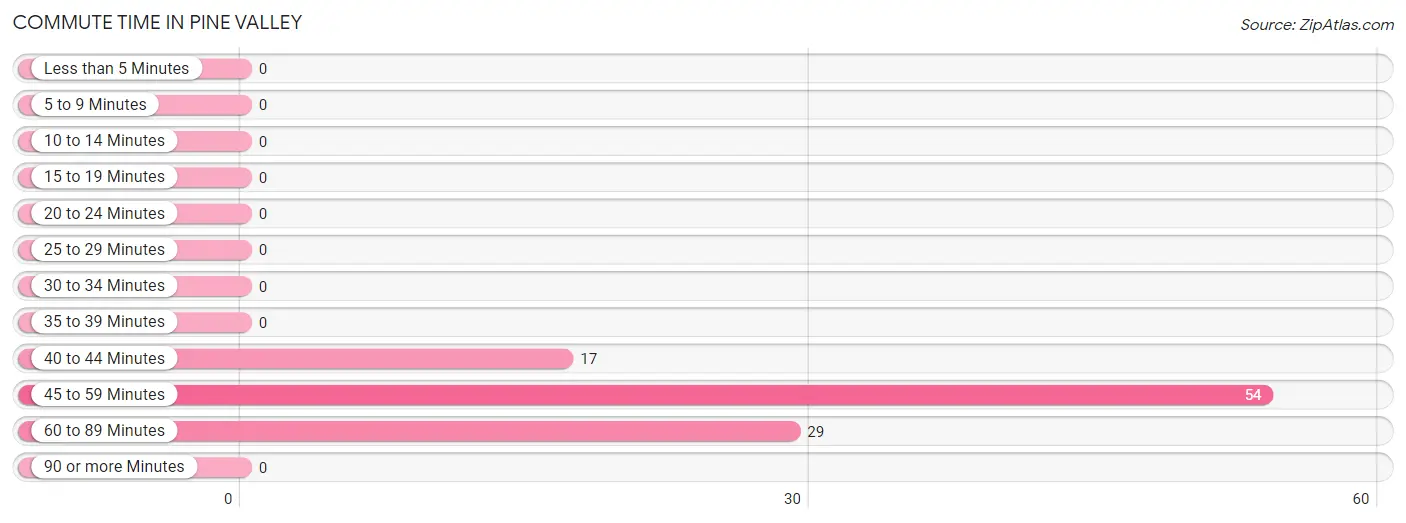
Commute Time in Pine Valley
The most frequently occuring commute durations in Pine Valley are 45 to 59 minutes (54 commuters, 54.0%), 60 to 89 minutes (29 commuters, 29.0%), and 40 to 44 minutes (17 commuters, 17.0%).
| Commute Time | # Commuters | % Commuters |
| Less than 5 Minutes | 0 | 0.0% |
| 5 to 9 Minutes | 0 | 0.0% |
| 10 to 14 Minutes | 0 | 0.0% |
| 15 to 19 Minutes | 0 | 0.0% |
| 20 to 24 Minutes | 0 | 0.0% |
| 25 to 29 Minutes | 0 | 0.0% |
| 30 to 34 Minutes | 0 | 0.0% |
| 35 to 39 Minutes | 0 | 0.0% |
| 40 to 44 Minutes | 17 | 17.0% |
| 45 to 59 Minutes | 54 | 54.0% |
| 60 to 89 Minutes | 29 | 29.0% |
| 90 or more Minutes | 0 | 0.0% |
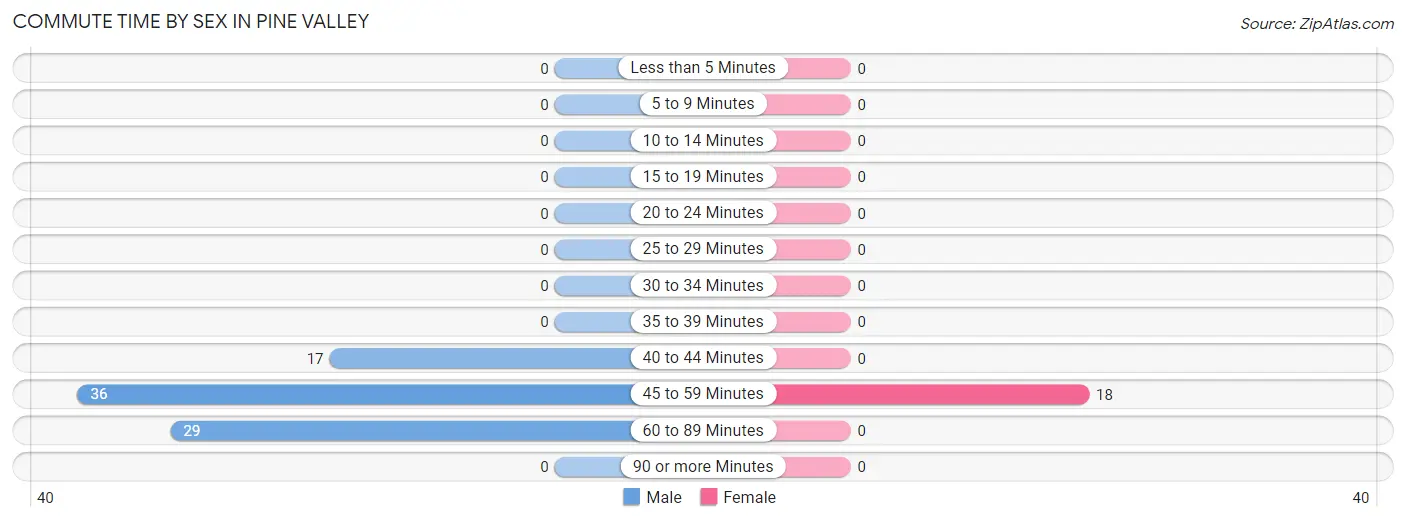
Commute Time by Sex in Pine Valley
The most common commute times in Pine Valley are 45 to 59 minutes (36 commuters, 43.9%) for males and 45 to 59 minutes (18 commuters, 100.0%) for females.
| Commute Time | Male | Female |
| Less than 5 Minutes | 0 (0.0%) | 0 (0.0%) |
| 5 to 9 Minutes | 0 (0.0%) | 0 (0.0%) |
| 10 to 14 Minutes | 0 (0.0%) | 0 (0.0%) |
| 15 to 19 Minutes | 0 (0.0%) | 0 (0.0%) |
| 20 to 24 Minutes | 0 (0.0%) | 0 (0.0%) |
| 25 to 29 Minutes | 0 (0.0%) | 0 (0.0%) |
| 30 to 34 Minutes | 0 (0.0%) | 0 (0.0%) |
| 35 to 39 Minutes | 0 (0.0%) | 0 (0.0%) |
| 40 to 44 Minutes | 17 (20.7%) | 0 (0.0%) |
| 45 to 59 Minutes | 36 (43.9%) | 18 (100.0%) |
| 60 to 89 Minutes | 29 (35.4%) | 0 (0.0%) |
| 90 or more Minutes | 0 (0.0%) | 0 (0.0%) |
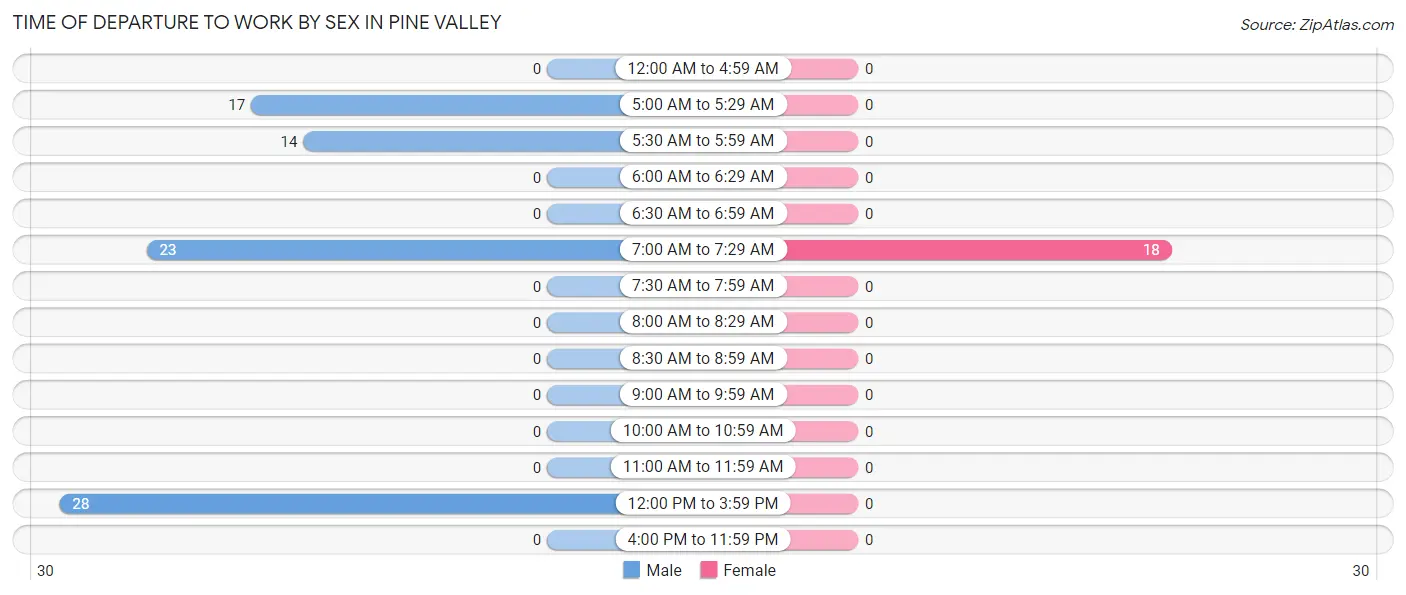
Time of Departure to Work by Sex in Pine Valley
The most frequent times of departure to work in Pine Valley are 12:00 PM to 3:59 PM (28, 34.2%) for males and 7:00 AM to 7:29 AM (18, 100.0%) for females.
| Time of Departure | Male | Female |
| 12:00 AM to 4:59 AM | 0 (0.0%) | 0 (0.0%) |
| 5:00 AM to 5:29 AM | 17 (20.7%) | 0 (0.0%) |
| 5:30 AM to 5:59 AM | 14 (17.1%) | 0 (0.0%) |
| 6:00 AM to 6:29 AM | 0 (0.0%) | 0 (0.0%) |
| 6:30 AM to 6:59 AM | 0 (0.0%) | 0 (0.0%) |
| 7:00 AM to 7:29 AM | 23 (28.1%) | 18 (100.0%) |
| 7:30 AM to 7:59 AM | 0 (0.0%) | 0 (0.0%) |
| 8:00 AM to 8:29 AM | 0 (0.0%) | 0 (0.0%) |
| 8:30 AM to 8:59 AM | 0 (0.0%) | 0 (0.0%) |
| 9:00 AM to 9:59 AM | 0 (0.0%) | 0 (0.0%) |
| 10:00 AM to 10:59 AM | 0 (0.0%) | 0 (0.0%) |
| 11:00 AM to 11:59 AM | 0 (0.0%) | 0 (0.0%) |
| 12:00 PM to 3:59 PM | 28 (34.2%) | 0 (0.0%) |
| 4:00 PM to 11:59 PM | 0 (0.0%) | 0 (0.0%) |
| Total | 82 (100.0%) | 18 (100.0%) |
Housing Occupancy in Pine Valley
Occupancy by Ownership in Pine Valley
Of the total 127 dwellings in Pine Valley, owner-occupied units account for 127 (100.0%), while renter-occupied units make up 0 (0.0%).
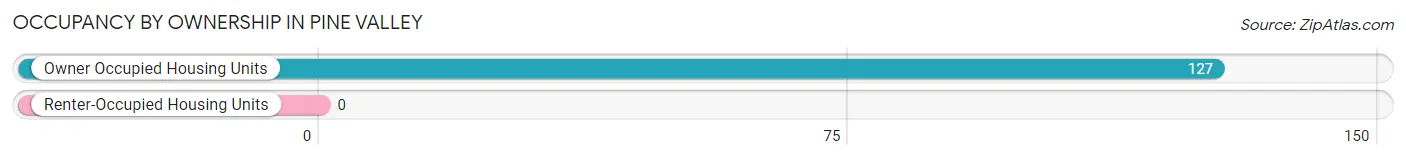
| Occupancy | # Housing Units | % Housing Units |
| Owner Occupied Housing Units | 127 | 100.0% |
| Renter-Occupied Housing Units | 0 | 0.0% |
| Total Occupied Housing Units | 127 | 100.0% |
Occupancy by Household Size in Pine Valley
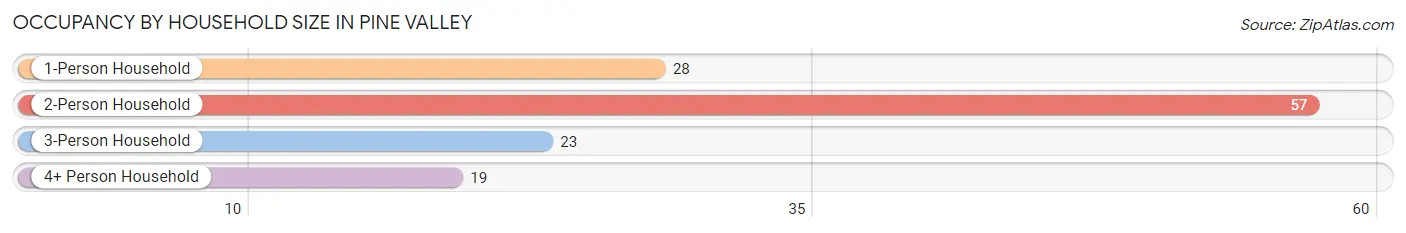
| Household Size | # Housing Units | % Housing Units |
| 1-Person Household | 28 | 22.1% |
| 2-Person Household | 57 | 44.9% |
| 3-Person Household | 23 | 18.1% |
| 4+ Person Household | 19 | 15.0% |
| Total Housing Units | 127 | 100.0% |
Occupancy by Ownership by Household Size in Pine Valley
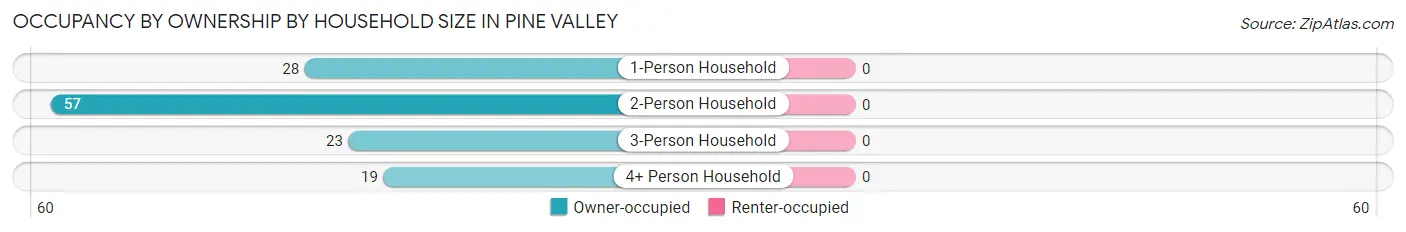
| Household Size | Owner-occupied | Renter-occupied |
| 1-Person Household | 28 (100.0%) | 0 (0.0%) |
| 2-Person Household | 57 (100.0%) | 0 (0.0%) |
| 3-Person Household | 23 (100.0%) | 0 (0.0%) |
| 4+ Person Household | 19 (100.0%) | 0 (0.0%) |
| Total Housing Units | 127 (100.0%) | 0 (0.0%) |
Occupancy by Educational Attainment in Pine Valley
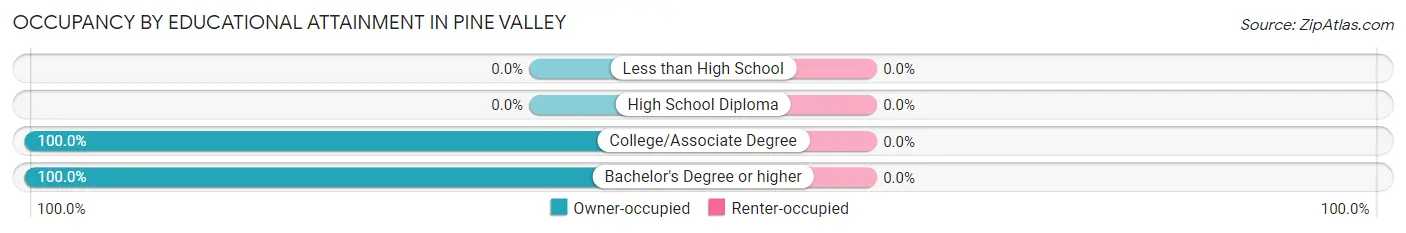
| Household Size | Owner-occupied | Renter-occupied |
| Less than High School | 0 (0.0%) | 0 (0.0%) |
| High School Diploma | 0 (0.0%) | 0 (0.0%) |
| College/Associate Degree | 67 (100.0%) | 0 (0.0%) |
| Bachelor's Degree or higher | 60 (100.0%) | 0 (0.0%) |
Occupancy by Age of Householder in Pine Valley
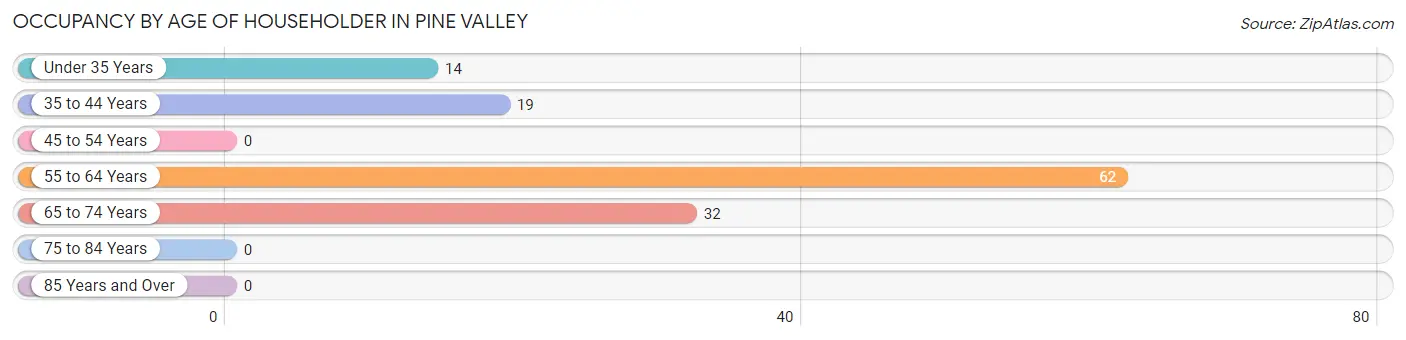
| Age Bracket | # Households | % Households |
| Under 35 Years | 14 | 11.0% |
| 35 to 44 Years | 19 | 15.0% |
| 45 to 54 Years | 0 | 0.0% |
| 55 to 64 Years | 62 | 48.8% |
| 65 to 74 Years | 32 | 25.2% |
| 75 to 84 Years | 0 | 0.0% |
| 85 Years and Over | 0 | 0.0% |
| Total | 127 | 100.0% |
Housing Finances in Pine Valley
Median Income by Occupancy in Pine Valley
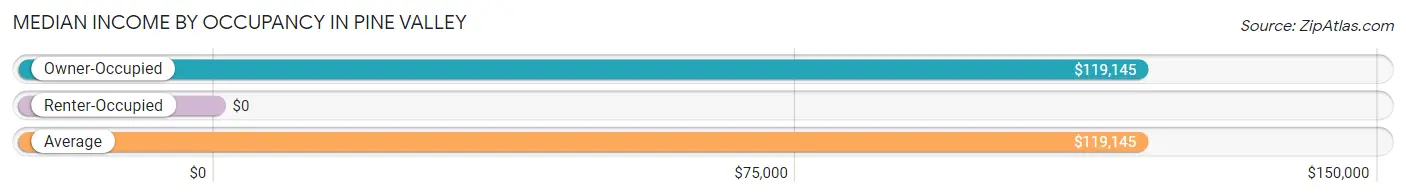
| Occupancy Type | # Households | Median Income |
| Owner-Occupied | 127 (100.0%) | $119,145 |
| Renter-Occupied | 0 (0.0%) | $0 |
| Average | 127 (100.0%) | $119,145 |
Occupancy by Householder Income Bracket in Pine Valley
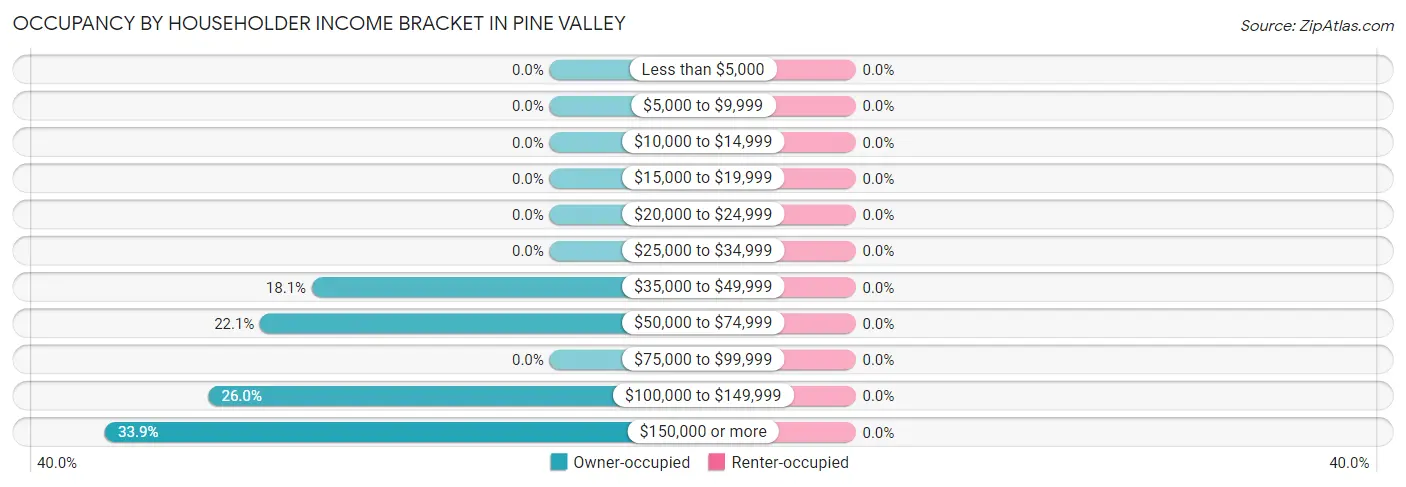
| Income Bracket | Owner-occupied | Renter-occupied |
| Less than $5,000 | 0 (0.0%) | 0 (0.0%) |
| $5,000 to $9,999 | 0 (0.0%) | 0 (0.0%) |
| $10,000 to $14,999 | 0 (0.0%) | 0 (0.0%) |
| $15,000 to $19,999 | 0 (0.0%) | 0 (0.0%) |
| $20,000 to $24,999 | 0 (0.0%) | 0 (0.0%) |
| $25,000 to $34,999 | 0 (0.0%) | 0 (0.0%) |
| $35,000 to $49,999 | 23 (18.1%) | 0 (0.0%) |
| $50,000 to $74,999 | 28 (22.1%) | 0 (0.0%) |
| $75,000 to $99,999 | 0 (0.0%) | 0 (0.0%) |
| $100,000 to $149,999 | 33 (26.0%) | 0 (0.0%) |
| $150,000 or more | 43 (33.9%) | 0 (0.0%) |
| Total | 127 (100.0%) | 0 (0.0%) |
Monthly Housing Cost Tiers in Pine Valley
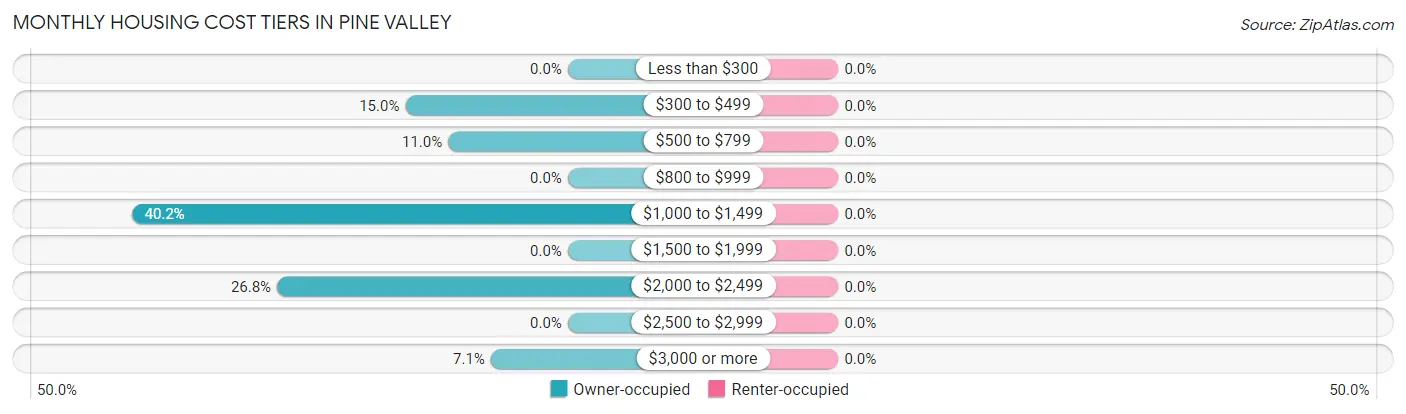
| Monthly Cost | Owner-occupied | Renter-occupied |
| Less than $300 | 0 (0.0%) | 0 (0.0%) |
| $300 to $499 | 19 (15.0%) | 0 (0.0%) |
| $500 to $799 | 14 (11.0%) | 0 (0.0%) |
| $800 to $999 | 0 (0.0%) | 0 (0.0%) |
| $1,000 to $1,499 | 51 (40.2%) | 0 (0.0%) |
| $1,500 to $1,999 | 0 (0.0%) | 0 (0.0%) |
| $2,000 to $2,499 | 34 (26.8%) | 0 (0.0%) |
| $2,500 to $2,999 | 0 (0.0%) | 0 (0.0%) |
| $3,000 or more | 9 (7.1%) | 0 (0.0%) |
| Total | 127 (100.0%) | 0 (0.0%) |
Physical Housing Characteristics in Pine Valley
Housing Structures in Pine Valley
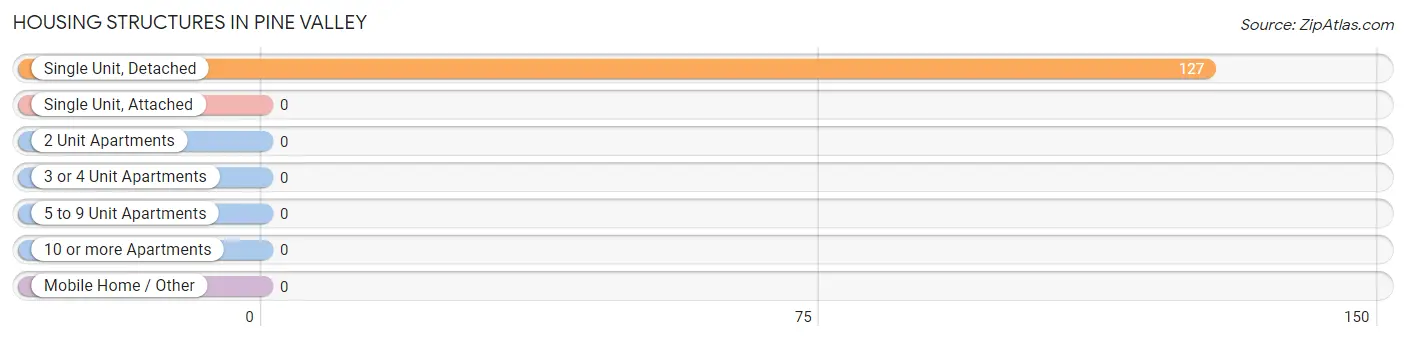
| Structure Type | # Housing Units | % Housing Units |
| Single Unit, Detached | 127 | 100.0% |
| Single Unit, Attached | 0 | 0.0% |
| 2 Unit Apartments | 0 | 0.0% |
| 3 or 4 Unit Apartments | 0 | 0.0% |
| 5 to 9 Unit Apartments | 0 | 0.0% |
| 10 or more Apartments | 0 | 0.0% |
| Mobile Home / Other | 0 | 0.0% |
| Total | 127 | 100.0% |
Housing Structures by Occupancy in Pine Valley
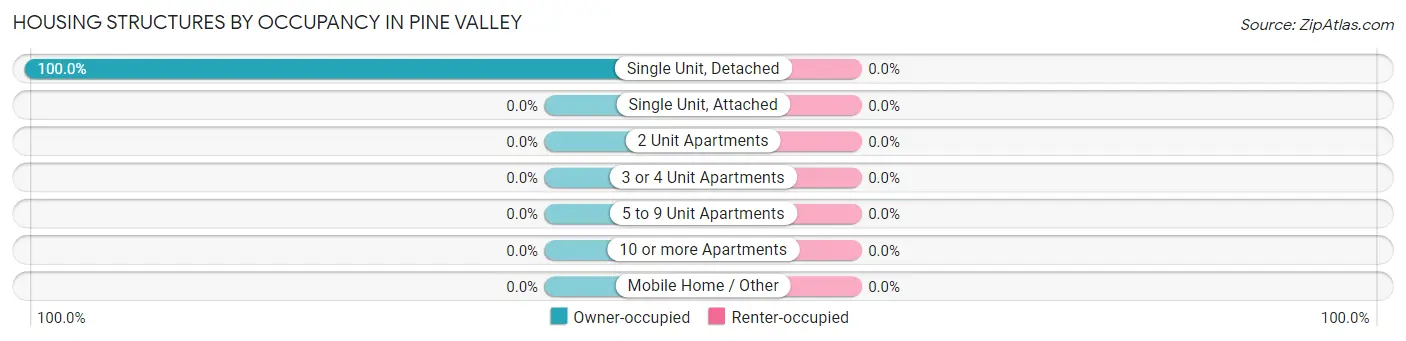
| Structure Type | Owner-occupied | Renter-occupied |
| Single Unit, Detached | 127 (100.0%) | 0 (0.0%) |
| Single Unit, Attached | 0 (0.0%) | 0 (0.0%) |
| 2 Unit Apartments | 0 (0.0%) | 0 (0.0%) |
| 3 or 4 Unit Apartments | 0 (0.0%) | 0 (0.0%) |
| 5 to 9 Unit Apartments | 0 (0.0%) | 0 (0.0%) |
| 10 or more Apartments | 0 (0.0%) | 0 (0.0%) |
| Mobile Home / Other | 0 (0.0%) | 0 (0.0%) |
| Total | 127 (100.0%) | 0 (0.0%) |
Housing Structures by Number of Rooms in Pine Valley
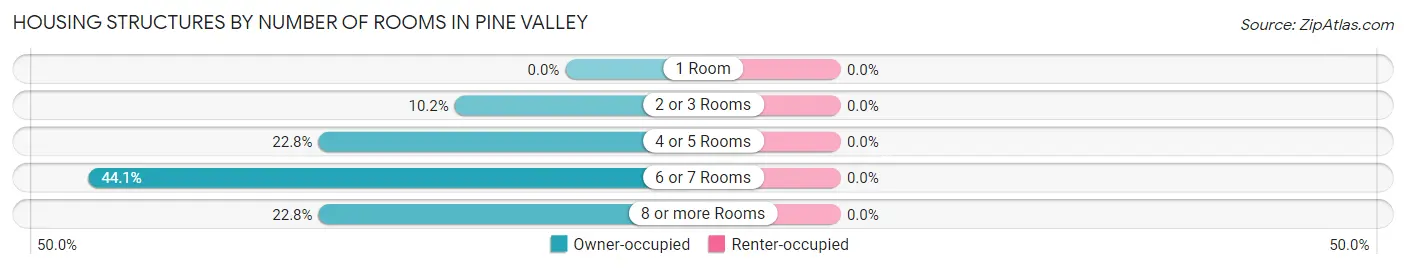
| Number of Rooms | Owner-occupied | Renter-occupied |
| 1 Room | 0 (0.0%) | 0 (0.0%) |
| 2 or 3 Rooms | 13 (10.2%) | 0 (0.0%) |
| 4 or 5 Rooms | 29 (22.8%) | 0 (0.0%) |
| 6 or 7 Rooms | 56 (44.1%) | 0 (0.0%) |
| 8 or more Rooms | 29 (22.8%) | 0 (0.0%) |
| Total | 127 (100.0%) | 0 (0.0%) |
Housing Structure by Heating Type in Pine Valley
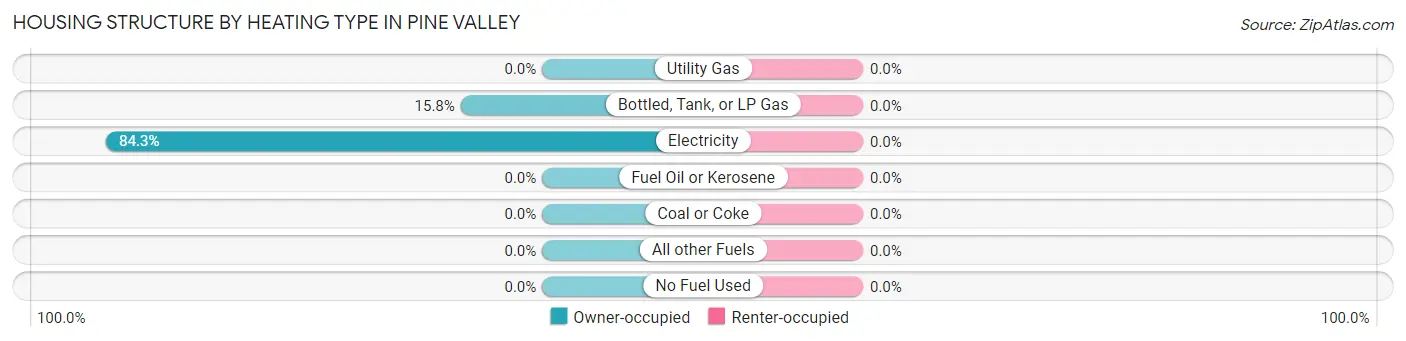
| Heating Type | Owner-occupied | Renter-occupied |
| Utility Gas | 0 (0.0%) | 0 (0.0%) |
| Bottled, Tank, or LP Gas | 20 (15.8%) | 0 (0.0%) |
| Electricity | 107 (84.3%) | 0 (0.0%) |
| Fuel Oil or Kerosene | 0 (0.0%) | 0 (0.0%) |
| Coal or Coke | 0 (0.0%) | 0 (0.0%) |
| All other Fuels | 0 (0.0%) | 0 (0.0%) |
| No Fuel Used | 0 (0.0%) | 0 (0.0%) |
| Total | 127 (100.0%) | 0 (0.0%) |
Household Vehicle Usage in Pine Valley
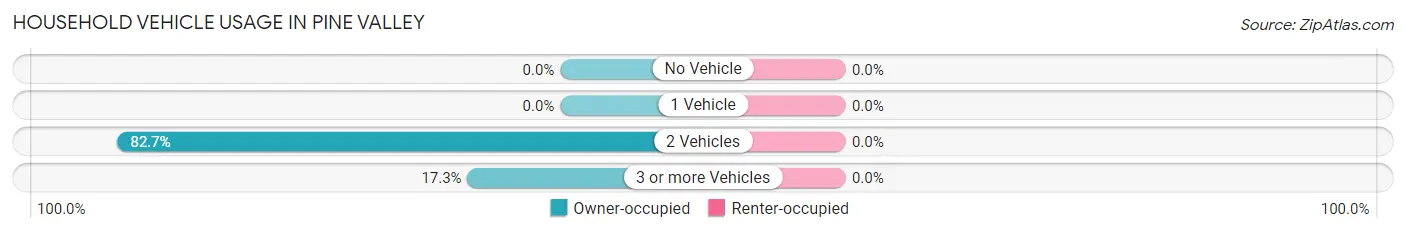
| Vehicles per Household | Owner-occupied | Renter-occupied |
| No Vehicle | 0 (0.0%) | 0 (0.0%) |
| 1 Vehicle | 0 (0.0%) | 0 (0.0%) |
| 2 Vehicles | 105 (82.7%) | 0 (0.0%) |
| 3 or more Vehicles | 22 (17.3%) | 0 (0.0%) |
| Total | 127 (100.0%) | 0 (0.0%) |
Real Estate & Mortgages in Pine Valley
Real Estate and Mortgage Overview in Pine Valley
| Characteristic | Without Mortgage | With Mortgage |
| Housing Units | 33 | 94 |
| Median Property Value | - | - |
| Median Household Income | - | - |
| Monthly Housing Costs | - | - |
| Real Estate Taxes | - | - |
Property Value by Mortgage Status in Pine Valley
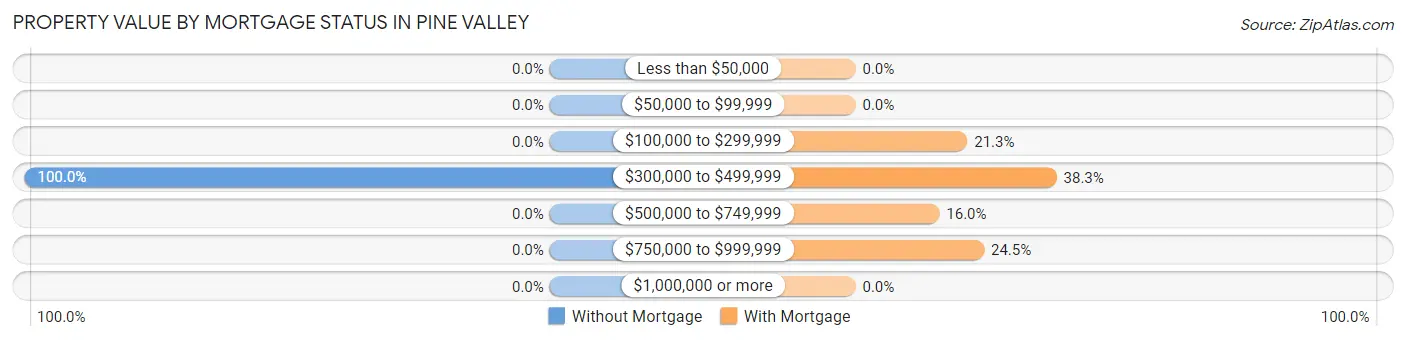
| Property Value | Without Mortgage | With Mortgage |
| Less than $50,000 | 0 (0.0%) | 0 (0.0%) |
| $50,000 to $99,999 | 0 (0.0%) | 0 (0.0%) |
| $100,000 to $299,999 | 0 (0.0%) | 20 (21.3%) |
| $300,000 to $499,999 | 33 (100.0%) | 36 (38.3%) |
| $500,000 to $749,999 | 0 (0.0%) | 15 (16.0%) |
| $750,000 to $999,999 | 0 (0.0%) | 23 (24.5%) |
| $1,000,000 or more | 0 (0.0%) | 0 (0.0%) |
| Total | 33 (100.0%) | 94 (100.0%) |
Household Income by Mortgage Status in Pine Valley
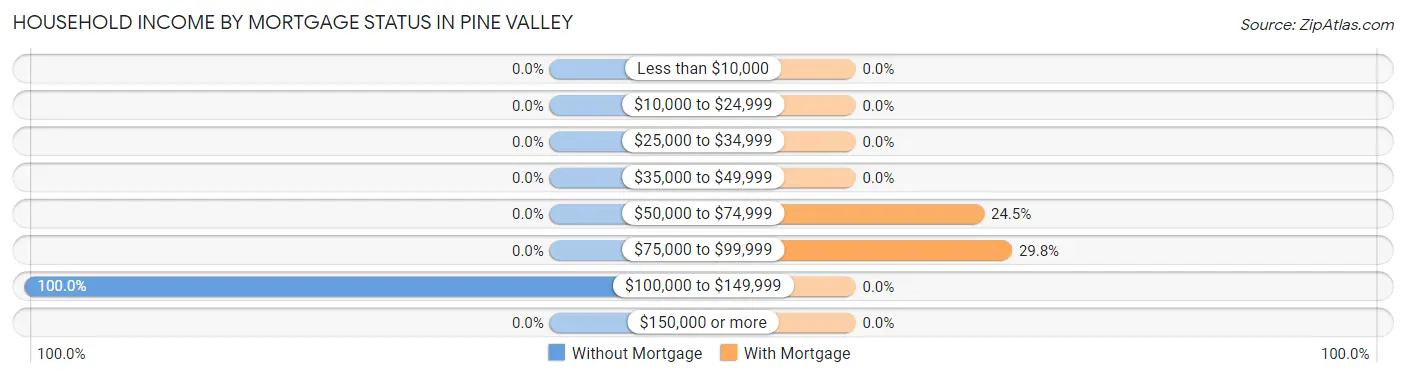
| Household Income | Without Mortgage | With Mortgage |
| Less than $10,000 | 0 (0.0%) | 0 (0.0%) |
| $10,000 to $24,999 | 0 (0.0%) | 0 (0.0%) |
| $25,000 to $34,999 | 0 (0.0%) | 0 (0.0%) |
| $35,000 to $49,999 | 0 (0.0%) | 0 (0.0%) |
| $50,000 to $74,999 | 0 (0.0%) | 23 (24.5%) |
| $75,000 to $99,999 | 0 (0.0%) | 28 (29.8%) |
| $100,000 to $149,999 | 33 (100.0%) | 0 (0.0%) |
| $150,000 or more | 0 (0.0%) | 0 (0.0%) |
| Total | 33 (100.0%) | 94 (100.0%) |
Property Value to Household Income Ratio in Pine Valley
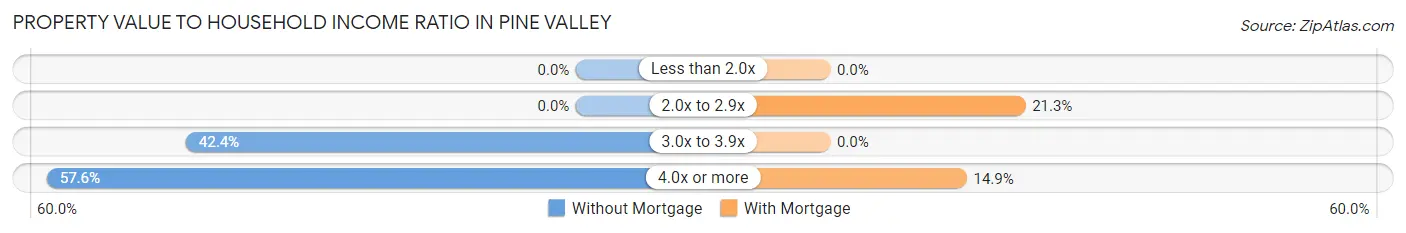
| Value-to-Income Ratio | Without Mortgage | With Mortgage |
| Less than 2.0x | 0 (0.0%) | 0 (0.0%) |
| 2.0x to 2.9x | 0 (0.0%) | 20 (21.3%) |
| 3.0x to 3.9x | 14 (42.4%) | 0 (0.0%) |
| 4.0x or more | 19 (57.6%) | 14 (14.9%) |
| Total | 33 (100.0%) | 94 (100.0%) |
Real Estate Taxes by Mortgage Status in Pine Valley
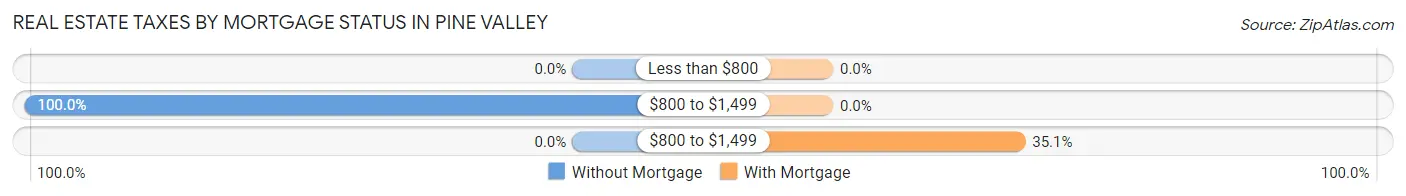
| Property Taxes | Without Mortgage | With Mortgage |
| Less than $800 | 0 (0.0%) | 0 (0.0%) |
| $800 to $1,499 | 33 (100.0%) | 0 (0.0%) |
| $800 to $1,499 | 0 (0.0%) | 33 (35.1%) |
| Total | 33 (100.0%) | 94 (100.0%) |
Health & Disability in Pine Valley
Health Insurance Coverage by Age in Pine Valley
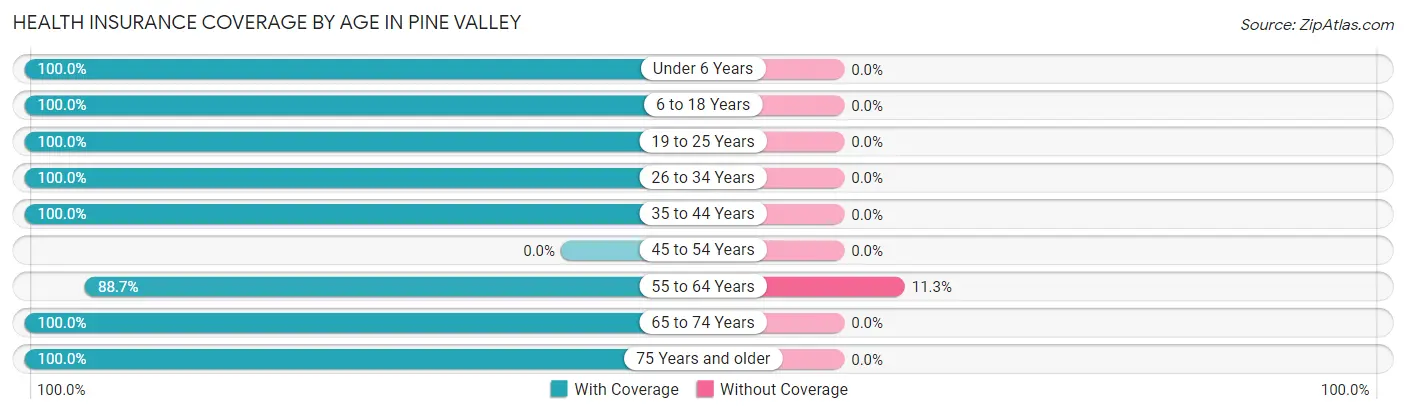
| Age Bracket | With Coverage | Without Coverage |
| Under 6 Years | 14 (100.0%) | 0 (0.0%) |
| 6 to 18 Years | 34 (100.0%) | 0 (0.0%) |
| 19 to 25 Years | 14 (100.0%) | 0 (0.0%) |
| 26 to 34 Years | 32 (100.0%) | 0 (0.0%) |
| 35 to 44 Years | 19 (100.0%) | 0 (0.0%) |
| 45 to 54 Years | 0 (0.0%) | 0 (0.0%) |
| 55 to 64 Years | 118 (88.7%) | 15 (11.3%) |
| 65 to 74 Years | 54 (100.0%) | 0 (0.0%) |
| 75 Years and older | 10 (100.0%) | 0 (0.0%) |
| Total | 295 (95.2%) | 15 (4.8%) |
Health Insurance Coverage by Citizenship Status in Pine Valley
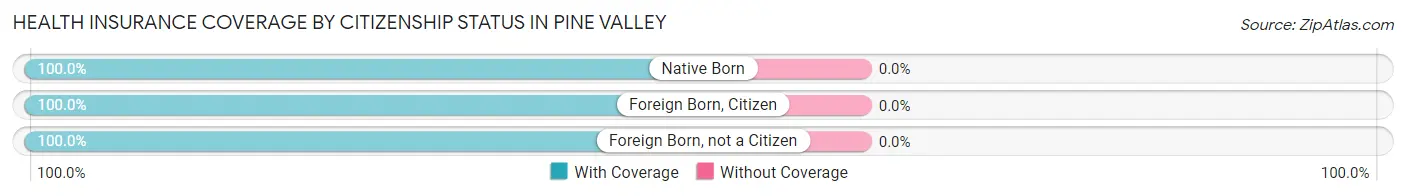
| Citizenship Status | With Coverage | Without Coverage |
| Native Born | 14 (100.0%) | 0 (0.0%) |
| Foreign Born, Citizen | 34 (100.0%) | 0 (0.0%) |
| Foreign Born, not a Citizen | 14 (100.0%) | 0 (0.0%) |
Health Insurance Coverage by Household Income in Pine Valley
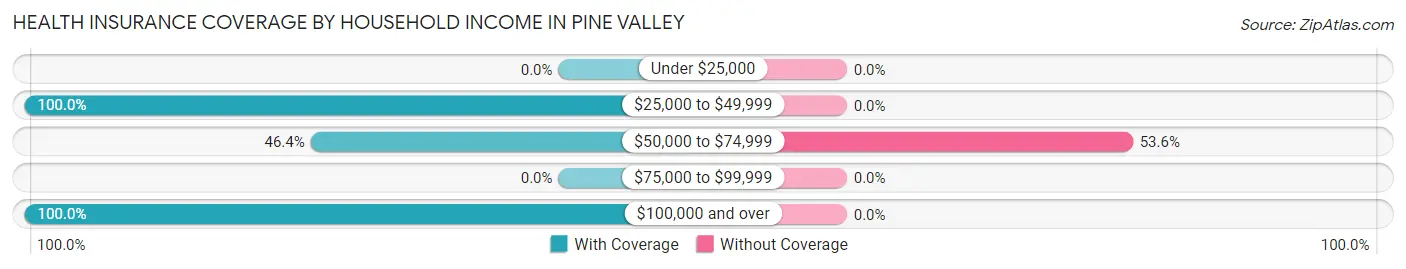
| Household Income | With Coverage | Without Coverage |
| Under $25,000 | 0 (0.0%) | 0 (0.0%) |
| $25,000 to $49,999 | 45 (100.0%) | 0 (0.0%) |
| $50,000 to $74,999 | 13 (46.4%) | 15 (53.6%) |
| $75,000 to $99,999 | 0 (0.0%) | 0 (0.0%) |
| $100,000 and over | 237 (100.0%) | 0 (0.0%) |
Public vs Private Health Insurance Coverage by Age in Pine Valley
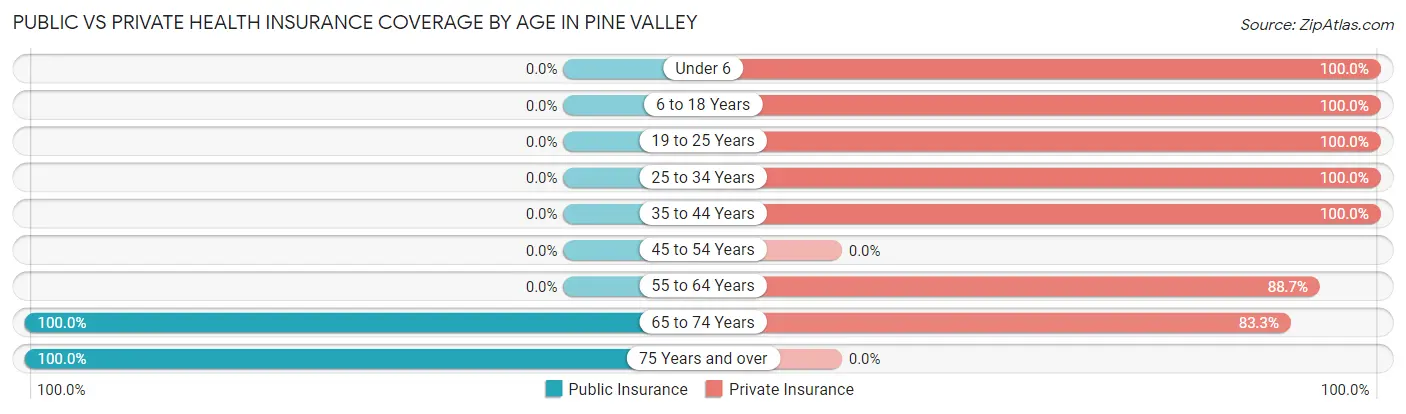
| Age Bracket | Public Insurance | Private Insurance |
| Under 6 | 0 (0.0%) | 14 (100.0%) |
| 6 to 18 Years | 0 (0.0%) | 34 (100.0%) |
| 19 to 25 Years | 0 (0.0%) | 14 (100.0%) |
| 25 to 34 Years | 0 (0.0%) | 32 (100.0%) |
| 35 to 44 Years | 0 (0.0%) | 19 (100.0%) |
| 45 to 54 Years | 0 (0.0%) | 0 (0.0%) |
| 55 to 64 Years | 0 (0.0%) | 118 (88.7%) |
| 65 to 74 Years | 54 (100.0%) | 45 (83.3%) |
| 75 Years and over | 10 (100.0%) | 0 (0.0%) |
| Total | 64 (20.6%) | 276 (89.0%) |
Disability Status by Sex by Age in Pine Valley
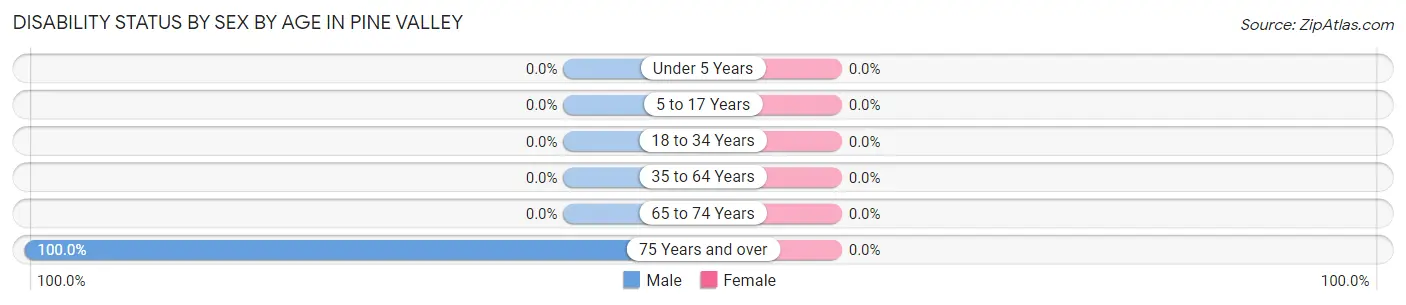
| Age Bracket | Male | Female |
| Under 5 Years | 0 (0.0%) | 0 (0.0%) |
| 5 to 17 Years | 0 (0.0%) | 0 (0.0%) |
| 18 to 34 Years | 0 (0.0%) | 0 (0.0%) |
| 35 to 64 Years | 0 (0.0%) | 0 (0.0%) |
| 65 to 74 Years | 0 (0.0%) | 0 (0.0%) |
| 75 Years and over | 10 (100.0%) | 0 (0.0%) |
Disability Class by Sex by Age in Pine Valley
Disability Class: Hearing Difficulty
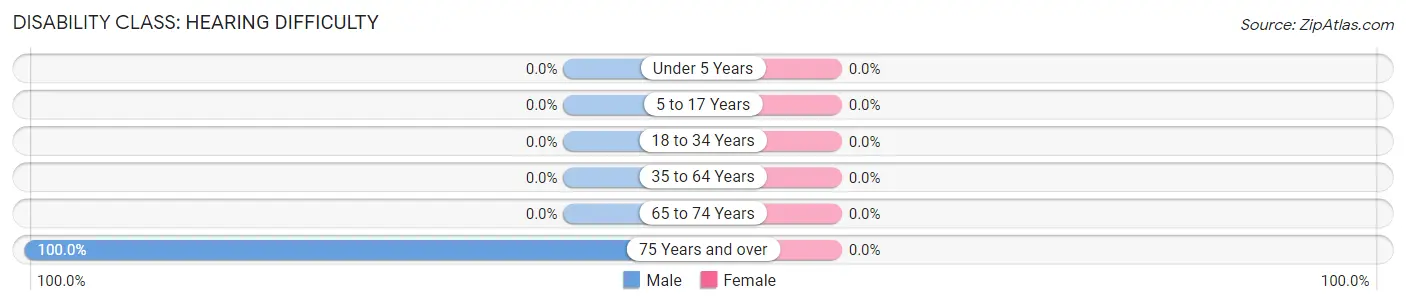
| Age Bracket | Male | Female |
| Under 5 Years | 0 (0.0%) | 0 (0.0%) |
| 5 to 17 Years | 0 (0.0%) | 0 (0.0%) |
| 18 to 34 Years | 0 (0.0%) | 0 (0.0%) |
| 35 to 64 Years | 0 (0.0%) | 0 (0.0%) |
| 65 to 74 Years | 0 (0.0%) | 0 (0.0%) |
| 75 Years and over | 10 (100.0%) | 0 (0.0%) |
Disability Class: Vision Difficulty
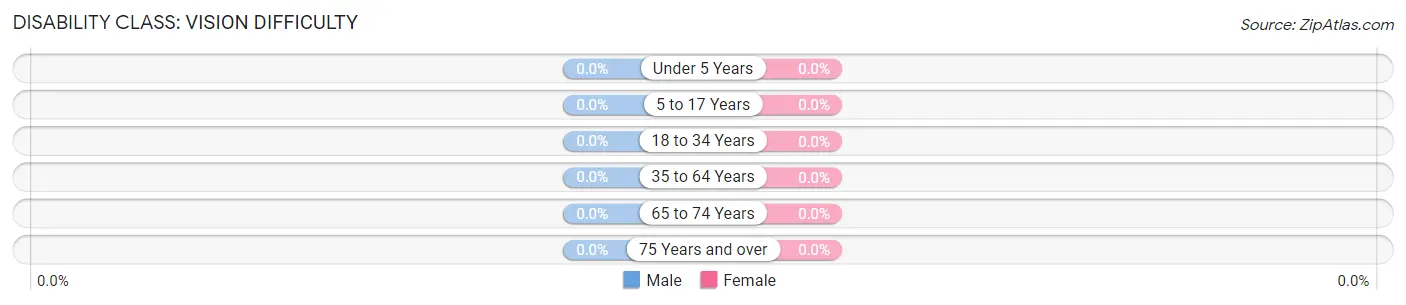
| Age Bracket | Male | Female |
| Under 5 Years | 0 (0.0%) | 0 (0.0%) |
| 5 to 17 Years | 0 (0.0%) | 0 (0.0%) |
| 18 to 34 Years | 0 (0.0%) | 0 (0.0%) |
| 35 to 64 Years | 0 (0.0%) | 0 (0.0%) |
| 65 to 74 Years | 0 (0.0%) | 0 (0.0%) |
| 75 Years and over | 0 (0.0%) | 0 (0.0%) |
Disability Class: Cognitive Difficulty
| Age Bracket | Male | Female |
| 5 to 17 Years | 0 (0.0%) | 0 (0.0%) |
| 18 to 34 Years | 0 (0.0%) | 0 (0.0%) |
| 35 to 64 Years | 0 (0.0%) | 0 (0.0%) |
| 65 to 74 Years | 0 (0.0%) | 0 (0.0%) |
| 75 Years and over | 0 (0.0%) | 0 (0.0%) |
Disability Class: Ambulatory Difficulty
| Age Bracket | Male | Female |
| 5 to 17 Years | 0 (0.0%) | 0 (0.0%) |
| 18 to 34 Years | 0 (0.0%) | 0 (0.0%) |
| 35 to 64 Years | 0 (0.0%) | 0 (0.0%) |
| 65 to 74 Years | 0 (0.0%) | 0 (0.0%) |
| 75 Years and over | 0 (0.0%) | 0 (0.0%) |
Disability Class: Self-Care Difficulty
| Age Bracket | Male | Female |
| 5 to 17 Years | 0 (0.0%) | 0 (0.0%) |
| 18 to 34 Years | 0 (0.0%) | 0 (0.0%) |
| 35 to 64 Years | 0 (0.0%) | 0 (0.0%) |
| 65 to 74 Years | 0 (0.0%) | 0 (0.0%) |
| 75 Years and over | 0 (0.0%) | 0 (0.0%) |
Technology Access in Pine Valley
Computing Device Access in Pine Valley
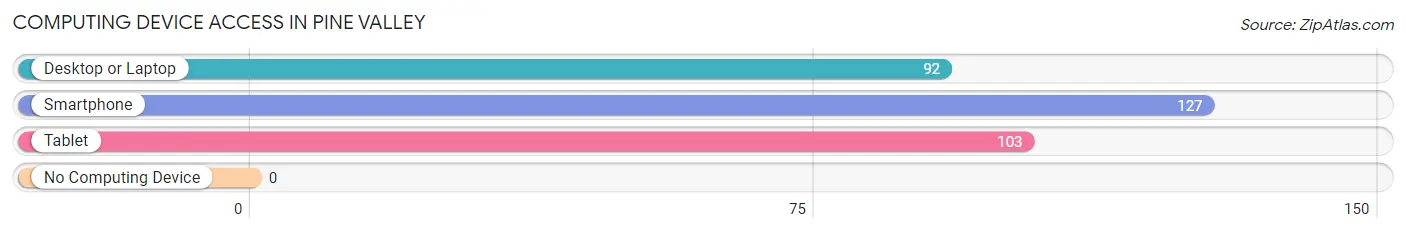
| Device Type | # Households | % Households |
| Desktop or Laptop | 92 | 72.4% |
| Smartphone | 127 | 100.0% |
| Tablet | 103 | 81.1% |
| No Computing Device | 0 | 0.0% |
| Total | 127 | 100.0% |
Internet Access in Pine Valley
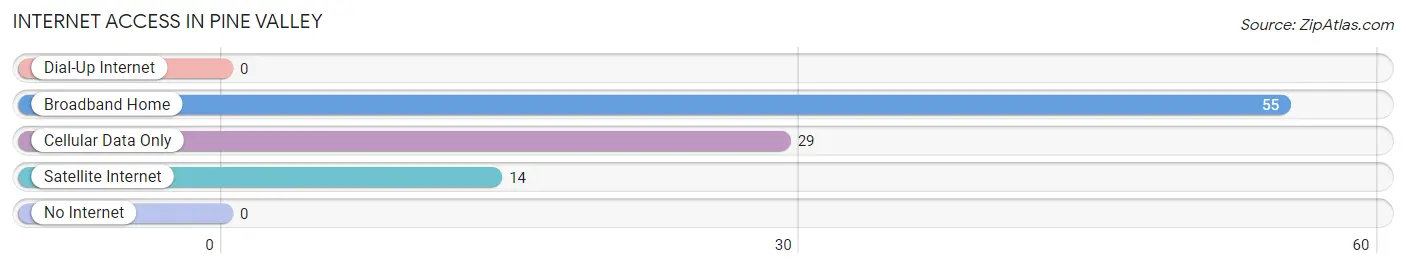
| Internet Type | # Households | % Households |
| Dial-Up Internet | 0 | 0.0% |
| Broadband Home | 55 | 43.3% |
| Cellular Data Only | 29 | 22.8% |
| Satellite Internet | 14 | 11.0% |
| No Internet | 0 | 0.0% |
| Total | 127 | 100.0% |
Pine Valley Summary
Pine Valley is a small unincorporated community located in Washington County, Utah, United States. It is situated in the southwestern corner of the state, near the Arizona border. The population of Pine Valley was estimated to be around 1,000 in 2020.
History
Pine Valley was first settled in 1859 by a group of Mormon pioneers led by Erastus Snow. The pioneers were sent by Brigham Young to establish a settlement in the area. The settlement was named after the nearby Pine Valley Mountains. The settlers built a fort and a small community, and the area quickly became a popular destination for travelers and settlers.
In 1868, the first school in Pine Valley was established. The school was a one-room log cabin, and it served as the center of education for the community. In 1871, the first church was built in Pine Valley. The church was a branch of The Church of Jesus Christ of Latter-day Saints, and it served as the spiritual center of the community.
In the late 1800s, the area around Pine Valley began to experience a population boom. The population of the area increased from around 500 in 1880 to over 1,000 in 1900. This population growth was due to the influx of settlers from other parts of Utah and the United States.
Geography
Pine Valley is located in the southwestern corner of Utah, near the Arizona border. The area is characterized by its mountainous terrain, with the Pine Valley Mountains to the north and the Virgin River to the south. The area is also home to several small lakes, including Pine Valley Lake and Quail Lake.
The climate in Pine Valley is semi-arid, with hot summers and cold winters. The average annual temperature is around 50°F (10°C). The area receives an average of 10 inches (25 cm) of precipitation per year.
Economy
The economy of Pine Valley is largely based on agriculture and tourism. The area is home to several farms, which produce a variety of crops, including hay, alfalfa, and wheat. The area is also home to several ranches, which raise cattle and sheep.
Tourism is an important part of the economy of Pine Valley. The area is home to several popular attractions, including Zion National Park, Bryce Canyon National Park, and the Grand Staircase-Escalante National Monument. The area is also home to several ski resorts, which attract visitors from all over the world.
Demographics
The population of Pine Valley was estimated to be around 1,000 in 2020. The population is predominantly white, with a small minority of Native Americans and Hispanics. The median household income in Pine Valley is around $50,000, and the median home value is around $200,000. The area is served by several public schools, including Pine Valley Elementary School and Pine Valley High School.
Common Questions
What is Per Capita Income in Pine Valley?
Per Capita income in Pine Valley is $50,100.
What is the Median Family Income in Pine Valley?
Median Family Income in Pine Valley is $128,839.
What is the Median Household income in Pine Valley?
Median Household Income in Pine Valley is $119,145.
What is Inequality or Gini Index in Pine Valley?
Inequality or Gini Index in Pine Valley is 0.28.
What is the Total Population of Pine Valley?
Total Population of Pine Valley is 310.
What is the Total Male Population of Pine Valley?
Total Male Population of Pine Valley is 213.
What is the Total Female Population of Pine Valley?
Total Female Population of Pine Valley is 97.
What is the Ratio of Males per 100 Females in Pine Valley?
There are 219.59 Males per 100 Females in Pine Valley.
What is the Ratio of Females per 100 Males in Pine Valley?
There are 45.54 Females per 100 Males in Pine Valley.
What is the Median Population Age in Pine Valley?
Median Population Age in Pine Valley is 59.7 Years.
What is the Average Family Size in Pine Valley
Average Family Size in Pine Valley is 2.9 People.
What is the Average Household Size in Pine Valley
Average Household Size in Pine Valley is 2.4 People.
How Large is the Labor Force in Pine Valley?
There are 133 People in the Labor Forcein in Pine Valley.
What is the Percentage of People in the Labor Force in Pine Valley?
50.8% of People are in the Labor Force in Pine Valley.