Huntsville, UT Map & Demographics
Huntsville Map
Huntsville Overview
$43,763
PER CAPITA INCOME
$115,924
AVG FAMILY INCOME
$110,417
AVG HOUSEHOLD INCOME
68.9%
WAGE / INCOME GAP [ % ]
31.1¢/ $1
WAGE / INCOME GAP [ $ ]
0.37
INEQUALITY / GINI INDEX
480
TOTAL POPULATION
263
MALE POPULATION
217
FEMALE POPULATION
121.20
MALES / 100 FEMALES
82.51
FEMALES / 100 MALES
56.8
MEDIAN AGE
2.6
AVG FAMILY SIZE
2.4
AVG HOUSEHOLD SIZE
239
LABOR FORCE [ PEOPLE ]
56.8%
PERCENT IN LABOR FORCE
5.0%
UNEMPLOYMENT RATE
Huntsville Zip Codes
Huntsville Area Codes
Income in Huntsville
Income Overview in Huntsville
Per Capita Income in Huntsville is $43,763, while median incomes of families and households are $115,924 and $110,417 respectively.
| Characteristic | Number | Measure |
| Per Capita Income | 480 | $43,763 |
| Median Family Income | 171 | $115,924 |
| Mean Family Income | 171 | $123,174 |
| Median Household Income | 201 | $110,417 |
| Mean Household Income | 201 | $111,371 |
| Income Deficit | 171 | $0 |
| Wage / Income Gap (%) | 480 | 68.87% |
| Wage / Income Gap ($) | 480 | 31.13¢ per $1 |
| Gini / Inequality Index | 480 | 0.37 |
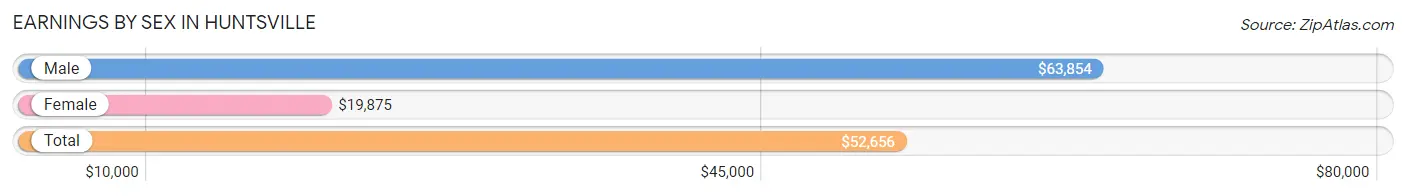
Earnings by Sex in Huntsville
Average Earnings in Huntsville are $52,656, $63,854 for men and $19,875 for women, a difference of 68.9%.
| Sex | Number | Average Earnings |
| Male | 150 (62.8%) | $63,854 |
| Female | 89 (37.2%) | $19,875 |
| Total | 239 (100.0%) | $52,656 |
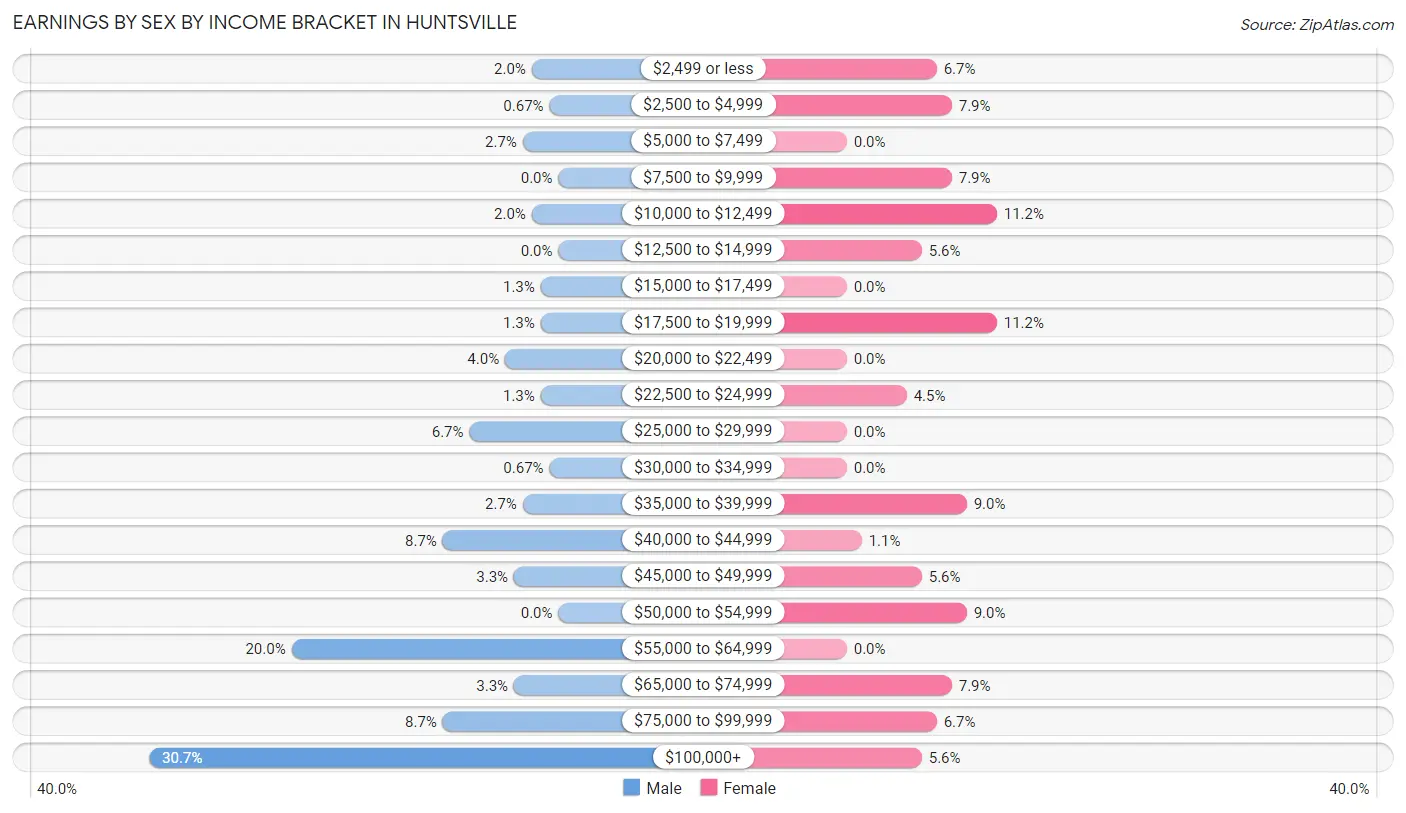
Earnings by Sex by Income Bracket in Huntsville
The most common earnings brackets in Huntsville are $100,000+ for men (46 | 30.7%) and $10,000 to $12,499 for women (10 | 11.2%).
| Income | Male | Female |
| $2,499 or less | 3 (2.0%) | 6 (6.7%) |
| $2,500 to $4,999 | 1 (0.7%) | 7 (7.9%) |
| $5,000 to $7,499 | 4 (2.7%) | 0 (0.0%) |
| $7,500 to $9,999 | 0 (0.0%) | 7 (7.9%) |
| $10,000 to $12,499 | 3 (2.0%) | 10 (11.2%) |
| $12,500 to $14,999 | 0 (0.0%) | 5 (5.6%) |
| $15,000 to $17,499 | 2 (1.3%) | 0 (0.0%) |
| $17,500 to $19,999 | 2 (1.3%) | 10 (11.2%) |
| $20,000 to $22,499 | 6 (4.0%) | 0 (0.0%) |
| $22,500 to $24,999 | 2 (1.3%) | 4 (4.5%) |
| $25,000 to $29,999 | 10 (6.7%) | 0 (0.0%) |
| $30,000 to $34,999 | 1 (0.7%) | 0 (0.0%) |
| $35,000 to $39,999 | 4 (2.7%) | 8 (9.0%) |
| $40,000 to $44,999 | 13 (8.7%) | 1 (1.1%) |
| $45,000 to $49,999 | 5 (3.3%) | 5 (5.6%) |
| $50,000 to $54,999 | 0 (0.0%) | 8 (9.0%) |
| $55,000 to $64,999 | 30 (20.0%) | 0 (0.0%) |
| $65,000 to $74,999 | 5 (3.3%) | 7 (7.9%) |
| $75,000 to $99,999 | 13 (8.7%) | 6 (6.7%) |
| $100,000+ | 46 (30.7%) | 5 (5.6%) |
| Total | 150 (100.0%) | 89 (100.0%) |
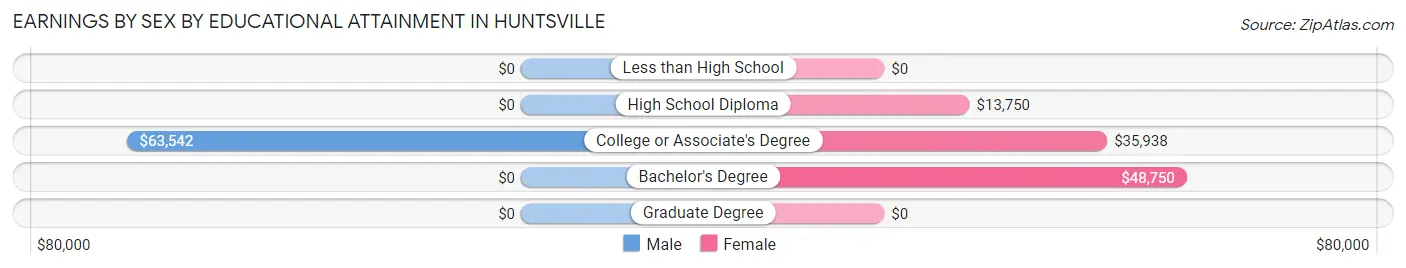
Earnings by Sex by Educational Attainment in Huntsville
Average earnings in Huntsville are $64,010 for men and $24,063 for women, a difference of 62.4%. Men with an educational attainment of college or associate's degree enjoy the highest average annual earnings of $63,542, while those with college or associate's degree education earn the least with $63,542. Women with an educational attainment of bachelor's degree earn the most with the average annual earnings of $48,750, while those with high school diploma education have the smallest earnings of $13,750.
| Educational Attainment | Male Income | Female Income |
| Less than High School | - | - |
| High School Diploma | - | - |
| College or Associate's Degree | $63,542 | $35,938 |
| Bachelor's Degree | - | - |
| Graduate Degree | - | - |
| Total | $64,010 | $24,063 |
Family Income in Huntsville
Family Income Brackets in Huntsville
According to the Huntsville family income data, there are 68 families falling into the $100,000 to $149,999 income range, which is the most common income bracket and makes up 39.8% of all families.
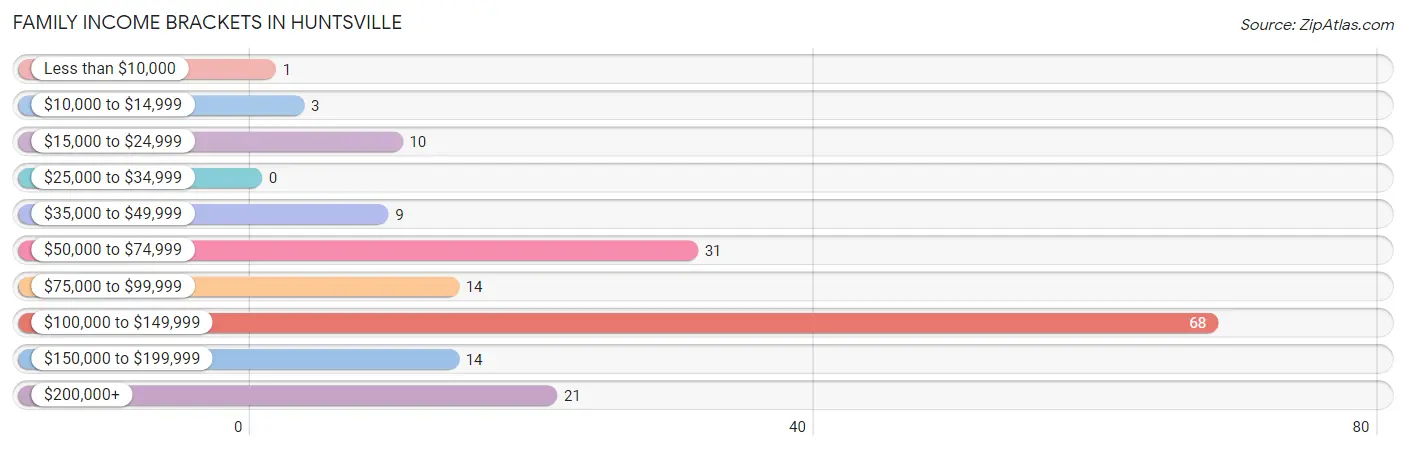
| Income Bracket | # Families | % Families |
| Less than $10,000 | 1 | 0.6% |
| $10,000 to $14,999 | 3 | 1.8% |
| $15,000 to $24,999 | 10 | 5.8% |
| $25,000 to $34,999 | 0 | 0.0% |
| $35,000 to $49,999 | 9 | 5.3% |
| $50,000 to $74,999 | 31 | 18.1% |
| $75,000 to $99,999 | 14 | 8.2% |
| $100,000 to $149,999 | 68 | 39.8% |
| $150,000 to $199,999 | 14 | 8.2% |
| $200,000+ | 21 | 12.3% |
Family Income by Famaliy Size in Huntsville
3-person families (32 | 18.7%) account for the highest median family income in Huntsville with $196,250 per family, while 3-person families (32 | 18.7%) have the highest median income of $65,417 per family member.
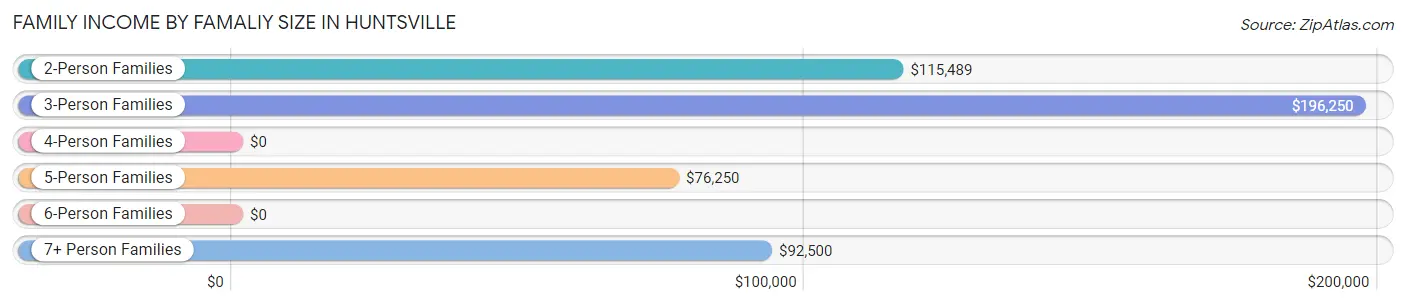
| Income Bracket | # Families | Median Income |
| 2-Person Families | 109 (63.7%) | $115,489 |
| 3-Person Families | 32 (18.7%) | $196,250 |
| 4-Person Families | 9 (5.3%) | $0 |
| 5-Person Families | 14 (8.2%) | $76,250 |
| 6-Person Families | 1 (0.6%) | $0 |
| 7+ Person Families | 6 (3.5%) | $92,500 |
| Total | 171 (100.0%) | $115,924 |
Family Income by Number of Earners in Huntsville
The median family income in Huntsville is $115,924, with families comprising 1 earner (58) having the highest median family income of $135,096, while families with no earners (26) have the lowest median family income of $66,000, accounting for 33.9% and 15.2% of families, respectively.
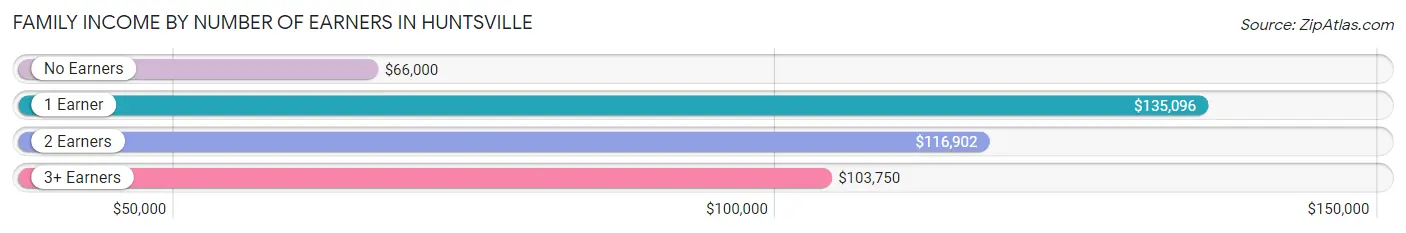
| Number of Earners | # Families | Median Income |
| No Earners | 26 (15.2%) | $66,000 |
| 1 Earner | 58 (33.9%) | $135,096 |
| 2 Earners | 75 (43.9%) | $116,902 |
| 3+ Earners | 12 (7.0%) | $103,750 |
| Total | 171 (100.0%) | $115,924 |
Household Income in Huntsville
Household Income Brackets in Huntsville
With 68 households falling in the category, the $100,000 to $149,999 income range is the most frequent in Huntsville, accounting for 33.8% of all households. In contrast, only 1 households (0.5%) fall into the less than $10,000 income bracket, making it the least populous group.
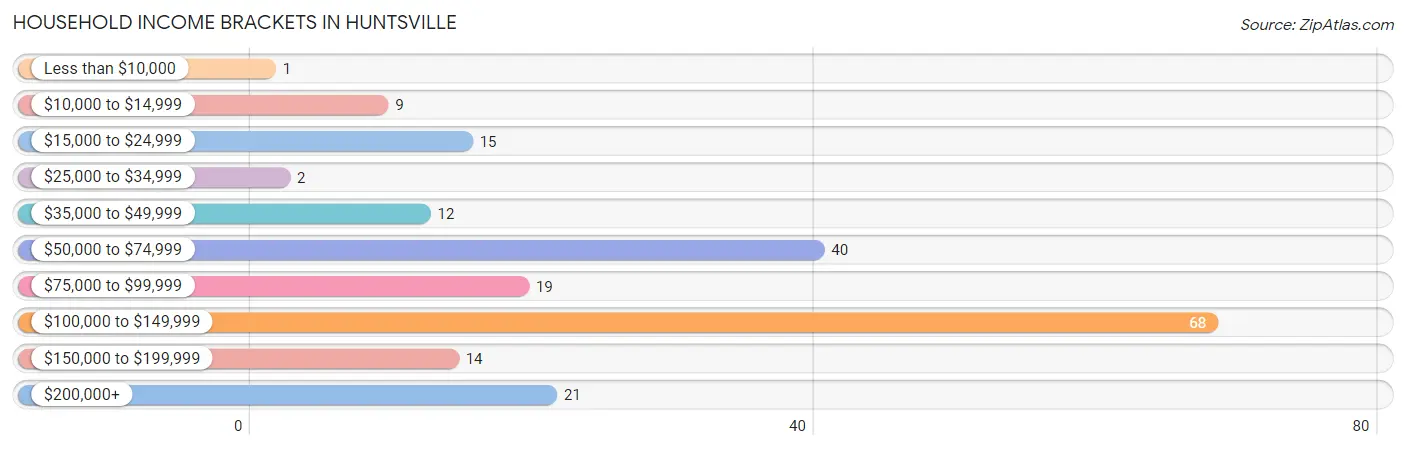
| Income Bracket | # Households | % Households |
| Less than $10,000 | 1 | 0.5% |
| $10,000 to $14,999 | 9 | 4.5% |
| $15,000 to $24,999 | 15 | 7.5% |
| $25,000 to $34,999 | 2 | 1.0% |
| $35,000 to $49,999 | 12 | 6.0% |
| $50,000 to $74,999 | 40 | 19.9% |
| $75,000 to $99,999 | 19 | 9.5% |
| $100,000 to $149,999 | 68 | 33.8% |
| $150,000 to $199,999 | 14 | 7.0% |
| $200,000+ | 21 | 10.4% |
Household Income by Householder Age in Huntsville
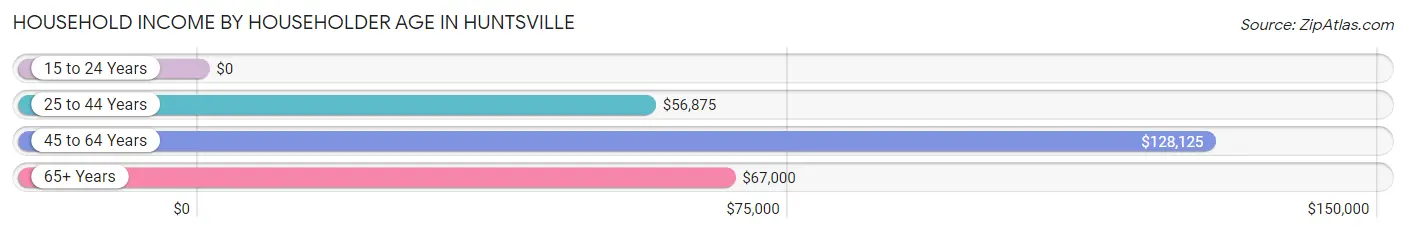
The median household income in Huntsville is $110,417, with the highest median household income of $128,125 found in the 45 to 64 years age bracket for the primary householder. A total of 101 households (50.2%) fall into this category.
| Income Bracket | # Households | Median Income |
| 15 to 24 Years | 0 (0.0%) | $0 |
| 25 to 44 Years | 32 (15.9%) | $56,875 |
| 45 to 64 Years | 101 (50.2%) | $128,125 |
| 65+ Years | 68 (33.8%) | $67,000 |
| Total | 201 (100.0%) | $110,417 |
Poverty in Huntsville
Income Below Poverty by Sex and Age in Huntsville
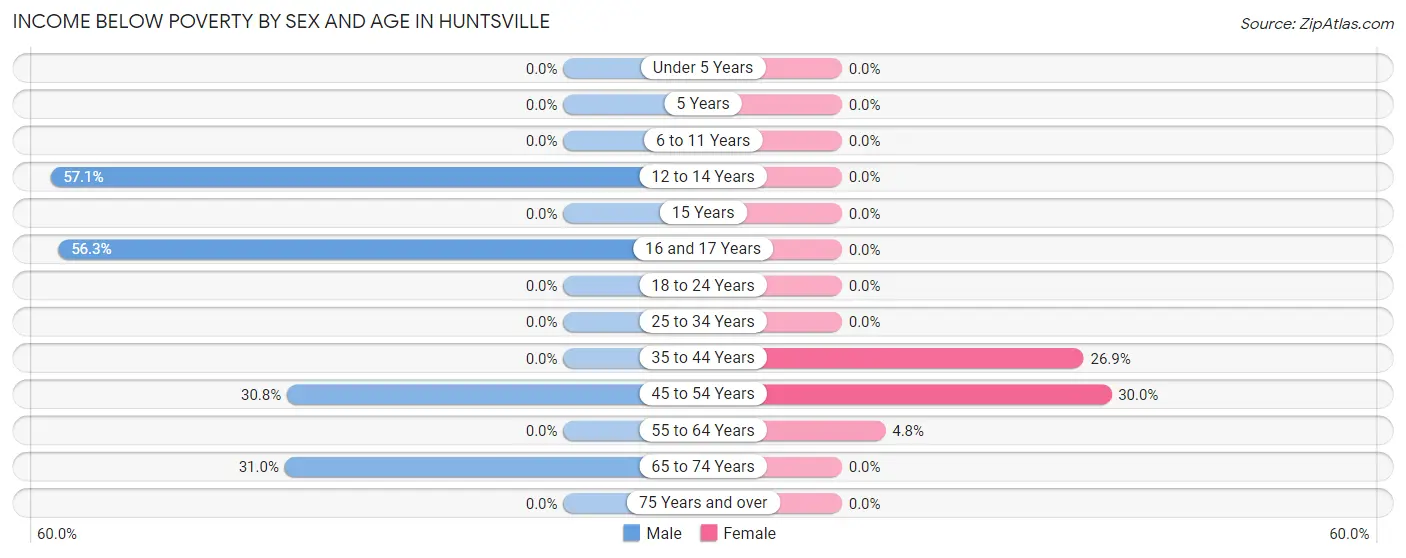
With 9.9% poverty level for males and 6.0% for females among the residents of Huntsville, 12 to 14 year old males and 45 to 54 year old females are the most vulnerable to poverty, with 4 males (57.1%) and 3 females (30.0%) in their respective age groups living below the poverty level.
| Age Bracket | Male | Female |
| Under 5 Years | 0 (0.0%) | 0 (0.0%) |
| 5 Years | 0 (0.0%) | 0 (0.0%) |
| 6 to 11 Years | 0 (0.0%) | 0 (0.0%) |
| 12 to 14 Years | 4 (57.1%) | 0 (0.0%) |
| 15 Years | 0 (0.0%) | 0 (0.0%) |
| 16 and 17 Years | 9 (56.2%) | 0 (0.0%) |
| 18 to 24 Years | 0 (0.0%) | 0 (0.0%) |
| 25 to 34 Years | 0 (0.0%) | 0 (0.0%) |
| 35 to 44 Years | 0 (0.0%) | 7 (26.9%) |
| 45 to 54 Years | 4 (30.8%) | 3 (30.0%) |
| 55 to 64 Years | 0 (0.0%) | 3 (4.8%) |
| 65 to 74 Years | 9 (31.0%) | 0 (0.0%) |
| 75 Years and over | 0 (0.0%) | 0 (0.0%) |
| Total | 26 (9.9%) | 13 (6.0%) |
Income Above Poverty by Sex and Age in Huntsville
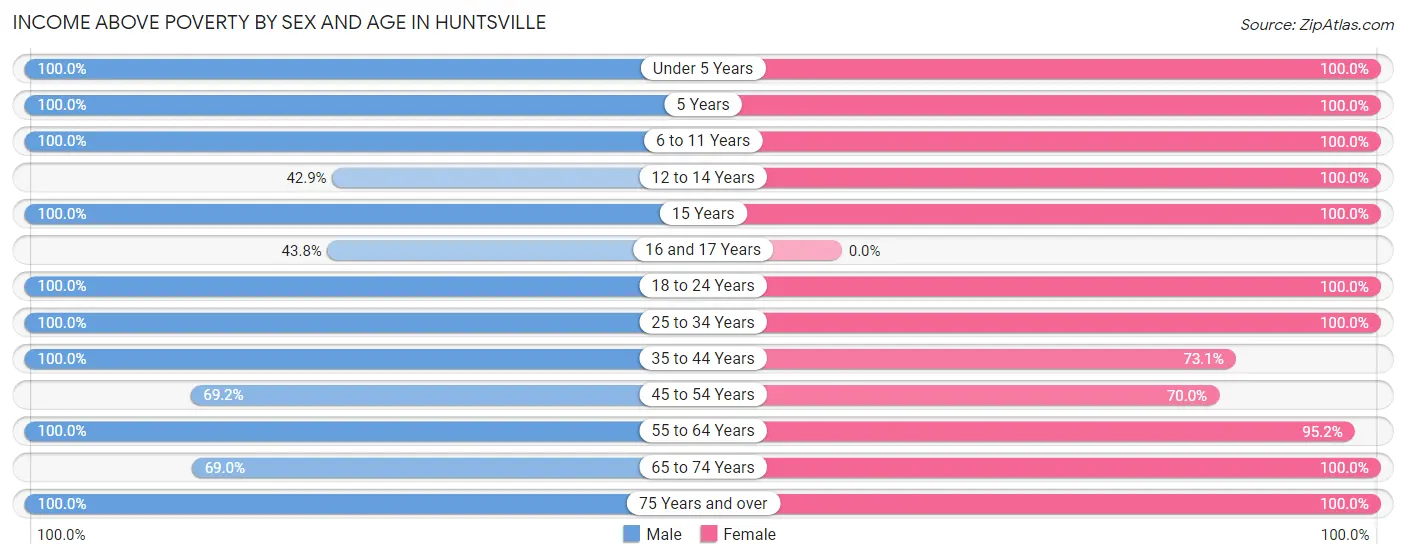
According to the poverty statistics in Huntsville, males aged under 5 years and females aged under 5 years are the age groups that are most secure financially, with 100.0% of males and 100.0% of females in these age groups living above the poverty line.
| Age Bracket | Male | Female |
| Under 5 Years | 5 (100.0%) | 9 (100.0%) |
| 5 Years | 6 (100.0%) | 3 (100.0%) |
| 6 to 11 Years | 10 (100.0%) | 8 (100.0%) |
| 12 to 14 Years | 3 (42.9%) | 4 (100.0%) |
| 15 Years | 4 (100.0%) | 3 (100.0%) |
| 16 and 17 Years | 7 (43.8%) | 0 (0.0%) |
| 18 to 24 Years | 17 (100.0%) | 6 (100.0%) |
| 25 to 34 Years | 24 (100.0%) | 36 (100.0%) |
| 35 to 44 Years | 15 (100.0%) | 19 (73.1%) |
| 45 to 54 Years | 9 (69.2%) | 7 (70.0%) |
| 55 to 64 Years | 89 (100.0%) | 59 (95.2%) |
| 65 to 74 Years | 20 (69.0%) | 22 (100.0%) |
| 75 Years and over | 28 (100.0%) | 28 (100.0%) |
| Total | 237 (90.1%) | 204 (94.0%) |
Income Below Poverty Among Married-Couple Families in Huntsville
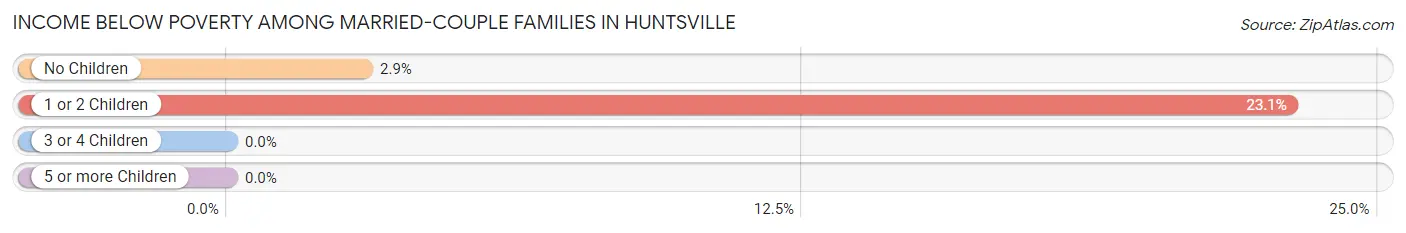
The poverty statistics for married-couple families in Huntsville show that 4.4% or 7 of the total 159 families live below the poverty line. Families with 1 or 2 children have the highest poverty rate of 23.1%, comprising of 3 families. On the other hand, families with 3 or 4 children have the lowest poverty rate of 0.0%, which includes 0 families.
| Children | Above Poverty | Below Poverty |
| No Children | 132 (97.1%) | 4 (2.9%) |
| 1 or 2 Children | 10 (76.9%) | 3 (23.1%) |
| 3 or 4 Children | 10 (100.0%) | 0 (0.0%) |
| 5 or more Children | 0 (0.0%) | 0 (0.0%) |
| Total | 152 (95.6%) | 7 (4.4%) |
Income Below Poverty Among Single-Parent Households in Huntsville
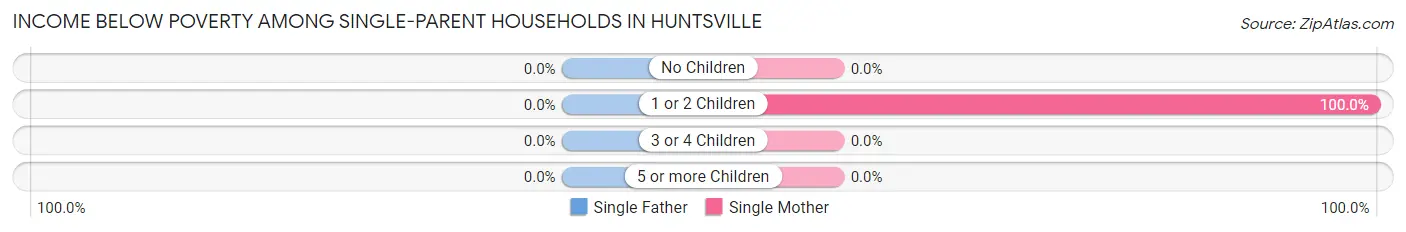
| Children | Single Father | Single Mother |
| No Children | 0 (0.0%) | 0 (0.0%) |
| 1 or 2 Children | 0 (0.0%) | 6 (100.0%) |
| 3 or 4 Children | 0 (0.0%) | 0 (0.0%) |
| 5 or more Children | 0 (0.0%) | 0 (0.0%) |
| Total | 0 (0.0%) | 6 (50.0%) |
Income Below Poverty Among Married-Couple vs Single-Parent Households in Huntsville
The poverty data for Huntsville shows that 7 of the married-couple family households (4.4%) and 6 of the single-parent households (50.0%) are living below the poverty level. Within the married-couple family households, those with 1 or 2 children have the highest poverty rate, with 3 households (23.1%) falling below the poverty line. Among the single-parent households, those with 1 or 2 children have the highest poverty rate, with 6 household (100.0%) living below poverty.
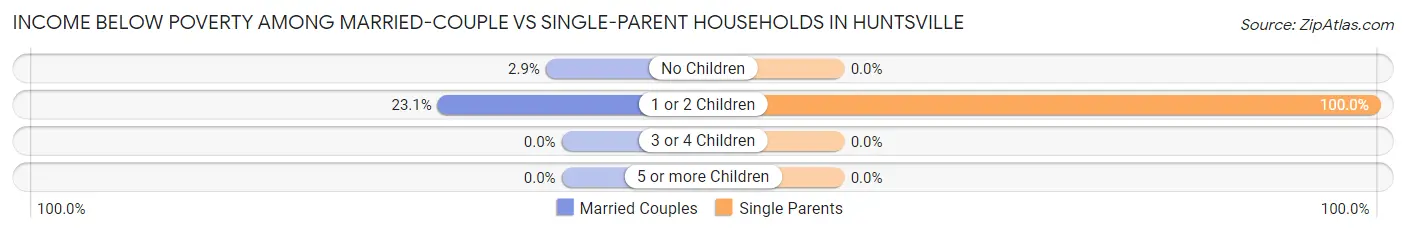
| Children | Married-Couple Families | Single-Parent Households |
| No Children | 4 (2.9%) | 0 (0.0%) |
| 1 or 2 Children | 3 (23.1%) | 6 (100.0%) |
| 3 or 4 Children | 0 (0.0%) | 0 (0.0%) |
| 5 or more Children | 0 (0.0%) | 0 (0.0%) |
| Total | 7 (4.4%) | 6 (50.0%) |
Race in Huntsville
The most populous races in Huntsville are White / Caucasian (471 | 98.1%), Hispanic or Latino (10 | 2.1%), and Asian (6 | 1.3%).
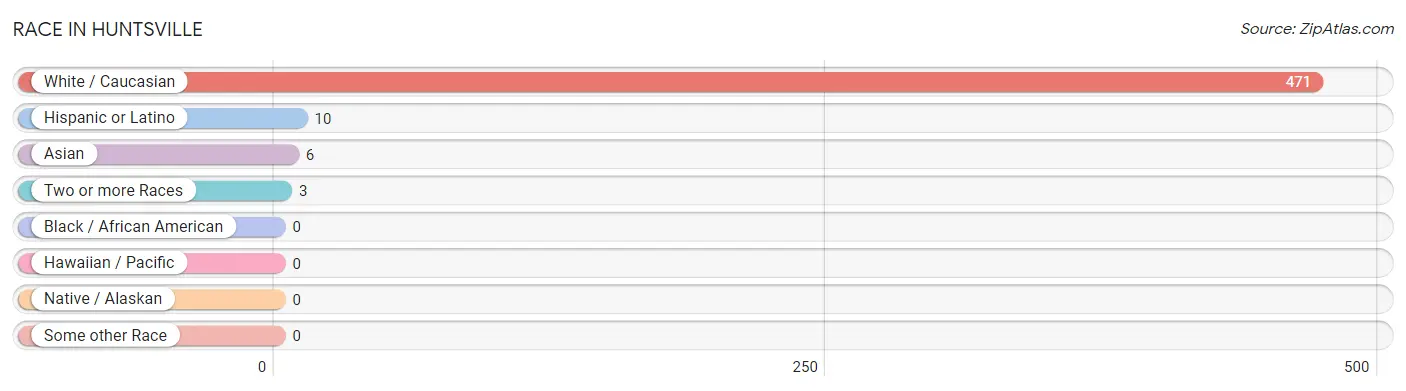
| Race | # Population | % Population |
| Asian | 6 | 1.3% |
| Black / African American | 0 | 0.0% |
| Hawaiian / Pacific | 0 | 0.0% |
| Hispanic or Latino | 10 | 2.1% |
| Native / Alaskan | 0 | 0.0% |
| White / Caucasian | 471 | 98.1% |
| Two or more Races | 3 | 0.6% |
| Some other Race | 0 | 0.0% |
| Total | 480 | 100.0% |
Ancestry in Huntsville
The most populous ancestries reported in Huntsville are English (134 | 27.9%), Danish (63 | 13.1%), Scottish (54 | 11.3%), American (34 | 7.1%), and German (30 | 6.2%), together accounting for 65.6% of all Huntsville residents.
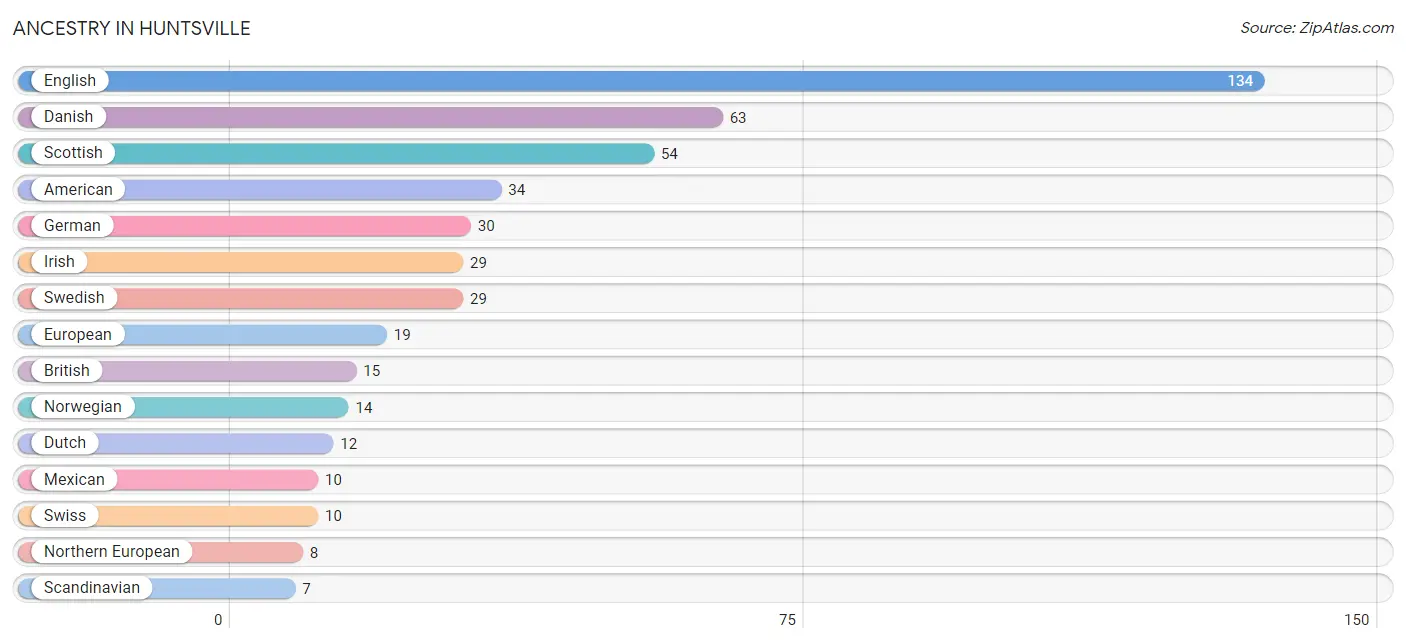
| Ancestry | # Population | % Population |
| American | 34 | 7.1% |
| Austrian | 2 | 0.4% |
| Basque | 1 | 0.2% |
| British | 15 | 3.1% |
| Canadian | 1 | 0.2% |
| Croatian | 2 | 0.4% |
| Danish | 63 | 13.1% |
| Dutch | 12 | 2.5% |
| English | 134 | 27.9% |
| European | 19 | 4.0% |
| French | 2 | 0.4% |
| French Canadian | 3 | 0.6% |
| German | 30 | 6.2% |
| Indian (Asian) | 2 | 0.4% |
| Irish | 29 | 6.0% |
| Italian | 4 | 0.8% |
| Korean | 4 | 0.8% |
| Mexican | 10 | 2.1% |
| Northern European | 8 | 1.7% |
| Norwegian | 14 | 2.9% |
| Russian | 4 | 0.8% |
| Scandinavian | 7 | 1.5% |
| Scotch-Irish | 4 | 0.8% |
| Scottish | 54 | 11.3% |
| Swedish | 29 | 6.0% |
| Swiss | 10 | 2.1% | View All 26 Rows |
Immigrants in Huntsville
The most numerous immigrant groups reported in Huntsville came from Asia (6 | 1.3%), Philippines (4 | 0.8%), South Eastern Asia (4 | 0.8%), China (2 | 0.4%), and Eastern Asia (2 | 0.4%), together accounting for 3.8% of all Huntsville residents.
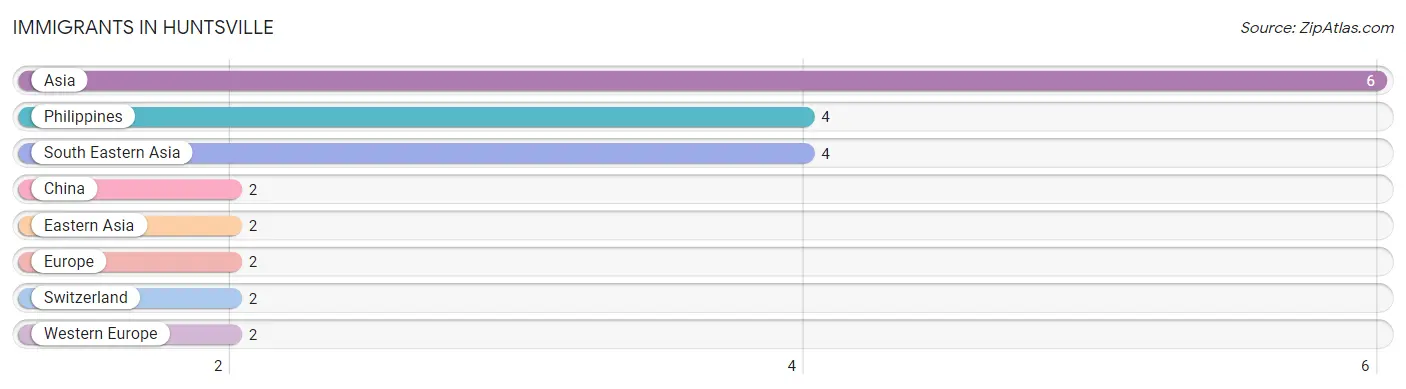
| Immigration Origin | # Population | % Population |
| Asia | 6 | 1.3% |
| China | 2 | 0.4% |
| Eastern Asia | 2 | 0.4% |
| Europe | 2 | 0.4% |
| Philippines | 4 | 0.8% |
| South Eastern Asia | 4 | 0.8% |
| Switzerland | 2 | 0.4% |
| Western Europe | 2 | 0.4% | View All 8 Rows |
Sex and Age in Huntsville
Sex and Age in Huntsville
The most populous age groups in Huntsville are 60 to 64 Years (67 | 25.5%) for men and 60 to 64 Years (40 | 18.4%) for women.
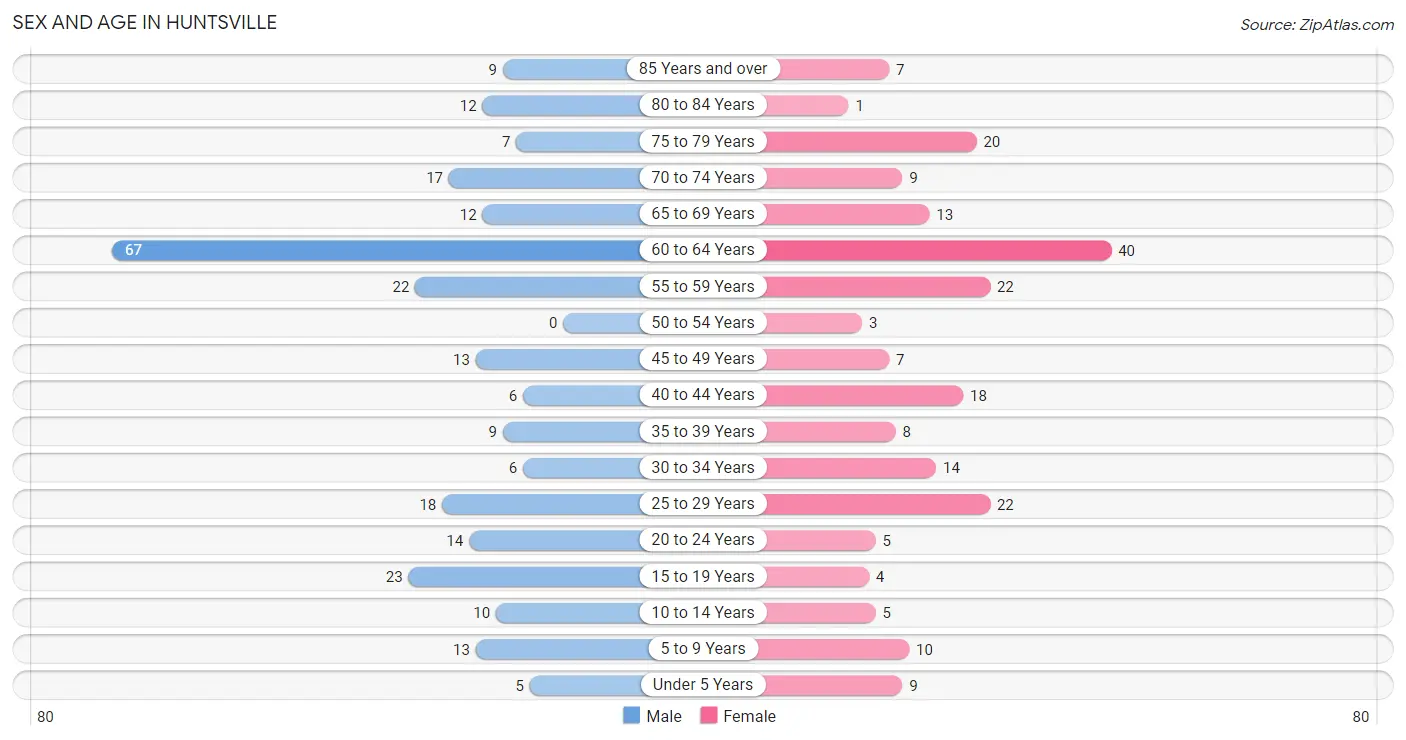
| Age Bracket | Male | Female |
| Under 5 Years | 5 (1.9%) | 9 (4.2%) |
| 5 to 9 Years | 13 (4.9%) | 10 (4.6%) |
| 10 to 14 Years | 10 (3.8%) | 5 (2.3%) |
| 15 to 19 Years | 23 (8.7%) | 4 (1.8%) |
| 20 to 24 Years | 14 (5.3%) | 5 (2.3%) |
| 25 to 29 Years | 18 (6.8%) | 22 (10.1%) |
| 30 to 34 Years | 6 (2.3%) | 14 (6.5%) |
| 35 to 39 Years | 9 (3.4%) | 8 (3.7%) |
| 40 to 44 Years | 6 (2.3%) | 18 (8.3%) |
| 45 to 49 Years | 13 (4.9%) | 7 (3.2%) |
| 50 to 54 Years | 0 (0.0%) | 3 (1.4%) |
| 55 to 59 Years | 22 (8.4%) | 22 (10.1%) |
| 60 to 64 Years | 67 (25.5%) | 40 (18.4%) |
| 65 to 69 Years | 12 (4.6%) | 13 (6.0%) |
| 70 to 74 Years | 17 (6.5%) | 9 (4.2%) |
| 75 to 79 Years | 7 (2.7%) | 20 (9.2%) |
| 80 to 84 Years | 12 (4.6%) | 1 (0.5%) |
| 85 Years and over | 9 (3.4%) | 7 (3.2%) |
| Total | 263 (100.0%) | 217 (100.0%) |
Families and Households in Huntsville
Median Family Size in Huntsville
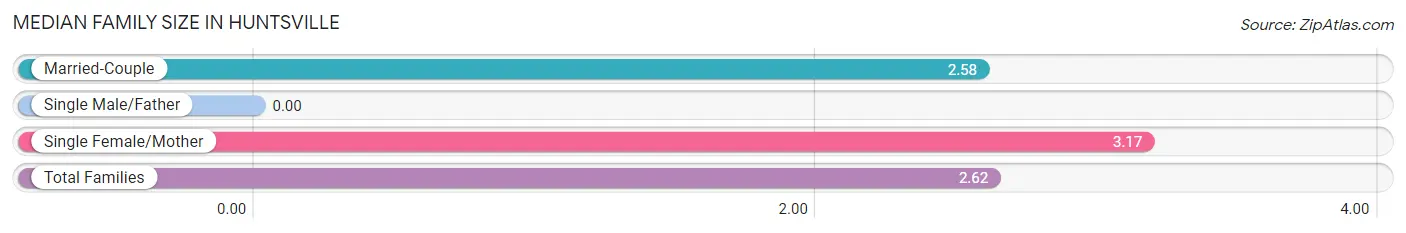
| Family Type | # Families | Family Size |
| Married-Couple | 159 (93.0%) | 2.58 |
| Single Male/Father | 0 (0.0%) | - |
| Single Female/Mother | 12 (7.0%) | 3.17 |
| Total Families | 171 (100.0%) | 2.62 |
Median Household Size in Huntsville
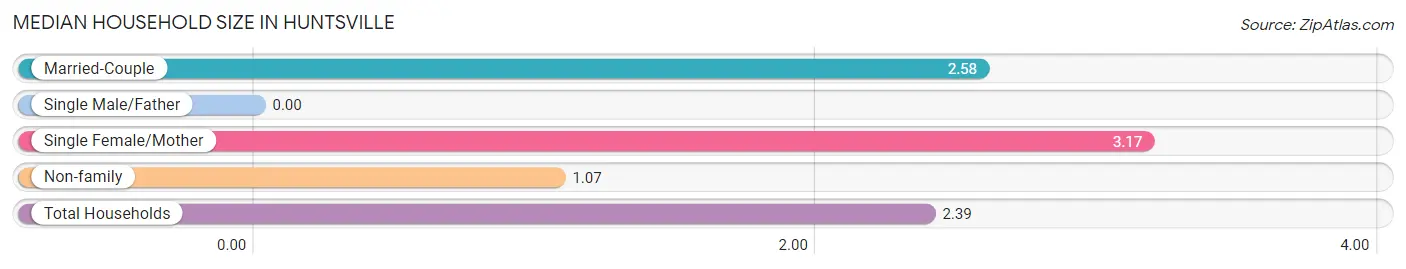
| Household Type | # Households | Household Size |
| Married-Couple | 159 (79.1%) | 2.58 |
| Single Male/Father | 0 (0.0%) | - |
| Single Female/Mother | 12 (6.0%) | 3.17 |
| Non-family | 30 (14.9%) | 1.07 |
| Total Households | 201 (100.0%) | 2.39 |
Household Size by Marriage Status in Huntsville
Out of a total of 201 households in Huntsville, 171 (85.1%) are family households, while 30 (14.9%) are nonfamily households. The most numerous type of family households are 2-person households, comprising 109, and the most common type of nonfamily households are 1-person households, comprising 28.
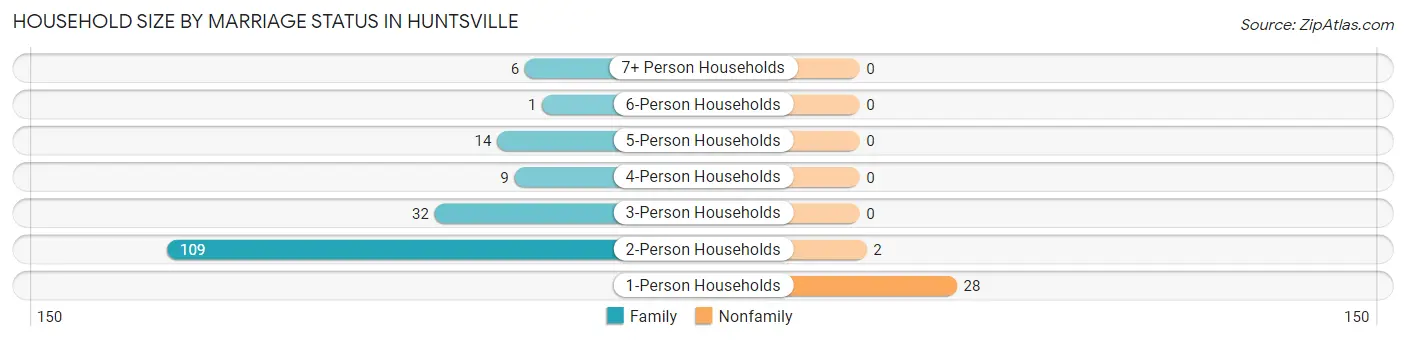
| Household Size | Family Households | Nonfamily Households |
| 1-Person Households | - | 28 (13.9%) |
| 2-Person Households | 109 (54.2%) | 2 (1.0%) |
| 3-Person Households | 32 (15.9%) | 0 (0.0%) |
| 4-Person Households | 9 (4.5%) | 0 (0.0%) |
| 5-Person Households | 14 (7.0%) | 0 (0.0%) |
| 6-Person Households | 1 (0.5%) | 0 (0.0%) |
| 7+ Person Households | 6 (3.0%) | 0 (0.0%) |
| Total | 171 (85.1%) | 30 (14.9%) |
Female Fertility in Huntsville
Fertility by Age in Huntsville
Average fertility rate in Huntsville is 25.0 births per 1,000 women. Women in the age bracket of 20 to 34 years have the highest fertility rate with 49.0 births per 1,000 women. Women in the age bracket of 20 to 34 years acount for 100.0% of all women with births.
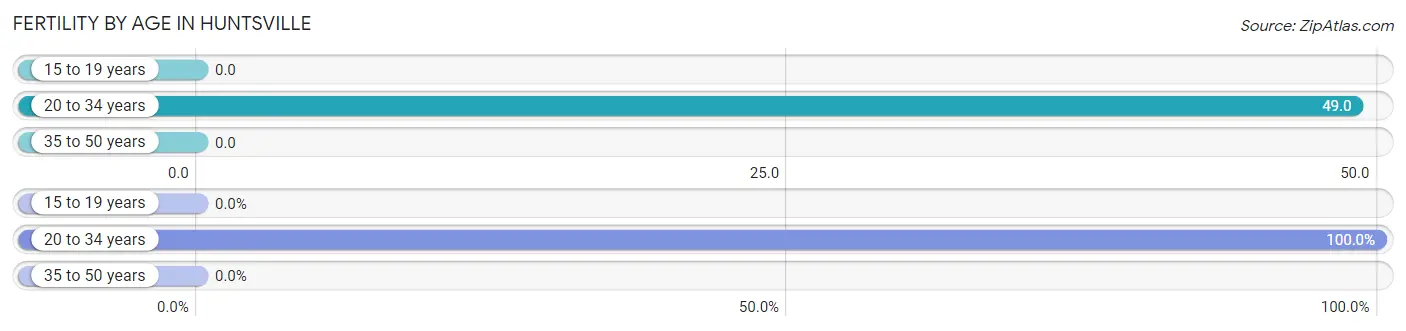
| Age Bracket | Women with Births | Births / 1,000 Women |
| 15 to 19 years | 0 (0.0%) | 0.0 |
| 20 to 34 years | 2 (100.0%) | 49.0 |
| 35 to 50 years | 0 (0.0%) | 0.0 |
| Total | 2 (100.0%) | 25.0 |
Fertility by Age by Marriage Status in Huntsville
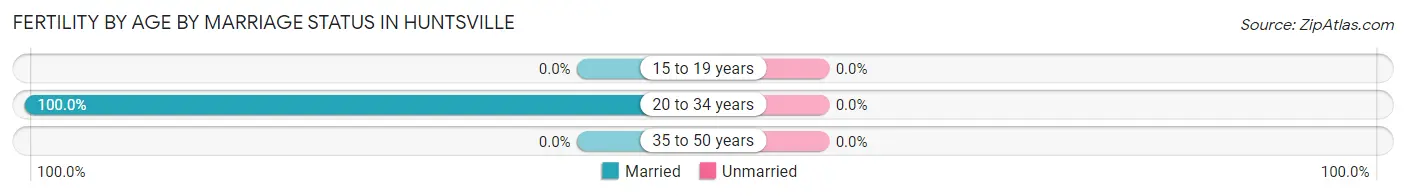
| Age Bracket | Married | Unmarried |
| 15 to 19 years | 0 (0.0%) | 0 (0.0%) |
| 20 to 34 years | 2 (100.0%) | 0 (0.0%) |
| 35 to 50 years | 0 (0.0%) | 0 (0.0%) |
| Total | 2 (100.0%) | 0 (0.0%) |
Fertility by Education in Huntsville
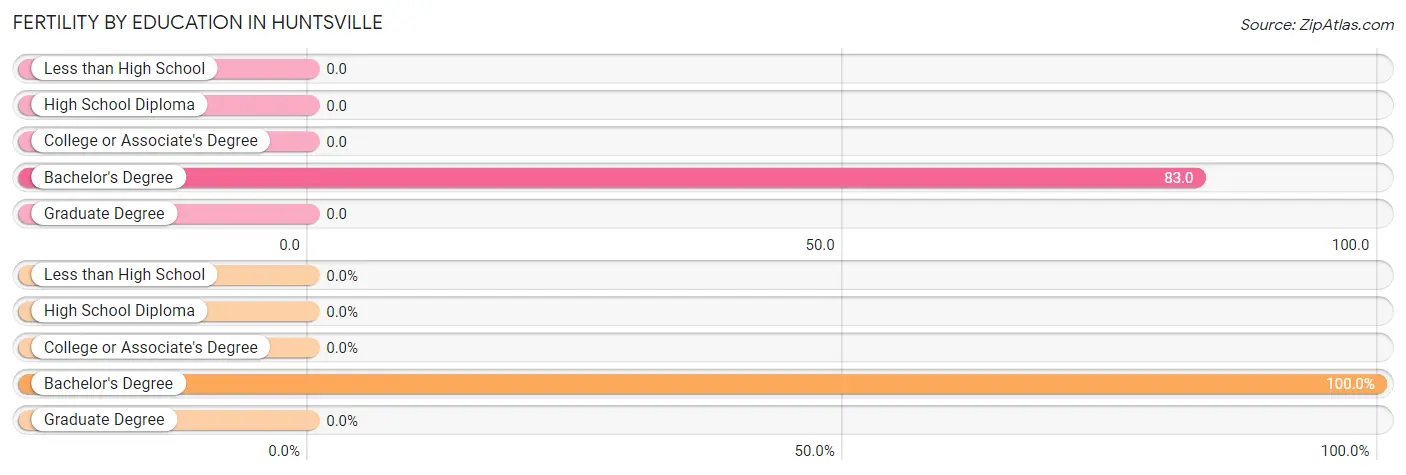
| Educational Attainment | Women with Births | Births / 1,000 Women |
| Less than High School | 0 (0.0%) | 0.0 |
| High School Diploma | 0 (0.0%) | 0.0 |
| College or Associate's Degree | 0 (0.0%) | 0.0 |
| Bachelor's Degree | 2 (100.0%) | 83.0 |
| Graduate Degree | 0 (0.0%) | 0.0 |
| Total | 2 (100.0%) | 25.0 |
Fertility by Education by Marriage Status in Huntsville
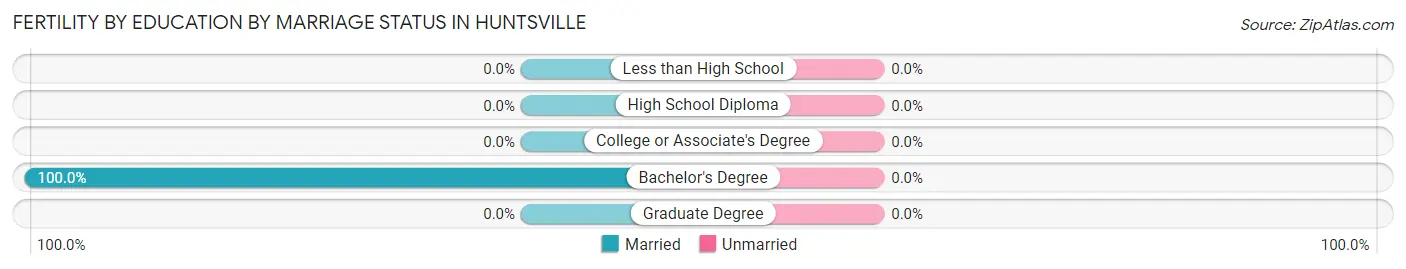
| Educational Attainment | Married | Unmarried |
| Less than High School | 0 (0.0%) | 0 (0.0%) |
| High School Diploma | 0 (0.0%) | 0 (0.0%) |
| College or Associate's Degree | 0 (0.0%) | 0 (0.0%) |
| Bachelor's Degree | 2 (100.0%) | 0 (0.0%) |
| Graduate Degree | 0 (0.0%) | 0 (0.0%) |
| Total | 2 (100.0%) | 0 (0.0%) |
Employment Characteristics in Huntsville
Employment by Class of Employer in Huntsville
Among the 227 employed individuals in Huntsville, private company employees (127 | 55.9%), self-employed (not incorporated) (42 | 18.5%), and local government employees (18 | 7.9%) make up the most common classes of employment.
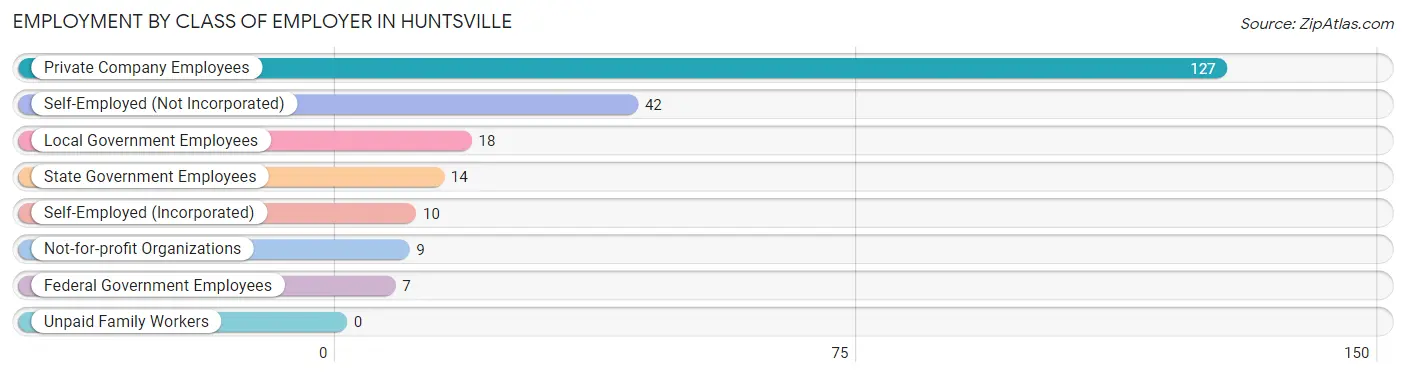
| Employer Class | # Employees | % Employees |
| Private Company Employees | 127 | 55.9% |
| Self-Employed (Incorporated) | 10 | 4.4% |
| Self-Employed (Not Incorporated) | 42 | 18.5% |
| Not-for-profit Organizations | 9 | 4.0% |
| Local Government Employees | 18 | 7.9% |
| State Government Employees | 14 | 6.2% |
| Federal Government Employees | 7 | 3.1% |
| Unpaid Family Workers | 0 | 0.0% |
| Total | 227 | 100.0% |
Employment Status by Age in Huntsville
According to the labor force statistics for Huntsville, out of the total population over 16 years of age (421), 56.8% or 239 individuals are in the labor force, with 5.0% or 12 of them unemployed. The age group with the highest labor force participation rate is 35 to 44 years, with 95.1% or 39 individuals in the labor force. Within the labor force, the 16 to 19 years age range has the highest percentage of unemployed individuals, with 66.7% or 6 of them being unemployed.
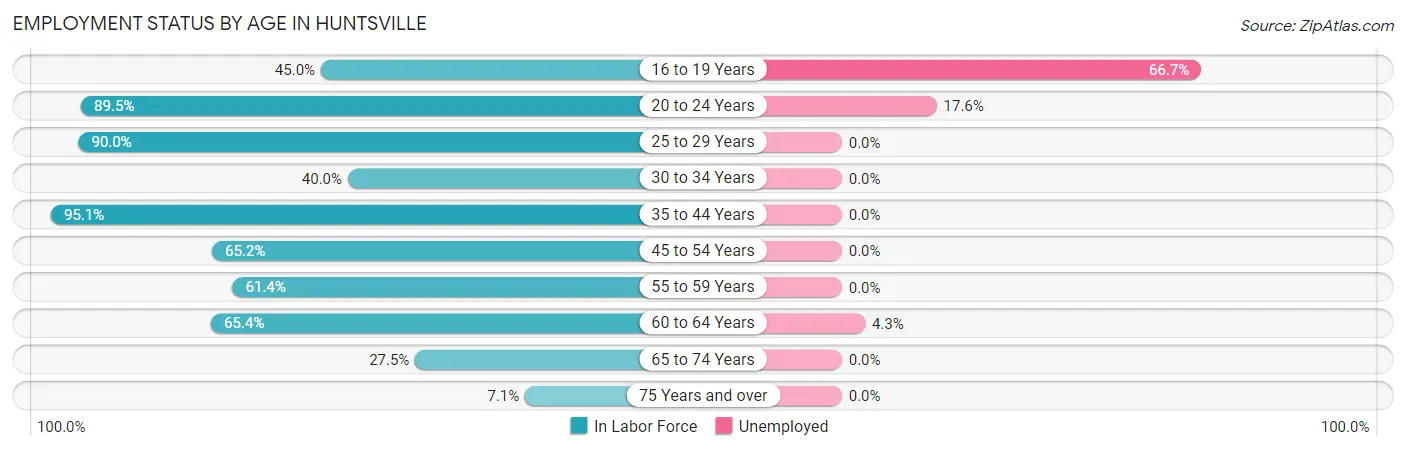
| Age Bracket | In Labor Force | Unemployed |
| 16 to 19 Years | 9 (45.0%) | 6 (66.7%) |
| 20 to 24 Years | 17 (89.5%) | 3 (17.6%) |
| 25 to 29 Years | 36 (90.0%) | 0 (0.0%) |
| 30 to 34 Years | 8 (40.0%) | 0 (0.0%) |
| 35 to 44 Years | 39 (95.1%) | 0 (0.0%) |
| 45 to 54 Years | 15 (65.2%) | 0 (0.0%) |
| 55 to 59 Years | 27 (61.4%) | 0 (0.0%) |
| 60 to 64 Years | 70 (65.4%) | 3 (4.3%) |
| 65 to 74 Years | 14 (27.5%) | 0 (0.0%) |
| 75 Years and over | 4 (7.1%) | 0 (0.0%) |
| Total | 239 (56.8%) | 12 (5.0%) |
Employment Status by Educational Attainment in Huntsville
According to labor force statistics for Huntsville, 70.9% of individuals (195) out of the total population between 25 and 64 years of age (275) are in the labor force, with 1.5% or 3 of them being unemployed. The group with the highest labor force participation rate are those with the educational attainment of college / associate degree, with 80.6% or 108 individuals in the labor force. Within the labor force, individuals with bachelor's degree or higher education have the highest percentage of unemployment, with 3.1% or 2 of them being unemployed.
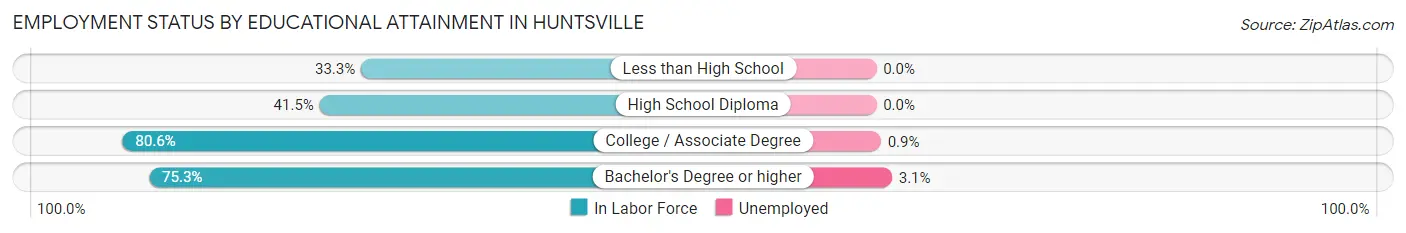
| Educational Attainment | In Labor Force | Unemployed |
| Less than High School | 1 (33.3%) | 0 (0.0%) |
| High School Diploma | 22 (41.5%) | 0 (0.0%) |
| College / Associate Degree | 108 (80.6%) | 1 (0.9%) |
| Bachelor's Degree or higher | 64 (75.3%) | 3 (3.1%) |
| Total | 195 (70.9%) | 4 (1.5%) |
Employment Occupations by Sex in Huntsville
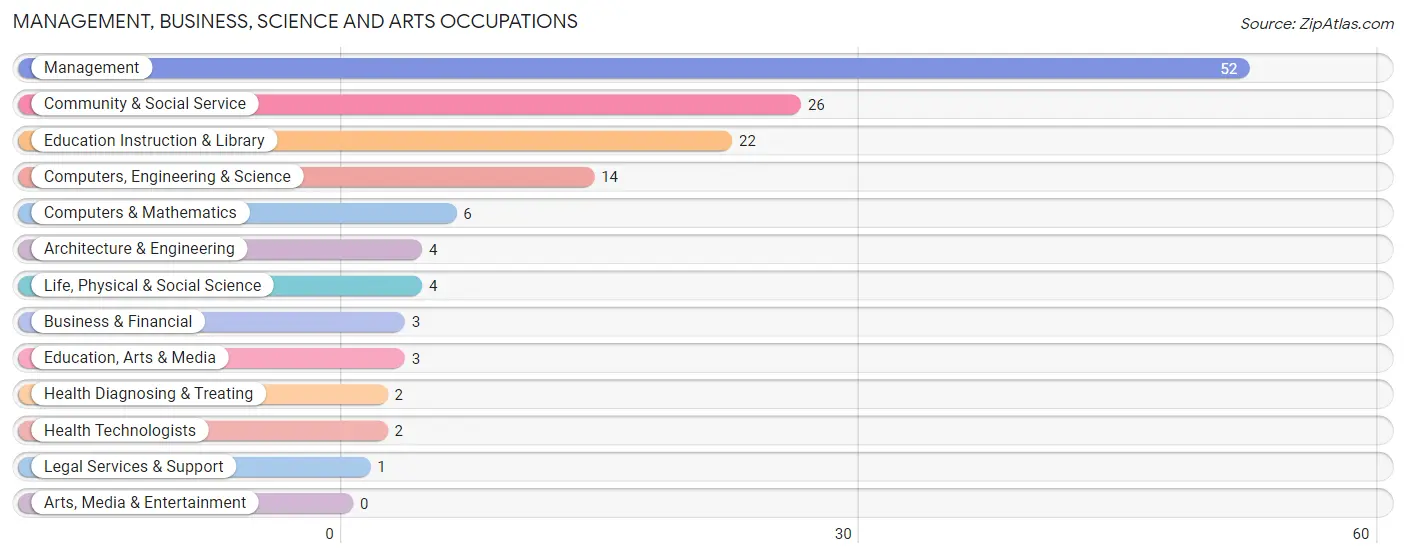
Management, Business, Science and Arts Occupations
The most common Management, Business, Science and Arts occupations in Huntsville are Management (52 | 22.9%), Community & Social Service (26 | 11.5%), Education Instruction & Library (22 | 9.7%), Computers, Engineering & Science (14 | 6.2%), and Computers & Mathematics (6 | 2.6%).
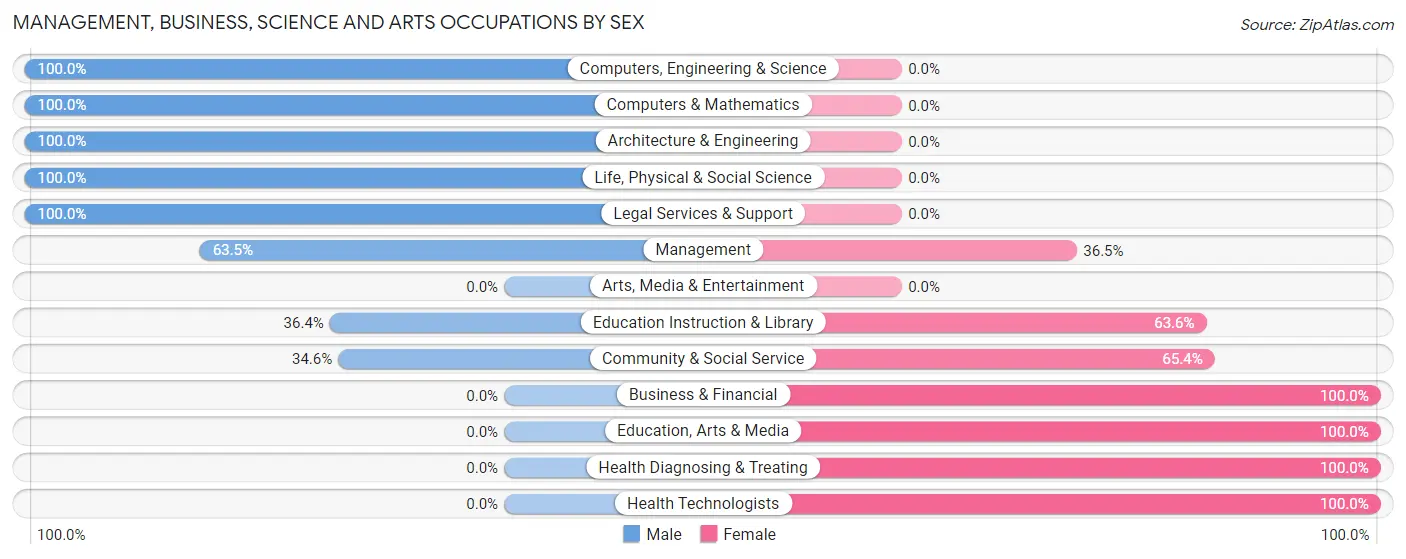
Management, Business, Science and Arts Occupations by Sex
Within the Management, Business, Science and Arts occupations in Huntsville, the most male-oriented occupations are Computers, Engineering & Science (100.0%), Computers & Mathematics (100.0%), and Architecture & Engineering (100.0%), while the most female-oriented occupations are Business & Financial (100.0%), Education, Arts & Media (100.0%), and Health Diagnosing & Treating (100.0%).
| Occupation | Male | Female |
| Management | 33 (63.5%) | 19 (36.5%) |
| Business & Financial | 0 (0.0%) | 3 (100.0%) |
| Computers, Engineering & Science | 14 (100.0%) | 0 (0.0%) |
| Computers & Mathematics | 6 (100.0%) | 0 (0.0%) |
| Architecture & Engineering | 4 (100.0%) | 0 (0.0%) |
| Life, Physical & Social Science | 4 (100.0%) | 0 (0.0%) |
| Community & Social Service | 9 (34.6%) | 17 (65.4%) |
| Education, Arts & Media | 0 (0.0%) | 3 (100.0%) |
| Legal Services & Support | 1 (100.0%) | 0 (0.0%) |
| Education Instruction & Library | 8 (36.4%) | 14 (63.6%) |
| Arts, Media & Entertainment | 0 (0.0%) | 0 (0.0%) |
| Health Diagnosing & Treating | 0 (0.0%) | 2 (100.0%) |
| Health Technologists | 0 (0.0%) | 2 (100.0%) |
| Total (Category) | 56 (57.7%) | 41 (42.3%) |
| Total (Overall) | 146 (64.3%) | 81 (35.7%) |
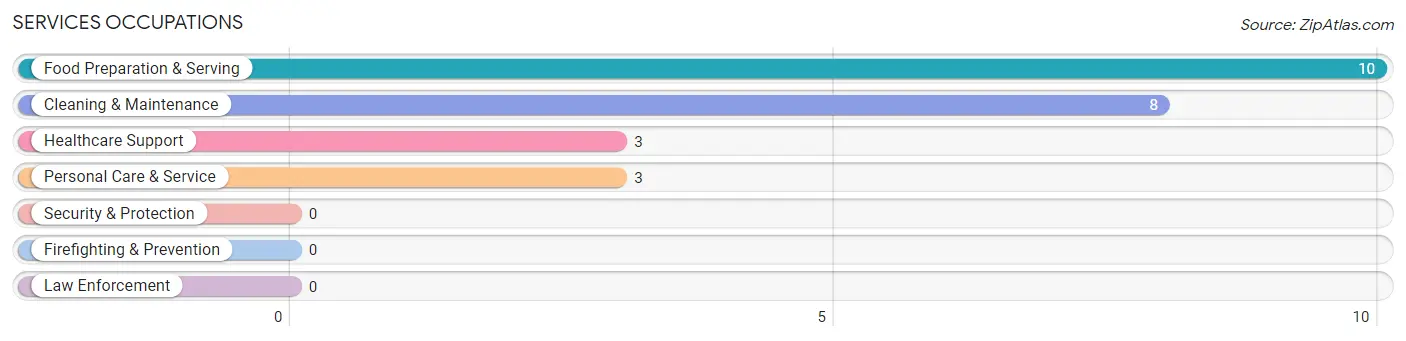
Services Occupations
The most common Services occupations in Huntsville are Food Preparation & Serving (10 | 4.4%), Cleaning & Maintenance (8 | 3.5%), Healthcare Support (3 | 1.3%), and Personal Care & Service (3 | 1.3%).
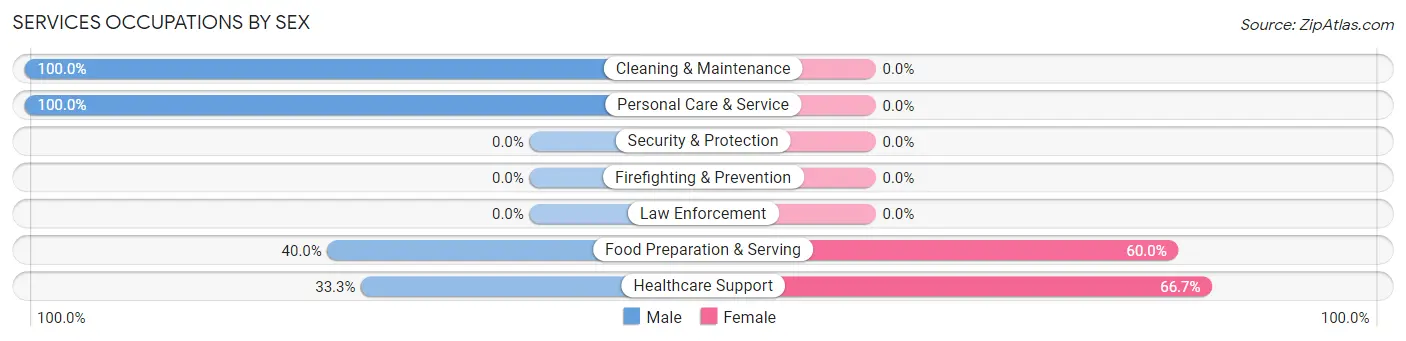
Services Occupations by Sex
Within the Services occupations in Huntsville, the most male-oriented occupations are Cleaning & Maintenance (100.0%), Personal Care & Service (100.0%), and Food Preparation & Serving (40.0%), while the most female-oriented occupations are Healthcare Support (66.7%), and Food Preparation & Serving (60.0%).
| Occupation | Male | Female |
| Healthcare Support | 1 (33.3%) | 2 (66.7%) |
| Security & Protection | 0 (0.0%) | 0 (0.0%) |
| Firefighting & Prevention | 0 (0.0%) | 0 (0.0%) |
| Law Enforcement | 0 (0.0%) | 0 (0.0%) |
| Food Preparation & Serving | 4 (40.0%) | 6 (60.0%) |
| Cleaning & Maintenance | 8 (100.0%) | 0 (0.0%) |
| Personal Care & Service | 3 (100.0%) | 0 (0.0%) |
| Total (Category) | 16 (66.7%) | 8 (33.3%) |
| Total (Overall) | 146 (64.3%) | 81 (35.7%) |
Sales and Office Occupations
The most common Sales and Office occupations in Huntsville are Office & Administration (27 | 11.9%), and Sales & Related (23 | 10.1%).
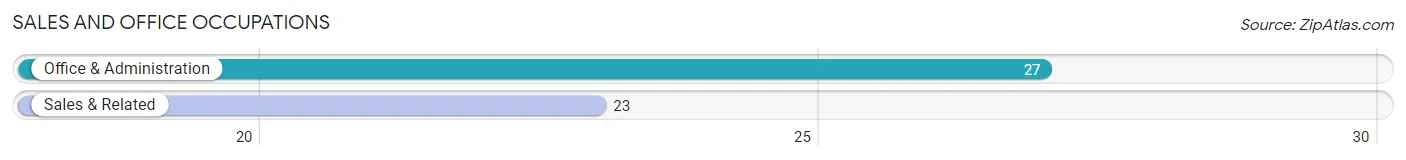
Sales and Office Occupations by Sex
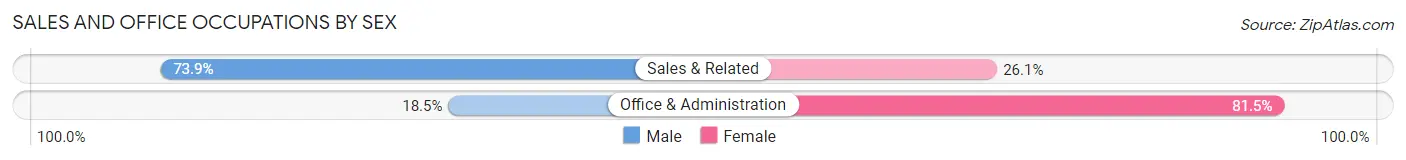
| Occupation | Male | Female |
| Sales & Related | 17 (73.9%) | 6 (26.1%) |
| Office & Administration | 5 (18.5%) | 22 (81.5%) |
| Total (Category) | 22 (44.0%) | 28 (56.0%) |
| Total (Overall) | 146 (64.3%) | 81 (35.7%) |
Natural Resources, Construction and Maintenance Occupations
The most common Natural Resources, Construction and Maintenance occupations in Huntsville are Installation, Maintenance & Repair (22 | 9.7%), and Construction & Extraction (10 | 4.4%).
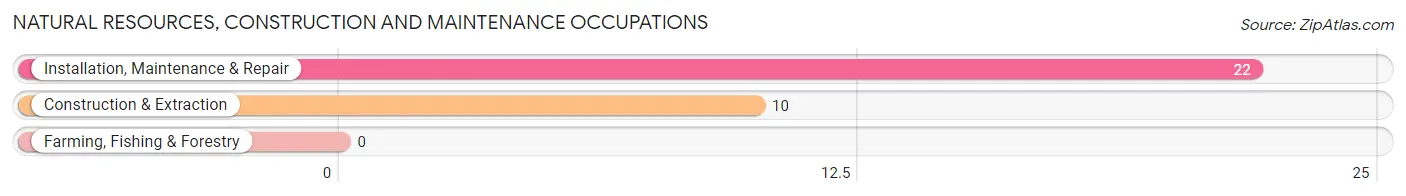
Natural Resources, Construction and Maintenance Occupations by Sex
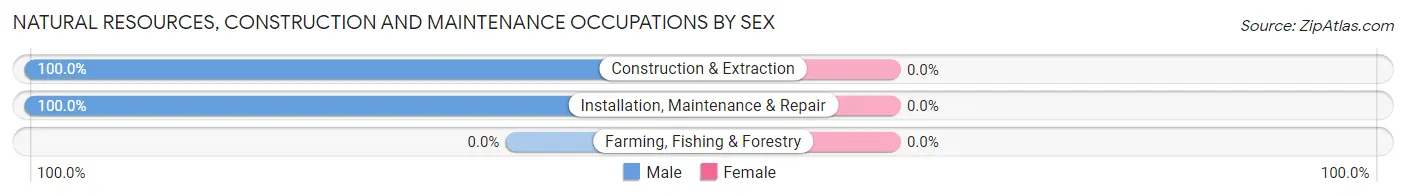
| Occupation | Male | Female |
| Farming, Fishing & Forestry | 0 (0.0%) | 0 (0.0%) |
| Construction & Extraction | 10 (100.0%) | 0 (0.0%) |
| Installation, Maintenance & Repair | 22 (100.0%) | 0 (0.0%) |
| Total (Category) | 32 (100.0%) | 0 (0.0%) |
| Total (Overall) | 146 (64.3%) | 81 (35.7%) |
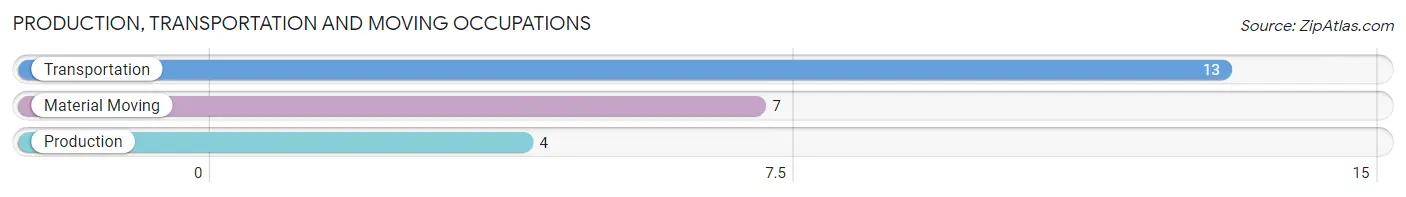
Production, Transportation and Moving Occupations
The most common Production, Transportation and Moving occupations in Huntsville are Transportation (13 | 5.7%), Material Moving (7 | 3.1%), and Production (4 | 1.8%).
Production, Transportation and Moving Occupations by Sex
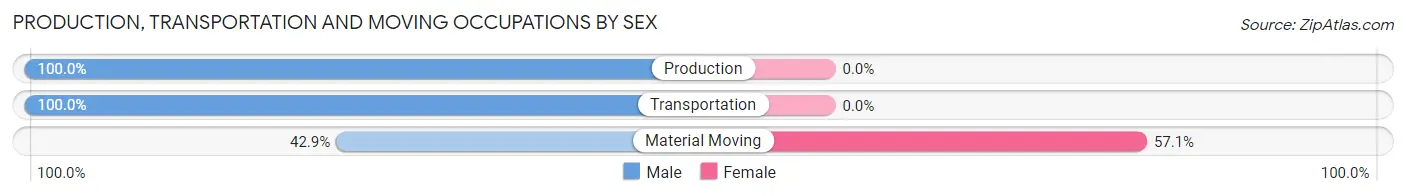
| Occupation | Male | Female |
| Production | 4 (100.0%) | 0 (0.0%) |
| Transportation | 13 (100.0%) | 0 (0.0%) |
| Material Moving | 3 (42.9%) | 4 (57.1%) |
| Total (Category) | 20 (83.3%) | 4 (16.7%) |
| Total (Overall) | 146 (64.3%) | 81 (35.7%) |
Employment Industries by Sex in Huntsville
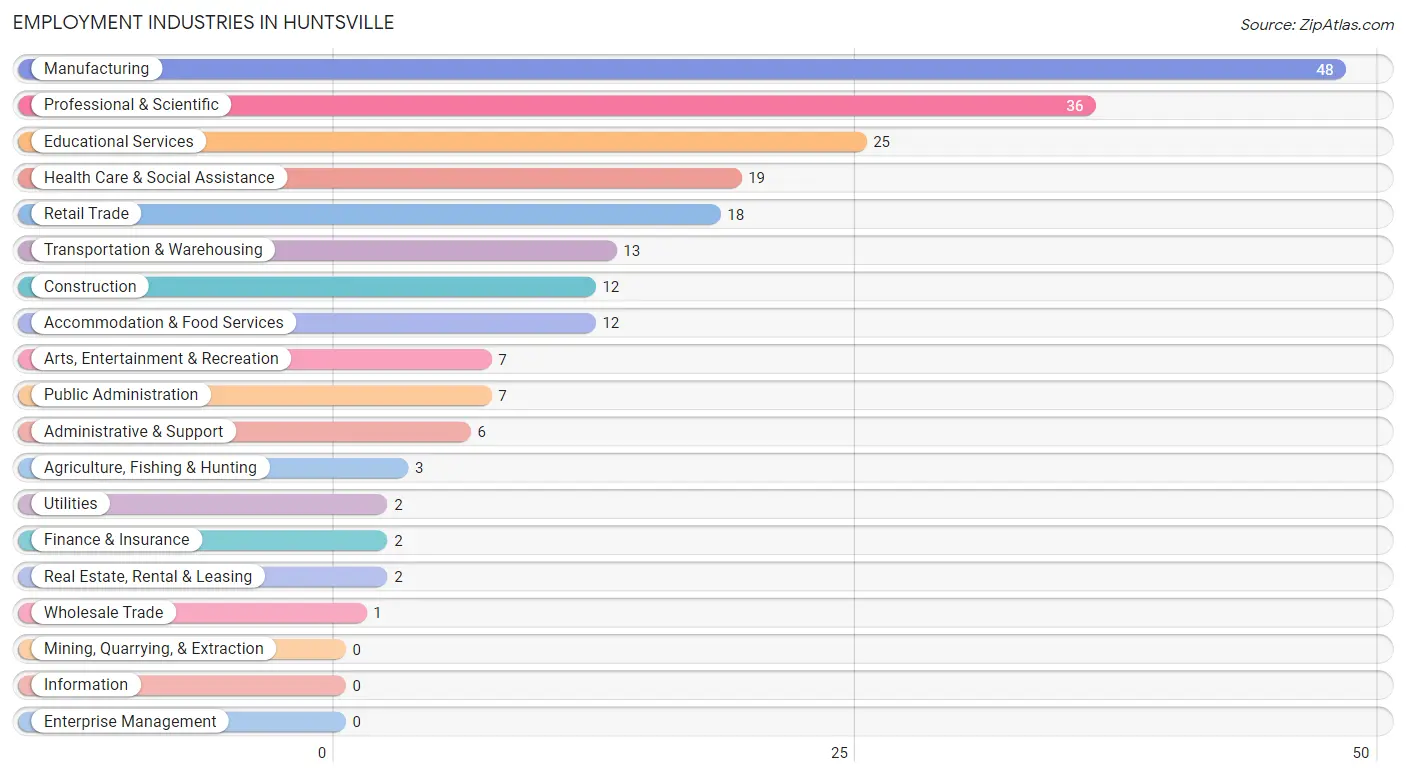
Employment Industries in Huntsville
The major employment industries in Huntsville include Manufacturing (48 | 21.1%), Professional & Scientific (36 | 15.9%), Educational Services (25 | 11.0%), Health Care & Social Assistance (19 | 8.4%), and Retail Trade (18 | 7.9%).
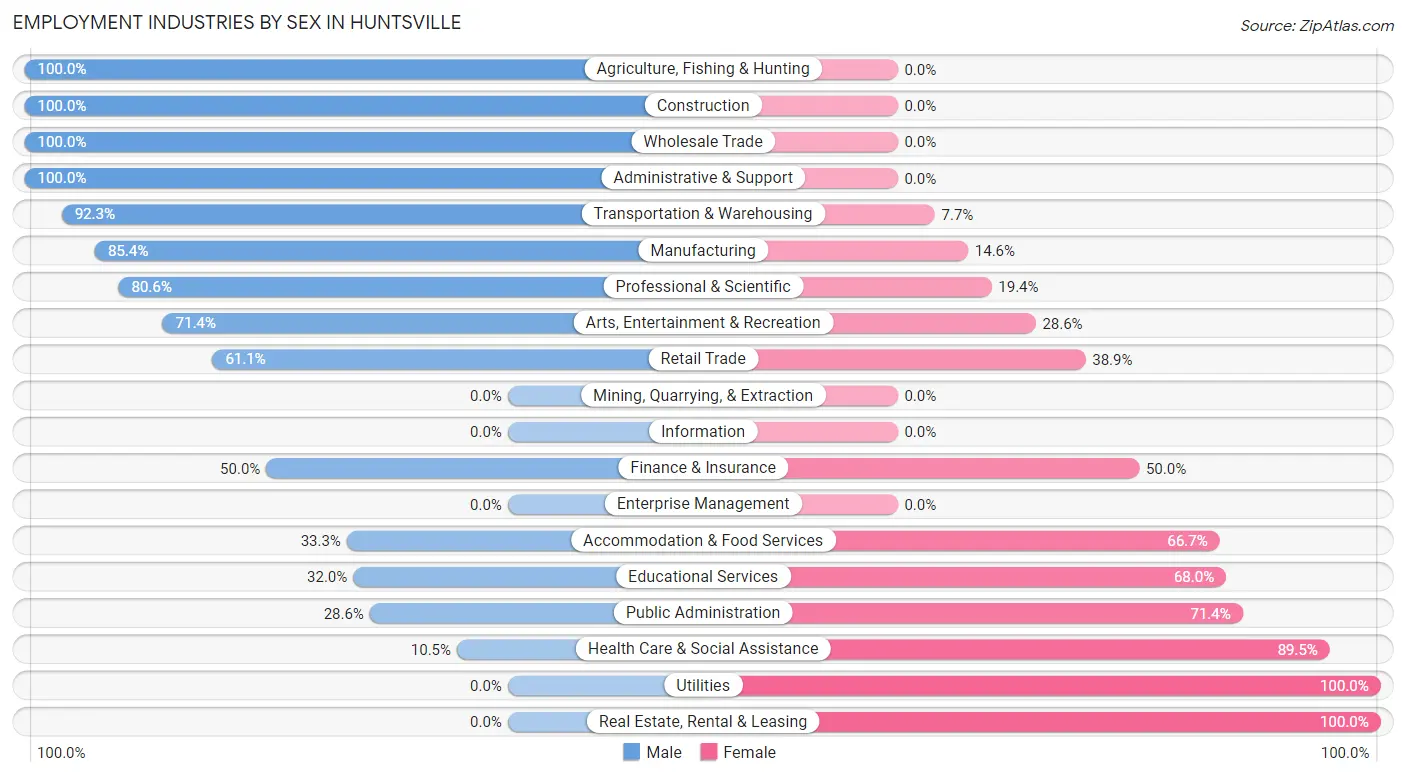
Employment Industries by Sex in Huntsville
The Huntsville industries that see more men than women are Agriculture, Fishing & Hunting (100.0%), Construction (100.0%), and Wholesale Trade (100.0%), whereas the industries that tend to have a higher number of women are Utilities (100.0%), Real Estate, Rental & Leasing (100.0%), and Health Care & Social Assistance (89.5%).
| Industry | Male | Female |
| Agriculture, Fishing & Hunting | 3 (100.0%) | 0 (0.0%) |
| Mining, Quarrying, & Extraction | 0 (0.0%) | 0 (0.0%) |
| Construction | 12 (100.0%) | 0 (0.0%) |
| Manufacturing | 41 (85.4%) | 7 (14.6%) |
| Wholesale Trade | 1 (100.0%) | 0 (0.0%) |
| Retail Trade | 11 (61.1%) | 7 (38.9%) |
| Transportation & Warehousing | 12 (92.3%) | 1 (7.7%) |
| Utilities | 0 (0.0%) | 2 (100.0%) |
| Information | 0 (0.0%) | 0 (0.0%) |
| Finance & Insurance | 1 (50.0%) | 1 (50.0%) |
| Real Estate, Rental & Leasing | 0 (0.0%) | 2 (100.0%) |
| Professional & Scientific | 29 (80.6%) | 7 (19.4%) |
| Enterprise Management | 0 (0.0%) | 0 (0.0%) |
| Administrative & Support | 6 (100.0%) | 0 (0.0%) |
| Educational Services | 8 (32.0%) | 17 (68.0%) |
| Health Care & Social Assistance | 2 (10.5%) | 17 (89.5%) |
| Arts, Entertainment & Recreation | 5 (71.4%) | 2 (28.6%) |
| Accommodation & Food Services | 4 (33.3%) | 8 (66.7%) |
| Public Administration | 2 (28.6%) | 5 (71.4%) |
| Total | 146 (64.3%) | 81 (35.7%) |
Education in Huntsville
School Enrollment in Huntsville
The most common levels of schooling among the 94 students in Huntsville are high school (29 | 30.8%), college / undergraduate (18 | 19.2%), and elementary school (12 | 12.8%).
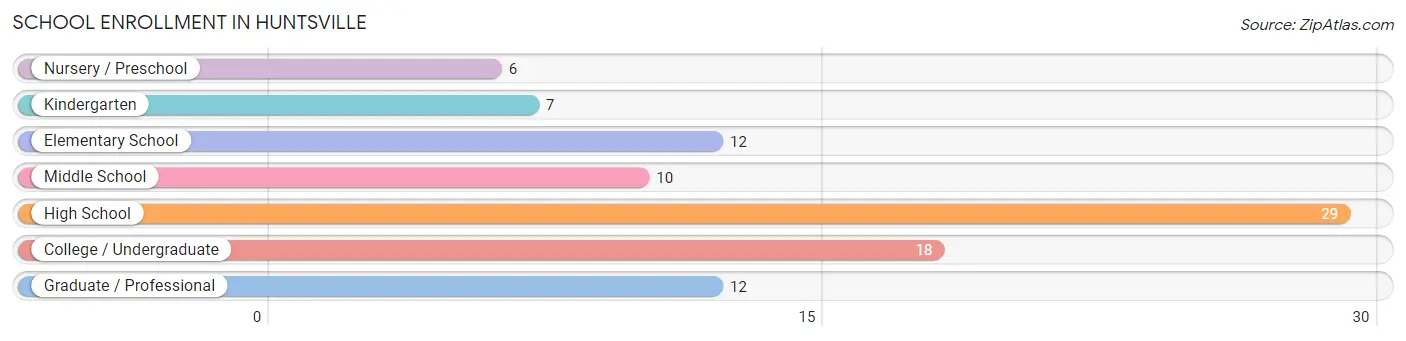
| School Level | # Students | % Students |
| Nursery / Preschool | 6 | 6.4% |
| Kindergarten | 7 | 7.4% |
| Elementary School | 12 | 12.8% |
| Middle School | 10 | 10.6% |
| High School | 29 | 30.8% |
| College / Undergraduate | 18 | 19.2% |
| Graduate / Professional | 12 | 12.8% |
| Total | 94 | 100.0% |
School Enrollment by Age by Funding Source in Huntsville
Out of a total of 94 students who are enrolled in schools in Huntsville, 15 (16.0%) attend a private institution, while the remaining 79 (84.0%) are enrolled in public schools. The age group of 3 to 4 year olds has the highest likelihood of being enrolled in private schools, with 2 (100.0% in the age bracket) enrolled. Conversely, the age group of 10 to 14 year olds has the lowest likelihood of being enrolled in a private school, with 15 (100.0% in the age bracket) attending a public institution.
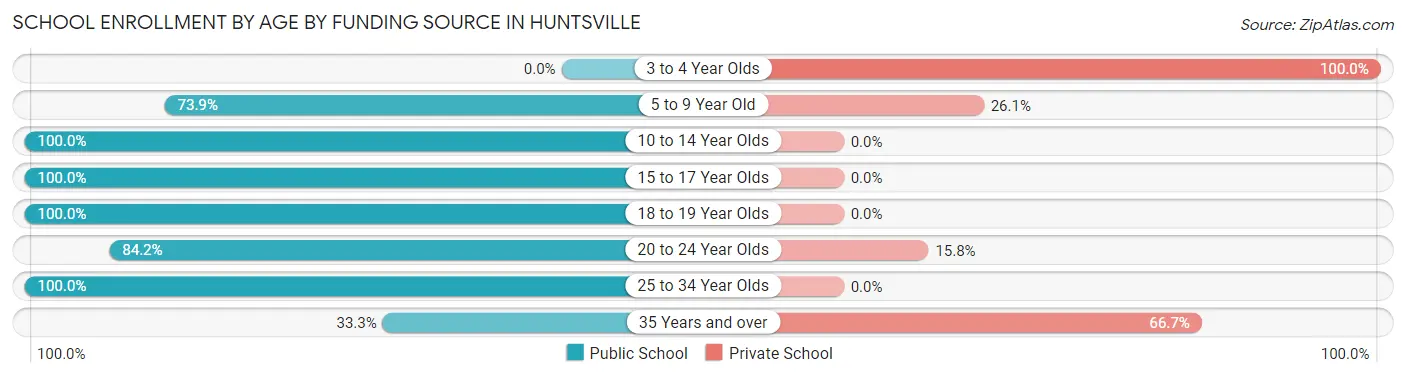
| Age Bracket | Public School | Private School |
| 3 to 4 Year Olds | 0 (0.0%) | 2 (100.0%) |
| 5 to 9 Year Old | 17 (73.9%) | 6 (26.1%) |
| 10 to 14 Year Olds | 15 (100.0%) | 0 (0.0%) |
| 15 to 17 Year Olds | 23 (100.0%) | 0 (0.0%) |
| 18 to 19 Year Olds | 4 (100.0%) | 0 (0.0%) |
| 20 to 24 Year Olds | 16 (84.2%) | 3 (15.8%) |
| 25 to 34 Year Olds | 2 (100.0%) | 0 (0.0%) |
| 35 Years and over | 2 (33.3%) | 4 (66.7%) |
| Total | 79 (84.0%) | 15 (16.0%) |
Educational Attainment by Field of Study in Huntsville
Education (25 | 21.5%), social sciences (16 | 13.8%), literature & languages (14 | 12.1%), arts & humanities (12 | 10.3%), and science & technology (10 | 8.6%) are the most common fields of study among 116 individuals in Huntsville who have obtained a bachelor's degree or higher.
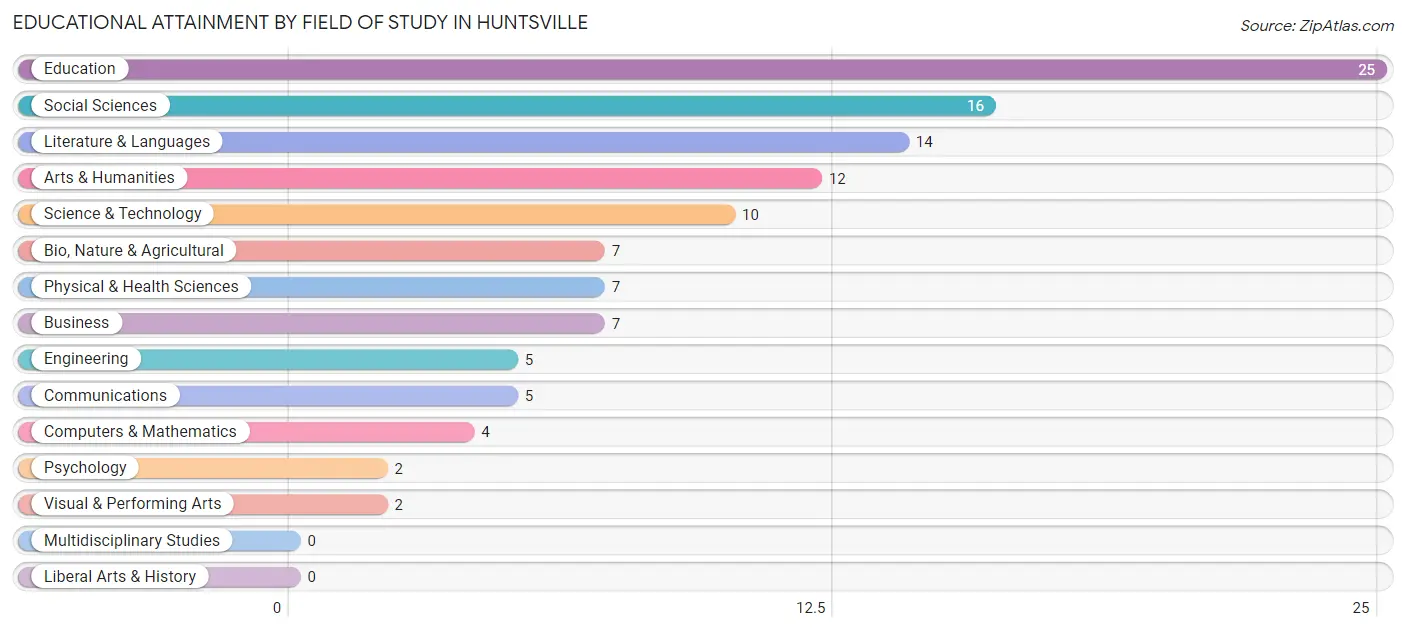
| Field of Study | # Graduates | % Graduates |
| Computers & Mathematics | 4 | 3.5% |
| Bio, Nature & Agricultural | 7 | 6.0% |
| Physical & Health Sciences | 7 | 6.0% |
| Psychology | 2 | 1.7% |
| Social Sciences | 16 | 13.8% |
| Engineering | 5 | 4.3% |
| Multidisciplinary Studies | 0 | 0.0% |
| Science & Technology | 10 | 8.6% |
| Business | 7 | 6.0% |
| Education | 25 | 21.5% |
| Literature & Languages | 14 | 12.1% |
| Liberal Arts & History | 0 | 0.0% |
| Visual & Performing Arts | 2 | 1.7% |
| Communications | 5 | 4.3% |
| Arts & Humanities | 12 | 10.3% |
| Total | 116 | 100.0% |
Transportation & Commute in Huntsville
Vehicle Availability by Sex in Huntsville
The most prevalent vehicle ownership categories in Huntsville are males with 4 vehicles (49, accounting for 33.6%) and females with 4 vehicles (18, making up 60.5%).
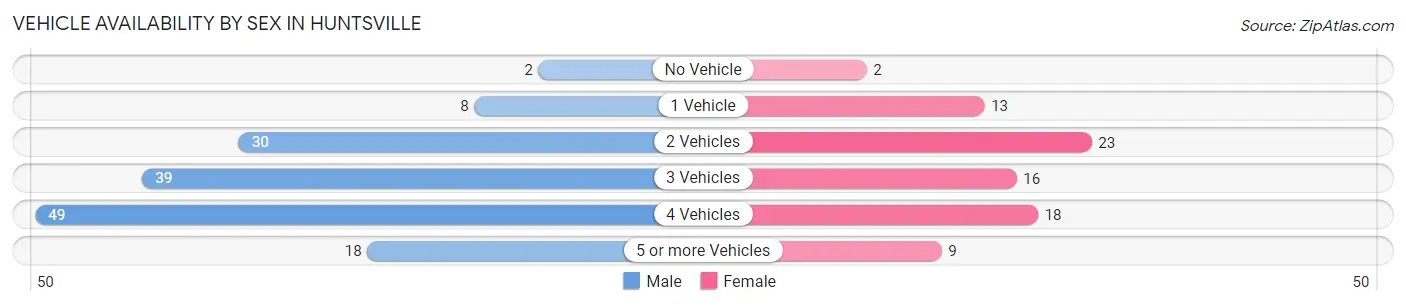
| Vehicles Available | Male | Female |
| No Vehicle | 2 (1.4%) | 2 (2.5%) |
| 1 Vehicle | 8 (5.5%) | 13 (16.1%) |
| 2 Vehicles | 30 (20.5%) | 23 (28.4%) |
| 3 Vehicles | 39 (26.7%) | 16 (19.8%) |
| 4 Vehicles | 49 (33.6%) | 18 (22.2%) |
| 5 or more Vehicles | 18 (12.3%) | 9 (11.1%) |
| Total | 146 (100.0%) | 81 (100.0%) |
Commute Time in Huntsville
The most frequently occuring commute durations in Huntsville are 15 to 19 minutes (44 commuters, 22.8%), 25 to 29 minutes (28 commuters, 14.5%), and 35 to 39 minutes (24 commuters, 12.4%).
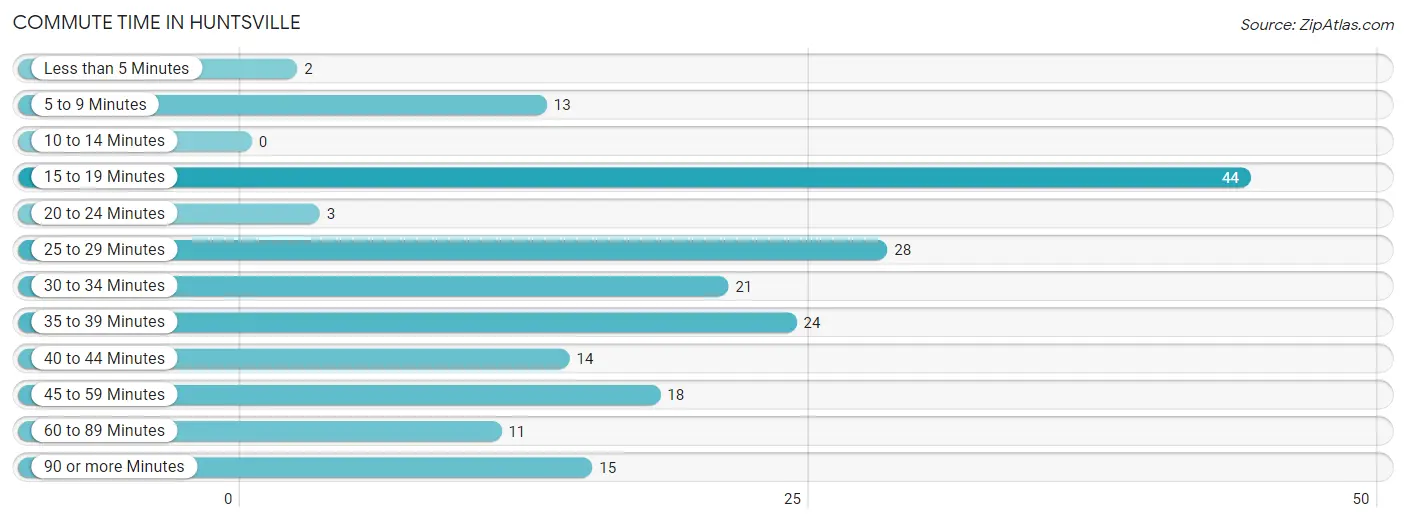
| Commute Time | # Commuters | % Commuters |
| Less than 5 Minutes | 2 | 1.0% |
| 5 to 9 Minutes | 13 | 6.7% |
| 10 to 14 Minutes | 0 | 0.0% |
| 15 to 19 Minutes | 44 | 22.8% |
| 20 to 24 Minutes | 3 | 1.5% |
| 25 to 29 Minutes | 28 | 14.5% |
| 30 to 34 Minutes | 21 | 10.9% |
| 35 to 39 Minutes | 24 | 12.4% |
| 40 to 44 Minutes | 14 | 7.2% |
| 45 to 59 Minutes | 18 | 9.3% |
| 60 to 89 Minutes | 11 | 5.7% |
| 90 or more Minutes | 15 | 7.8% |
Commute Time by Sex in Huntsville
The most common commute times in Huntsville are 15 to 19 minutes (28 commuters, 23.7%) for males and 15 to 19 minutes (16 commuters, 21.3%) for females.
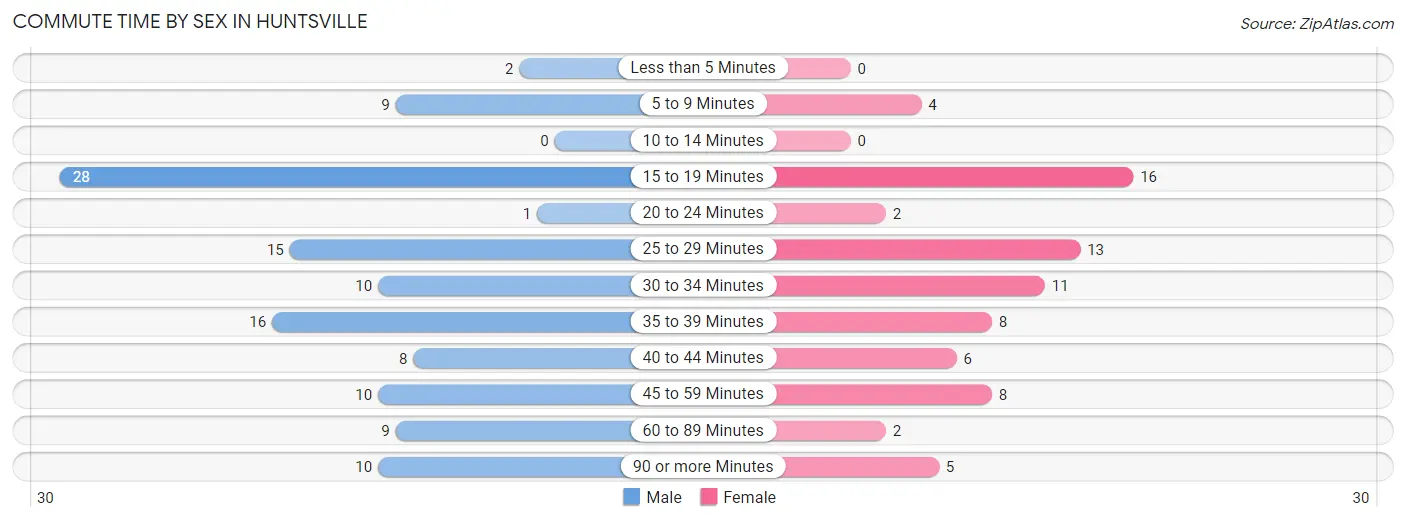
| Commute Time | Male | Female |
| Less than 5 Minutes | 2 (1.7%) | 0 (0.0%) |
| 5 to 9 Minutes | 9 (7.6%) | 4 (5.3%) |
| 10 to 14 Minutes | 0 (0.0%) | 0 (0.0%) |
| 15 to 19 Minutes | 28 (23.7%) | 16 (21.3%) |
| 20 to 24 Minutes | 1 (0.9%) | 2 (2.7%) |
| 25 to 29 Minutes | 15 (12.7%) | 13 (17.3%) |
| 30 to 34 Minutes | 10 (8.5%) | 11 (14.7%) |
| 35 to 39 Minutes | 16 (13.6%) | 8 (10.7%) |
| 40 to 44 Minutes | 8 (6.8%) | 6 (8.0%) |
| 45 to 59 Minutes | 10 (8.5%) | 8 (10.7%) |
| 60 to 89 Minutes | 9 (7.6%) | 2 (2.7%) |
| 90 or more Minutes | 10 (8.5%) | 5 (6.7%) |
Time of Departure to Work by Sex in Huntsville
The most frequent times of departure to work in Huntsville are 12:00 AM to 4:59 AM (35, 29.7%) for males and 7:30 AM to 7:59 AM (20, 26.7%) for females.
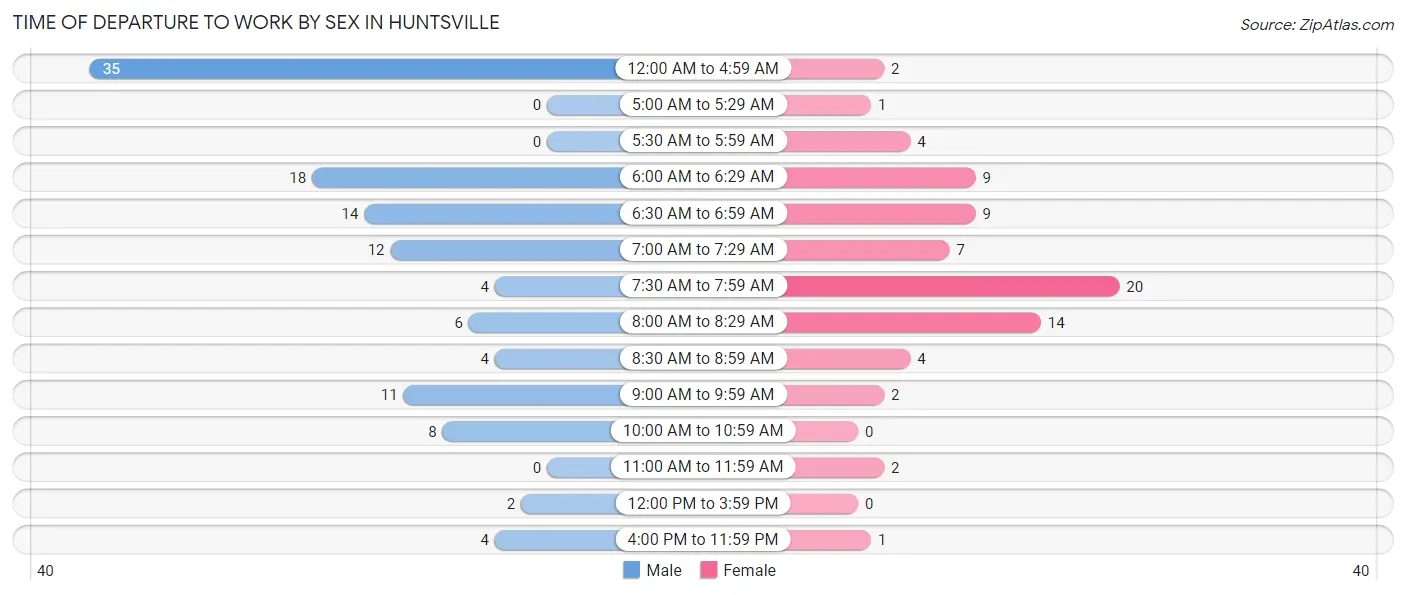
| Time of Departure | Male | Female |
| 12:00 AM to 4:59 AM | 35 (29.7%) | 2 (2.7%) |
| 5:00 AM to 5:29 AM | 0 (0.0%) | 1 (1.3%) |
| 5:30 AM to 5:59 AM | 0 (0.0%) | 4 (5.3%) |
| 6:00 AM to 6:29 AM | 18 (15.2%) | 9 (12.0%) |
| 6:30 AM to 6:59 AM | 14 (11.9%) | 9 (12.0%) |
| 7:00 AM to 7:29 AM | 12 (10.2%) | 7 (9.3%) |
| 7:30 AM to 7:59 AM | 4 (3.4%) | 20 (26.7%) |
| 8:00 AM to 8:29 AM | 6 (5.1%) | 14 (18.7%) |
| 8:30 AM to 8:59 AM | 4 (3.4%) | 4 (5.3%) |
| 9:00 AM to 9:59 AM | 11 (9.3%) | 2 (2.7%) |
| 10:00 AM to 10:59 AM | 8 (6.8%) | 0 (0.0%) |
| 11:00 AM to 11:59 AM | 0 (0.0%) | 2 (2.7%) |
| 12:00 PM to 3:59 PM | 2 (1.7%) | 0 (0.0%) |
| 4:00 PM to 11:59 PM | 4 (3.4%) | 1 (1.3%) |
| Total | 118 (100.0%) | 75 (100.0%) |
Housing Occupancy in Huntsville
Occupancy by Ownership in Huntsville
Of the total 201 dwellings in Huntsville, owner-occupied units account for 155 (77.1%), while renter-occupied units make up 46 (22.9%).
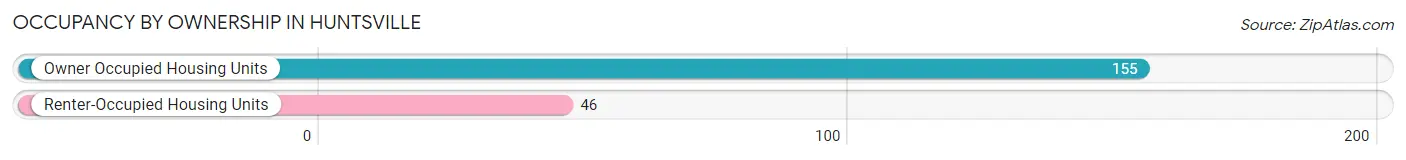
| Occupancy | # Housing Units | % Housing Units |
| Owner Occupied Housing Units | 155 | 77.1% |
| Renter-Occupied Housing Units | 46 | 22.9% |
| Total Occupied Housing Units | 201 | 100.0% |
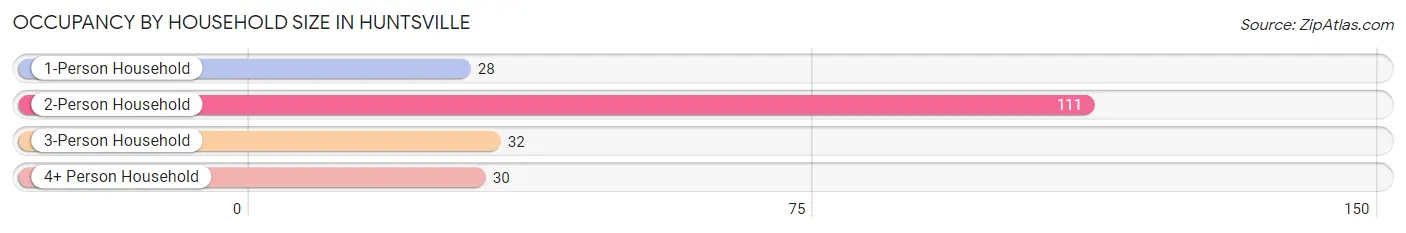
Occupancy by Household Size in Huntsville
| Household Size | # Housing Units | % Housing Units |
| 1-Person Household | 28 | 13.9% |
| 2-Person Household | 111 | 55.2% |
| 3-Person Household | 32 | 15.9% |
| 4+ Person Household | 30 | 14.9% |
| Total Housing Units | 201 | 100.0% |
Occupancy by Ownership by Household Size in Huntsville
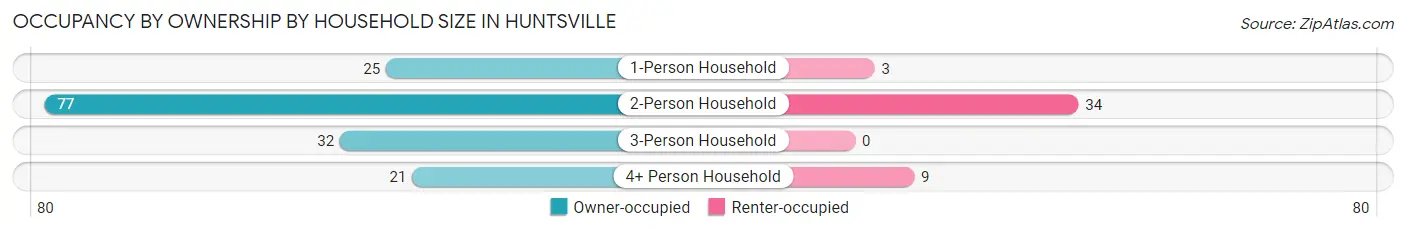
| Household Size | Owner-occupied | Renter-occupied |
| 1-Person Household | 25 (89.3%) | 3 (10.7%) |
| 2-Person Household | 77 (69.4%) | 34 (30.6%) |
| 3-Person Household | 32 (100.0%) | 0 (0.0%) |
| 4+ Person Household | 21 (70.0%) | 9 (30.0%) |
| Total Housing Units | 155 (77.1%) | 46 (22.9%) |
Occupancy by Educational Attainment in Huntsville
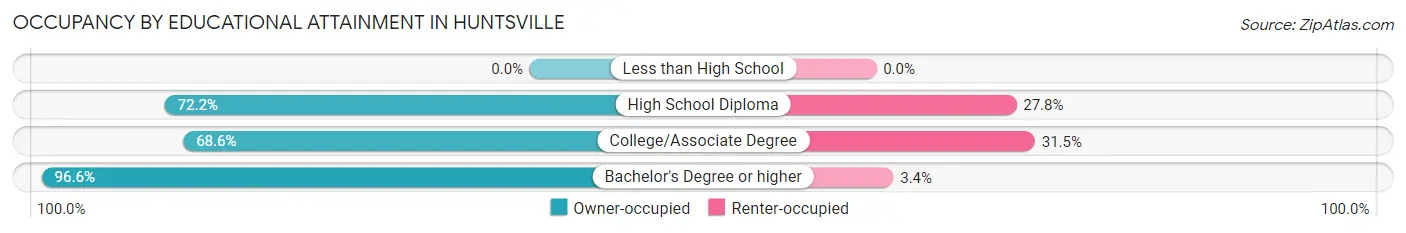
| Household Size | Owner-occupied | Renter-occupied |
| Less than High School | 0 (0.0%) | 0 (0.0%) |
| High School Diploma | 13 (72.2%) | 5 (27.8%) |
| College/Associate Degree | 85 (68.5%) | 39 (31.5%) |
| Bachelor's Degree or higher | 57 (96.6%) | 2 (3.4%) |
Occupancy by Age of Householder in Huntsville
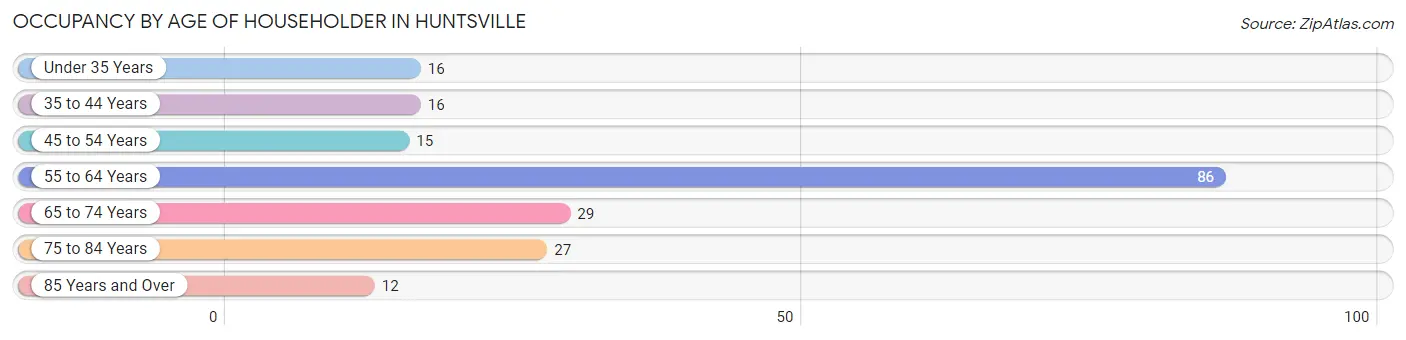
| Age Bracket | # Households | % Households |
| Under 35 Years | 16 | 8.0% |
| 35 to 44 Years | 16 | 8.0% |
| 45 to 54 Years | 15 | 7.5% |
| 55 to 64 Years | 86 | 42.8% |
| 65 to 74 Years | 29 | 14.4% |
| 75 to 84 Years | 27 | 13.4% |
| 85 Years and Over | 12 | 6.0% |
| Total | 201 | 100.0% |
Housing Finances in Huntsville
Median Income by Occupancy in Huntsville
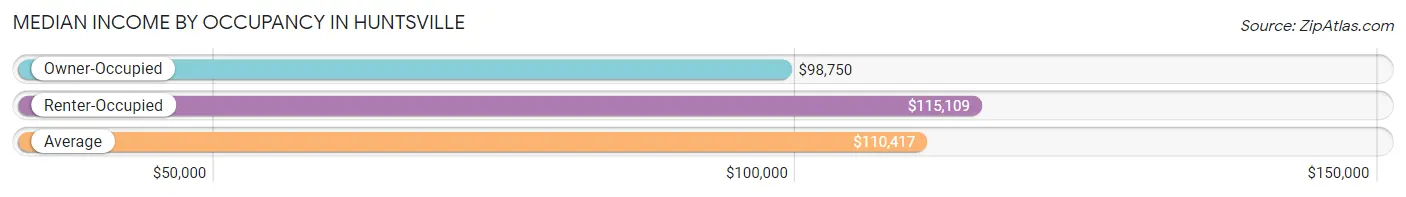
| Occupancy Type | # Households | Median Income |
| Owner-Occupied | 155 (77.1%) | $98,750 |
| Renter-Occupied | 46 (22.9%) | $115,109 |
| Average | 201 (100.0%) | $110,417 |
Occupancy by Householder Income Bracket in Huntsville
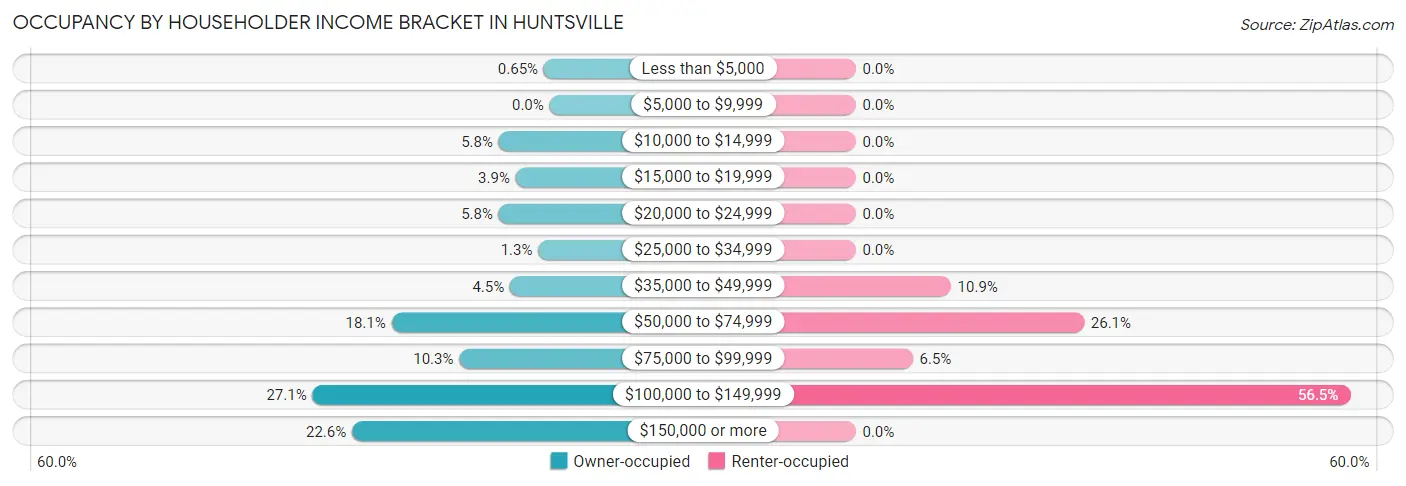
| Income Bracket | Owner-occupied | Renter-occupied |
| Less than $5,000 | 1 (0.6%) | 0 (0.0%) |
| $5,000 to $9,999 | 0 (0.0%) | 0 (0.0%) |
| $10,000 to $14,999 | 9 (5.8%) | 0 (0.0%) |
| $15,000 to $19,999 | 6 (3.9%) | 0 (0.0%) |
| $20,000 to $24,999 | 9 (5.8%) | 0 (0.0%) |
| $25,000 to $34,999 | 2 (1.3%) | 0 (0.0%) |
| $35,000 to $49,999 | 7 (4.5%) | 5 (10.9%) |
| $50,000 to $74,999 | 28 (18.1%) | 12 (26.1%) |
| $75,000 to $99,999 | 16 (10.3%) | 3 (6.5%) |
| $100,000 to $149,999 | 42 (27.1%) | 26 (56.5%) |
| $150,000 or more | 35 (22.6%) | 0 (0.0%) |
| Total | 155 (100.0%) | 46 (100.0%) |
Monthly Housing Cost Tiers in Huntsville
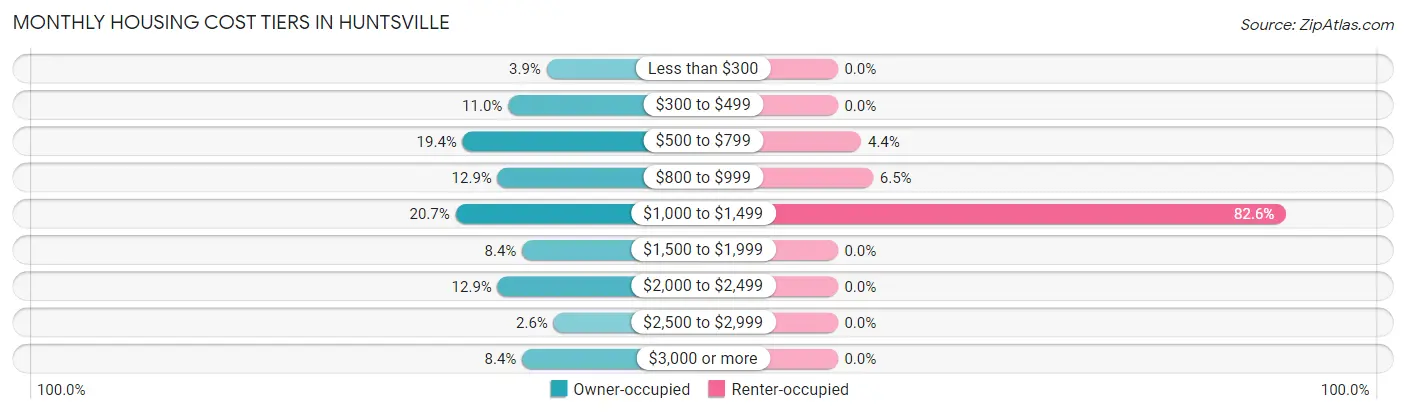
| Monthly Cost | Owner-occupied | Renter-occupied |
| Less than $300 | 6 (3.9%) | 0 (0.0%) |
| $300 to $499 | 17 (11.0%) | 0 (0.0%) |
| $500 to $799 | 30 (19.4%) | 2 (4.3%) |
| $800 to $999 | 20 (12.9%) | 3 (6.5%) |
| $1,000 to $1,499 | 32 (20.6%) | 38 (82.6%) |
| $1,500 to $1,999 | 13 (8.4%) | 0 (0.0%) |
| $2,000 to $2,499 | 20 (12.9%) | 0 (0.0%) |
| $2,500 to $2,999 | 4 (2.6%) | 0 (0.0%) |
| $3,000 or more | 13 (8.4%) | 0 (0.0%) |
| Total | 155 (100.0%) | 46 (100.0%) |
Physical Housing Characteristics in Huntsville
Housing Structures in Huntsville
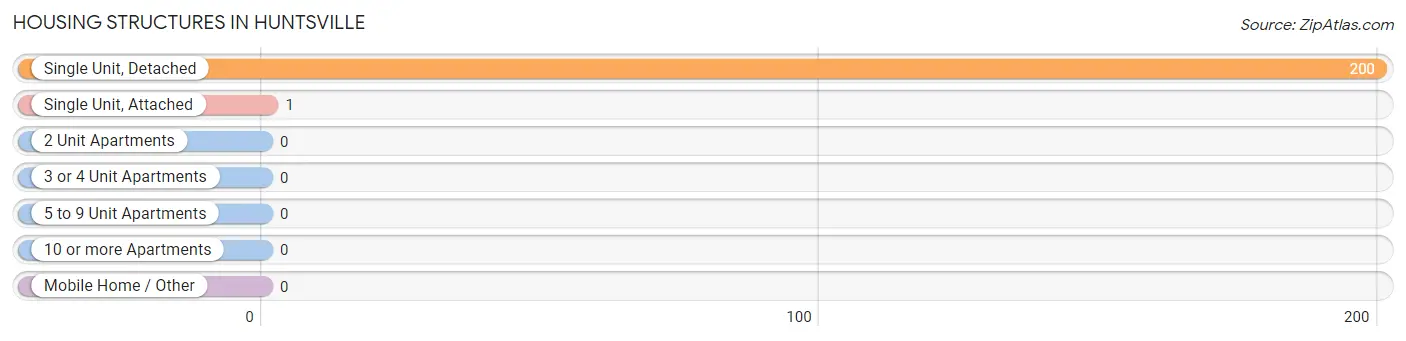
| Structure Type | # Housing Units | % Housing Units |
| Single Unit, Detached | 200 | 99.5% |
| Single Unit, Attached | 1 | 0.5% |
| 2 Unit Apartments | 0 | 0.0% |
| 3 or 4 Unit Apartments | 0 | 0.0% |
| 5 to 9 Unit Apartments | 0 | 0.0% |
| 10 or more Apartments | 0 | 0.0% |
| Mobile Home / Other | 0 | 0.0% |
| Total | 201 | 100.0% |
Housing Structures by Occupancy in Huntsville
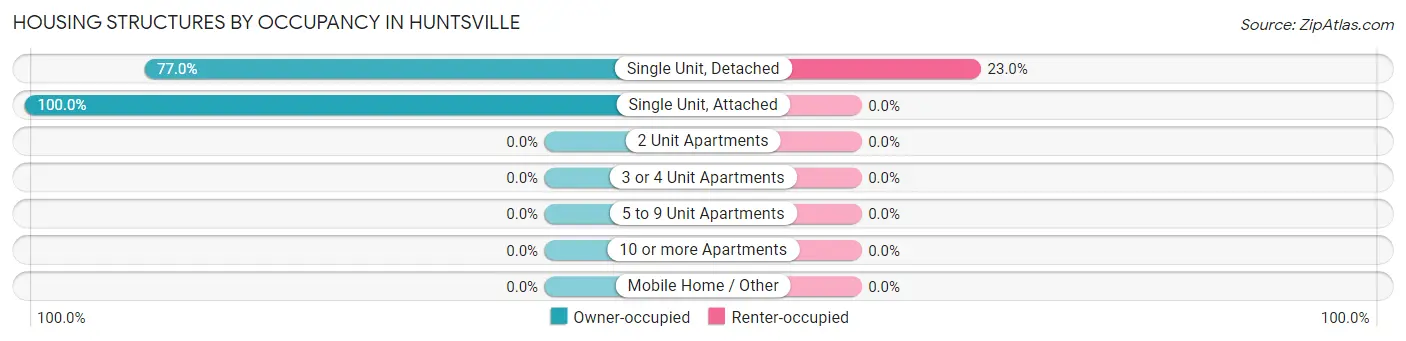
| Structure Type | Owner-occupied | Renter-occupied |
| Single Unit, Detached | 154 (77.0%) | 46 (23.0%) |
| Single Unit, Attached | 1 (100.0%) | 0 (0.0%) |
| 2 Unit Apartments | 0 (0.0%) | 0 (0.0%) |
| 3 or 4 Unit Apartments | 0 (0.0%) | 0 (0.0%) |
| 5 to 9 Unit Apartments | 0 (0.0%) | 0 (0.0%) |
| 10 or more Apartments | 0 (0.0%) | 0 (0.0%) |
| Mobile Home / Other | 0 (0.0%) | 0 (0.0%) |
| Total | 155 (77.1%) | 46 (22.9%) |
Housing Structures by Number of Rooms in Huntsville
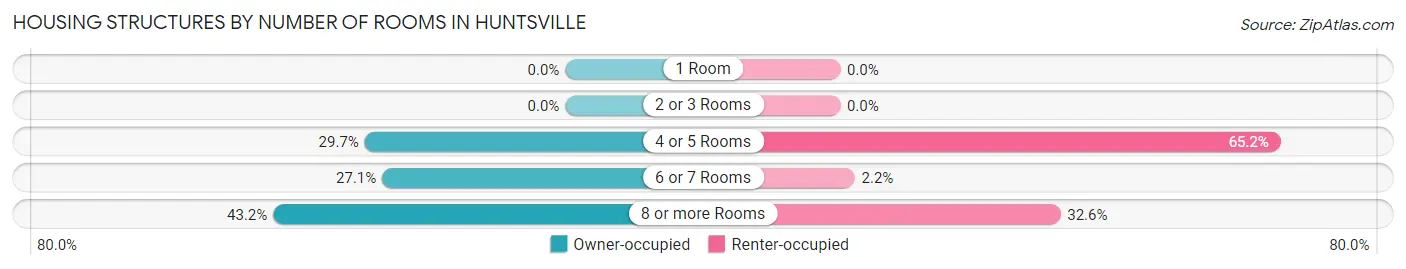
| Number of Rooms | Owner-occupied | Renter-occupied |
| 1 Room | 0 (0.0%) | 0 (0.0%) |
| 2 or 3 Rooms | 0 (0.0%) | 0 (0.0%) |
| 4 or 5 Rooms | 46 (29.7%) | 30 (65.2%) |
| 6 or 7 Rooms | 42 (27.1%) | 1 (2.2%) |
| 8 or more Rooms | 67 (43.2%) | 15 (32.6%) |
| Total | 155 (100.0%) | 46 (100.0%) |
Housing Structure by Heating Type in Huntsville
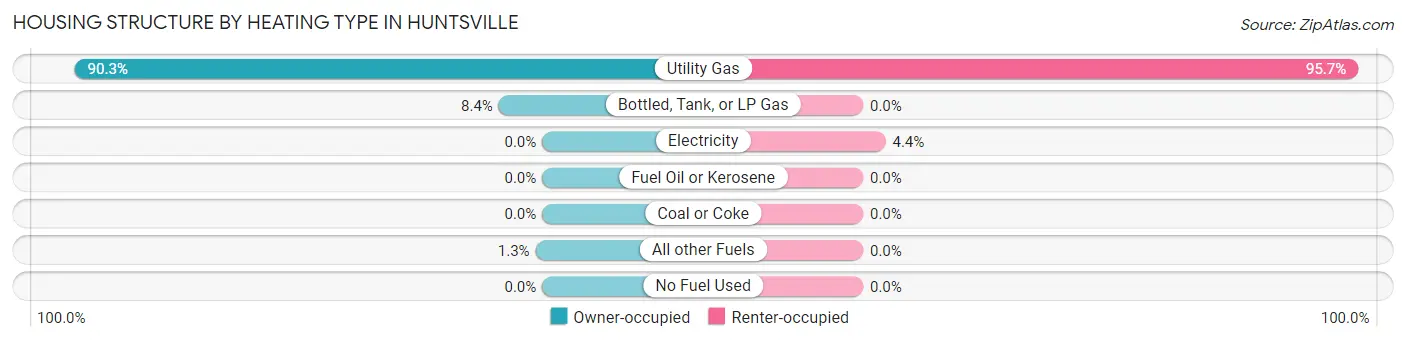
| Heating Type | Owner-occupied | Renter-occupied |
| Utility Gas | 140 (90.3%) | 44 (95.7%) |
| Bottled, Tank, or LP Gas | 13 (8.4%) | 0 (0.0%) |
| Electricity | 0 (0.0%) | 2 (4.3%) |
| Fuel Oil or Kerosene | 0 (0.0%) | 0 (0.0%) |
| Coal or Coke | 0 (0.0%) | 0 (0.0%) |
| All other Fuels | 2 (1.3%) | 0 (0.0%) |
| No Fuel Used | 0 (0.0%) | 0 (0.0%) |
| Total | 155 (100.0%) | 46 (100.0%) |
Household Vehicle Usage in Huntsville
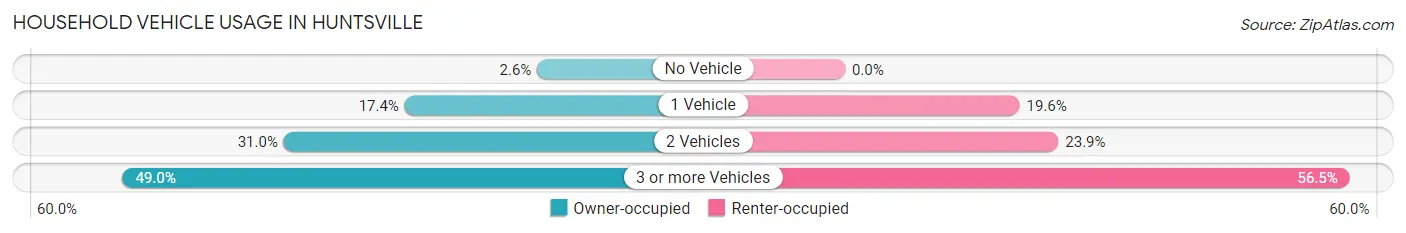
| Vehicles per Household | Owner-occupied | Renter-occupied |
| No Vehicle | 4 (2.6%) | 0 (0.0%) |
| 1 Vehicle | 27 (17.4%) | 9 (19.6%) |
| 2 Vehicles | 48 (31.0%) | 11 (23.9%) |
| 3 or more Vehicles | 76 (49.0%) | 26 (56.5%) |
| Total | 155 (100.0%) | 46 (100.0%) |
Real Estate & Mortgages in Huntsville
Real Estate and Mortgage Overview in Huntsville
| Characteristic | Without Mortgage | With Mortgage |
| Housing Units | 67 | 88 |
| Median Property Value | $553,600 | $440,000 |
| Median Household Income | $66,964 | $29 |
| Monthly Housing Costs | $595 | $13 |
| Real Estate Taxes | $3,194 | $0 |
Property Value by Mortgage Status in Huntsville
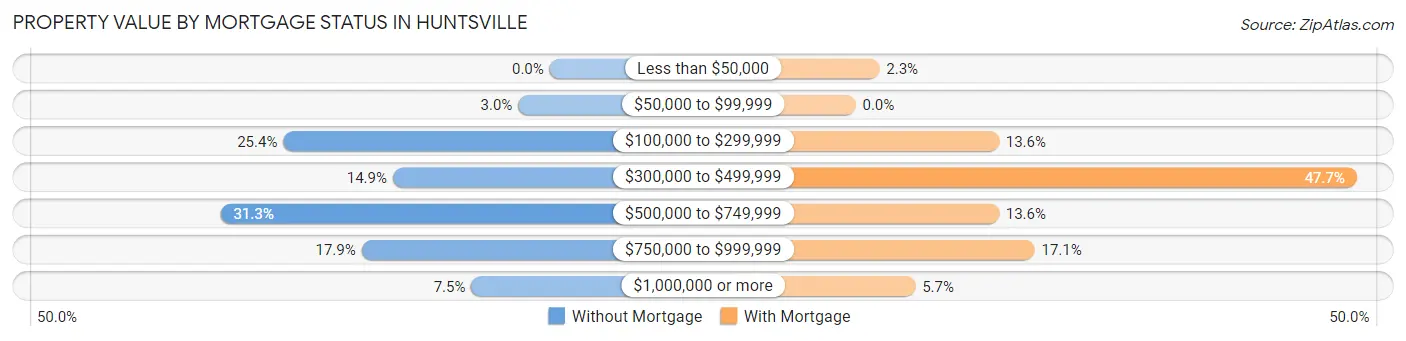
| Property Value | Without Mortgage | With Mortgage |
| Less than $50,000 | 0 (0.0%) | 2 (2.3%) |
| $50,000 to $99,999 | 2 (3.0%) | 0 (0.0%) |
| $100,000 to $299,999 | 17 (25.4%) | 12 (13.6%) |
| $300,000 to $499,999 | 10 (14.9%) | 42 (47.7%) |
| $500,000 to $749,999 | 21 (31.3%) | 12 (13.6%) |
| $750,000 to $999,999 | 12 (17.9%) | 15 (17.1%) |
| $1,000,000 or more | 5 (7.5%) | 5 (5.7%) |
| Total | 67 (100.0%) | 88 (100.0%) |
Household Income by Mortgage Status in Huntsville
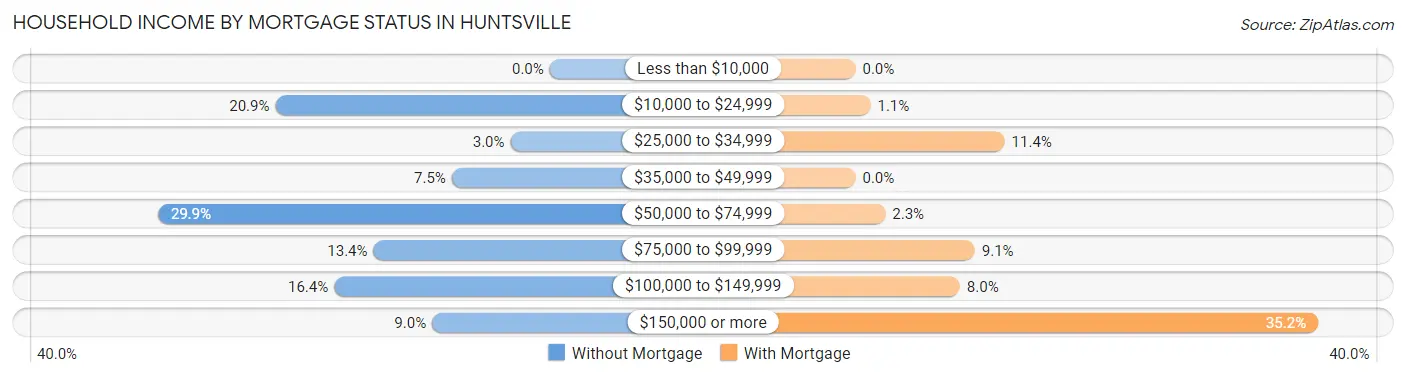
| Household Income | Without Mortgage | With Mortgage |
| Less than $10,000 | 0 (0.0%) | 0 (0.0%) |
| $10,000 to $24,999 | 14 (20.9%) | 1 (1.1%) |
| $25,000 to $34,999 | 2 (3.0%) | 10 (11.4%) |
| $35,000 to $49,999 | 5 (7.5%) | 0 (0.0%) |
| $50,000 to $74,999 | 20 (29.8%) | 2 (2.3%) |
| $75,000 to $99,999 | 9 (13.4%) | 8 (9.1%) |
| $100,000 to $149,999 | 11 (16.4%) | 7 (8.0%) |
| $150,000 or more | 6 (9.0%) | 31 (35.2%) |
| Total | 67 (100.0%) | 88 (100.0%) |
Property Value to Household Income Ratio in Huntsville
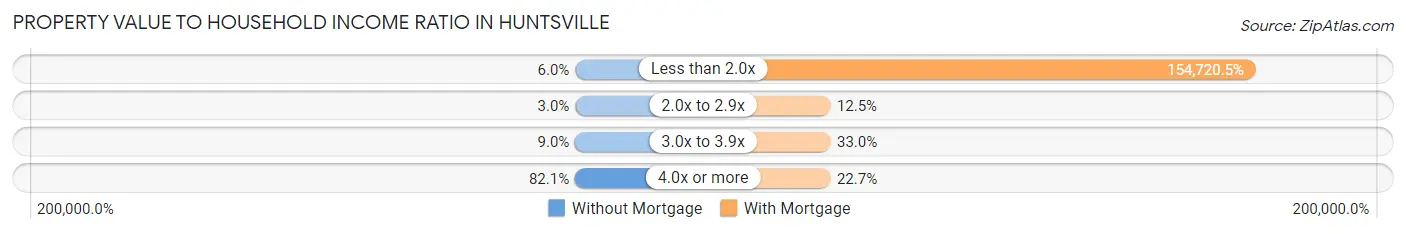
| Value-to-Income Ratio | Without Mortgage | With Mortgage |
| Less than 2.0x | 4 (6.0%) | 136,154 (154,720.5%) |
| 2.0x to 2.9x | 2 (3.0%) | 11 (12.5%) |
| 3.0x to 3.9x | 6 (9.0%) | 29 (33.0%) |
| 4.0x or more | 55 (82.1%) | 20 (22.7%) |
| Total | 67 (100.0%) | 88 (100.0%) |
Real Estate Taxes by Mortgage Status in Huntsville
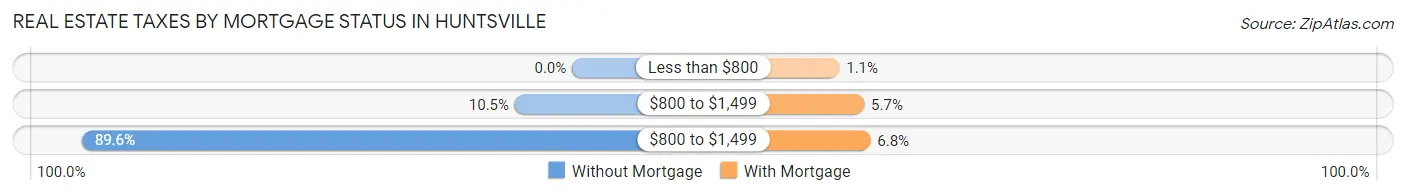
| Property Taxes | Without Mortgage | With Mortgage |
| Less than $800 | 0 (0.0%) | 1 (1.1%) |
| $800 to $1,499 | 7 (10.4%) | 5 (5.7%) |
| $800 to $1,499 | 60 (89.5%) | 6 (6.8%) |
| Total | 67 (100.0%) | 88 (100.0%) |
Health & Disability in Huntsville
Health Insurance Coverage by Age in Huntsville
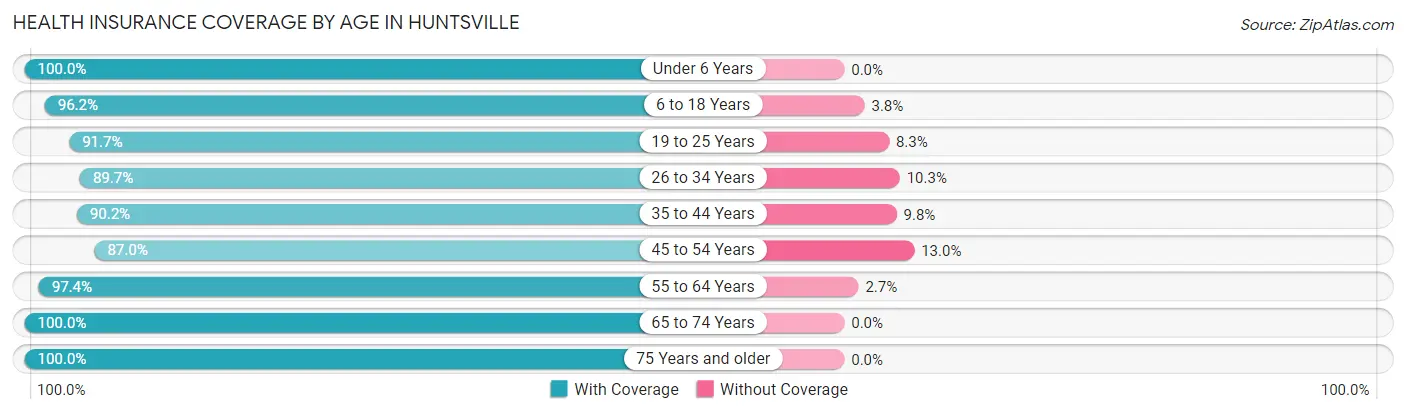
| Age Bracket | With Coverage | Without Coverage |
| Under 6 Years | 23 (100.0%) | 0 (0.0%) |
| 6 to 18 Years | 51 (96.2%) | 2 (3.8%) |
| 19 to 25 Years | 22 (91.7%) | 2 (8.3%) |
| 26 to 34 Years | 52 (89.7%) | 6 (10.3%) |
| 35 to 44 Years | 37 (90.2%) | 4 (9.8%) |
| 45 to 54 Years | 20 (87.0%) | 3 (13.0%) |
| 55 to 64 Years | 147 (97.4%) | 4 (2.6%) |
| 65 to 74 Years | 51 (100.0%) | 0 (0.0%) |
| 75 Years and older | 56 (100.0%) | 0 (0.0%) |
| Total | 459 (95.6%) | 21 (4.4%) |
Health Insurance Coverage by Citizenship Status in Huntsville
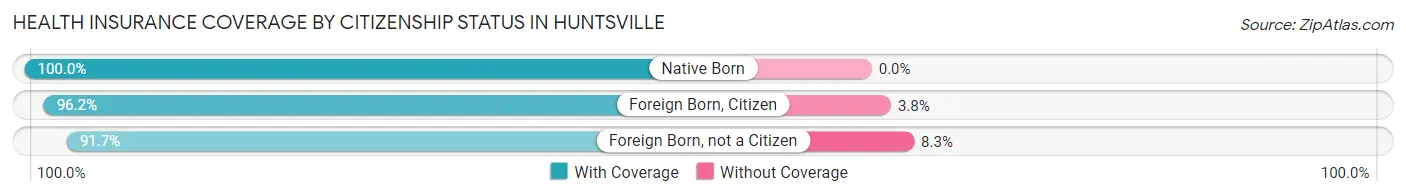
| Citizenship Status | With Coverage | Without Coverage |
| Native Born | 23 (100.0%) | 0 (0.0%) |
| Foreign Born, Citizen | 51 (96.2%) | 2 (3.8%) |
| Foreign Born, not a Citizen | 22 (91.7%) | 2 (8.3%) |
Health Insurance Coverage by Household Income in Huntsville
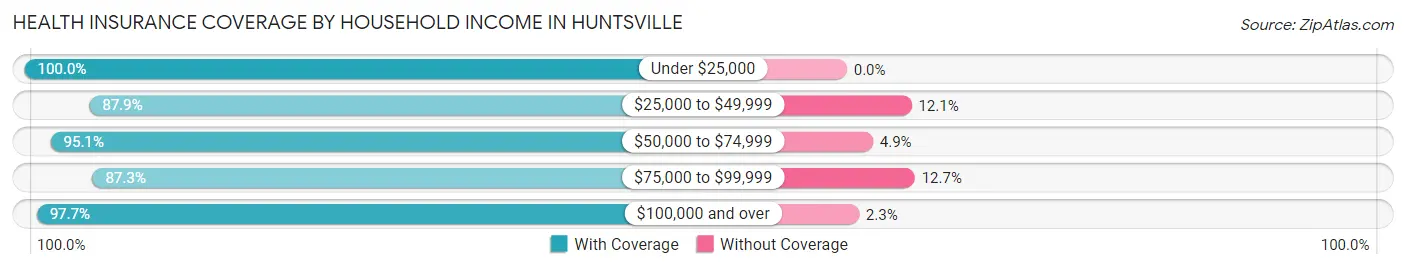
| Household Income | With Coverage | Without Coverage |
| Under $25,000 | 46 (100.0%) | 0 (0.0%) |
| $25,000 to $49,999 | 29 (87.9%) | 4 (12.1%) |
| $50,000 to $74,999 | 78 (95.1%) | 4 (4.9%) |
| $75,000 to $99,999 | 48 (87.3%) | 7 (12.7%) |
| $100,000 and over | 258 (97.7%) | 6 (2.3%) |
Public vs Private Health Insurance Coverage by Age in Huntsville

| Age Bracket | Public Insurance | Private Insurance |
| Under 6 | 1 (4.3%) | 22 (95.7%) |
| 6 to 18 Years | 13 (24.5%) | 38 (71.7%) |
| 19 to 25 Years | 4 (16.7%) | 22 (91.7%) |
| 25 to 34 Years | 7 (12.1%) | 45 (77.6%) |
| 35 to 44 Years | 9 (22.0%) | 28 (68.3%) |
| 45 to 54 Years | 0 (0.0%) | 20 (87.0%) |
| 55 to 64 Years | 6 (4.0%) | 143 (94.7%) |
| 65 to 74 Years | 51 (100.0%) | 27 (52.9%) |
| 75 Years and over | 56 (100.0%) | 30 (53.6%) |
| Total | 147 (30.6%) | 375 (78.1%) |
Disability Status by Sex by Age in Huntsville
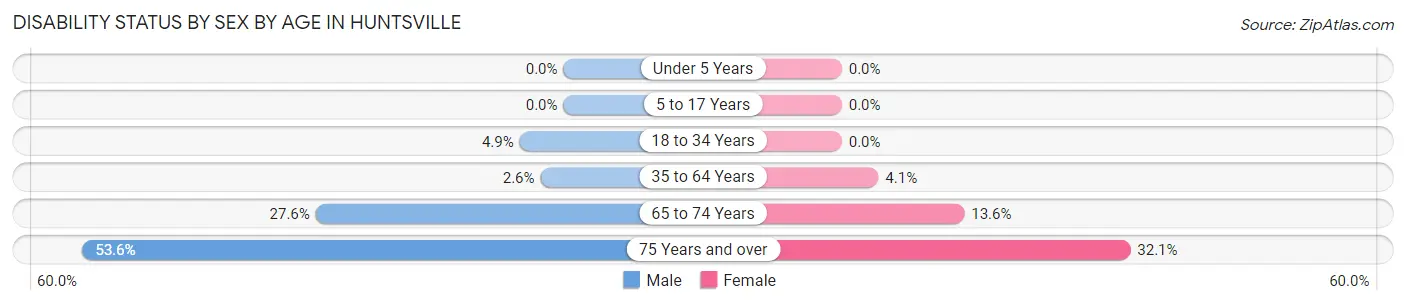
| Age Bracket | Male | Female |
| Under 5 Years | 0 (0.0%) | 0 (0.0%) |
| 5 to 17 Years | 0 (0.0%) | 0 (0.0%) |
| 18 to 34 Years | 2 (4.9%) | 0 (0.0%) |
| 35 to 64 Years | 3 (2.6%) | 4 (4.1%) |
| 65 to 74 Years | 8 (27.6%) | 3 (13.6%) |
| 75 Years and over | 15 (53.6%) | 9 (32.1%) |
Disability Class by Sex by Age in Huntsville
Disability Class: Hearing Difficulty
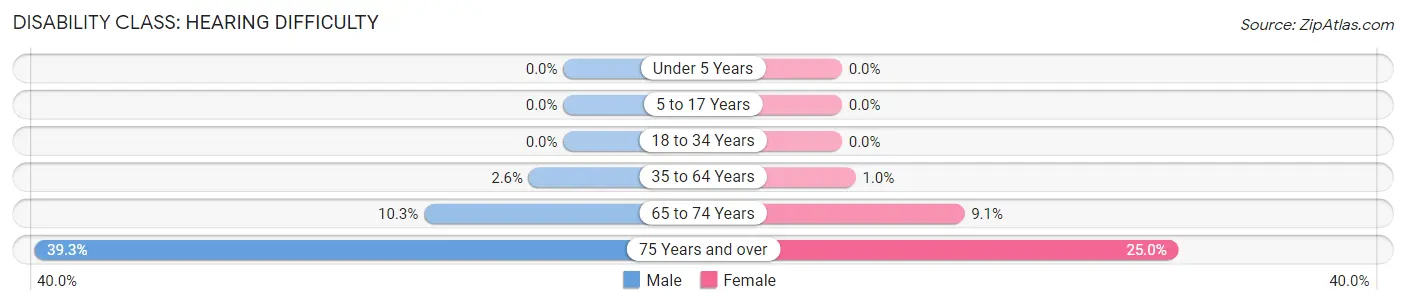
| Age Bracket | Male | Female |
| Under 5 Years | 0 (0.0%) | 0 (0.0%) |
| 5 to 17 Years | 0 (0.0%) | 0 (0.0%) |
| 18 to 34 Years | 0 (0.0%) | 0 (0.0%) |
| 35 to 64 Years | 3 (2.6%) | 1 (1.0%) |
| 65 to 74 Years | 3 (10.3%) | 2 (9.1%) |
| 75 Years and over | 11 (39.3%) | 7 (25.0%) |
Disability Class: Vision Difficulty
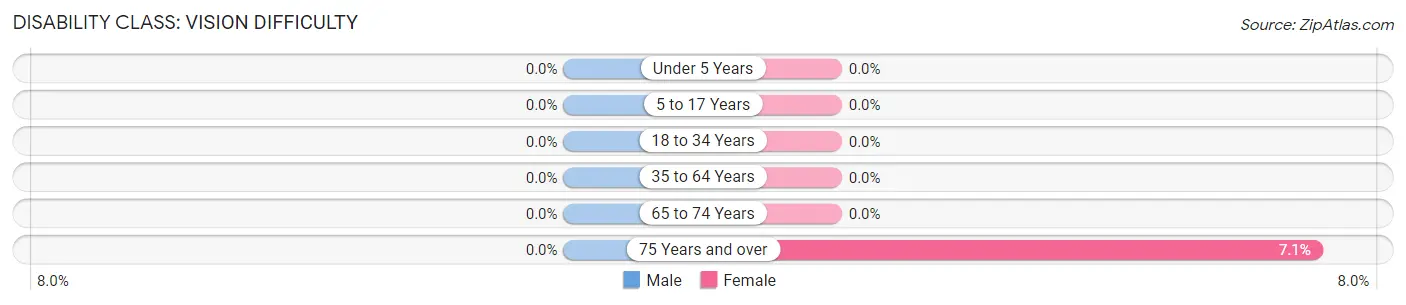
| Age Bracket | Male | Female |
| Under 5 Years | 0 (0.0%) | 0 (0.0%) |
| 5 to 17 Years | 0 (0.0%) | 0 (0.0%) |
| 18 to 34 Years | 0 (0.0%) | 0 (0.0%) |
| 35 to 64 Years | 0 (0.0%) | 0 (0.0%) |
| 65 to 74 Years | 0 (0.0%) | 0 (0.0%) |
| 75 Years and over | 0 (0.0%) | 2 (7.1%) |
Disability Class: Cognitive Difficulty
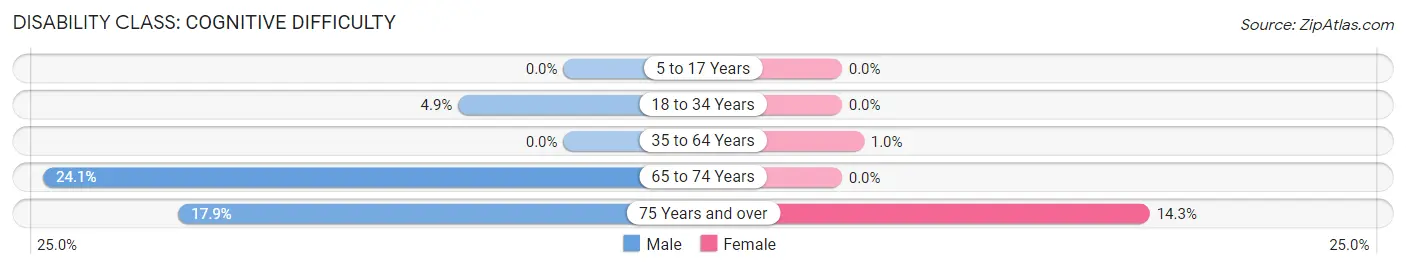
| Age Bracket | Male | Female |
| 5 to 17 Years | 0 (0.0%) | 0 (0.0%) |
| 18 to 34 Years | 2 (4.9%) | 0 (0.0%) |
| 35 to 64 Years | 0 (0.0%) | 1 (1.0%) |
| 65 to 74 Years | 7 (24.1%) | 0 (0.0%) |
| 75 Years and over | 5 (17.9%) | 4 (14.3%) |
Disability Class: Ambulatory Difficulty
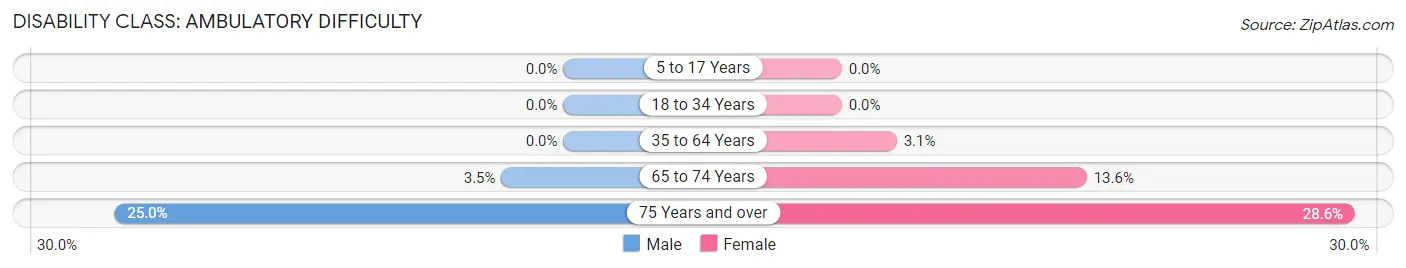
| Age Bracket | Male | Female |
| 5 to 17 Years | 0 (0.0%) | 0 (0.0%) |
| 18 to 34 Years | 0 (0.0%) | 0 (0.0%) |
| 35 to 64 Years | 0 (0.0%) | 3 (3.1%) |
| 65 to 74 Years | 1 (3.5%) | 3 (13.6%) |
| 75 Years and over | 7 (25.0%) | 8 (28.6%) |
Disability Class: Self-Care Difficulty
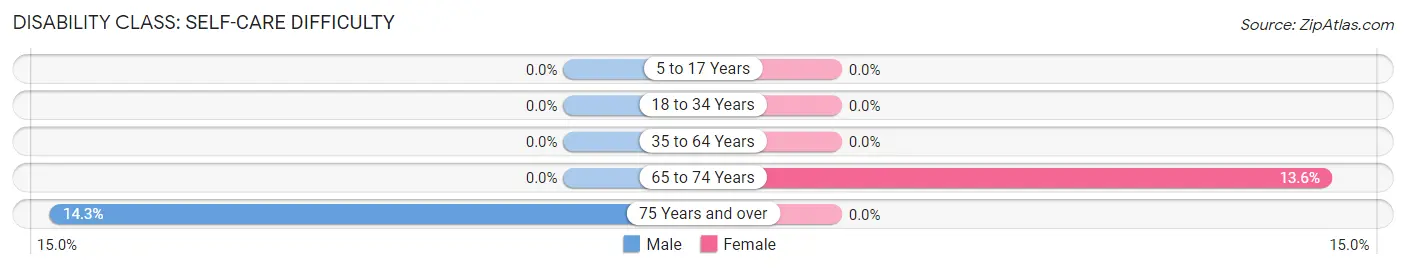
| Age Bracket | Male | Female |
| 5 to 17 Years | 0 (0.0%) | 0 (0.0%) |
| 18 to 34 Years | 0 (0.0%) | 0 (0.0%) |
| 35 to 64 Years | 0 (0.0%) | 0 (0.0%) |
| 65 to 74 Years | 0 (0.0%) | 3 (13.6%) |
| 75 Years and over | 4 (14.3%) | 0 (0.0%) |
Technology Access in Huntsville
Computing Device Access in Huntsville
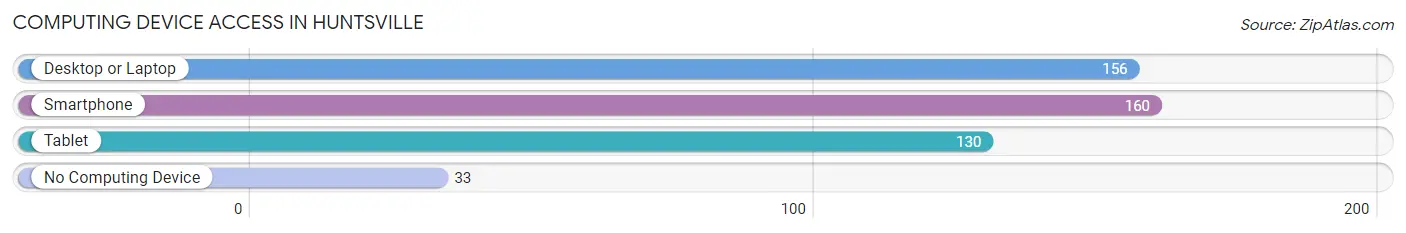
| Device Type | # Households | % Households |
| Desktop or Laptop | 156 | 77.6% |
| Smartphone | 160 | 79.6% |
| Tablet | 130 | 64.7% |
| No Computing Device | 33 | 16.4% |
| Total | 201 | 100.0% |
Internet Access in Huntsville
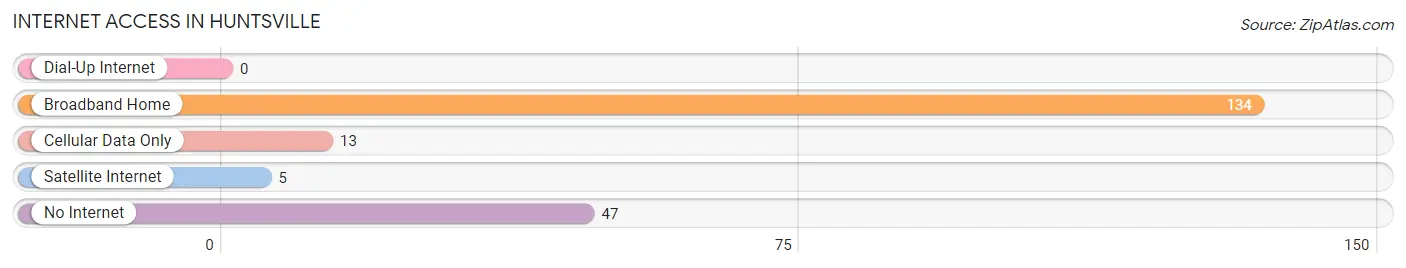
| Internet Type | # Households | % Households |
| Dial-Up Internet | 0 | 0.0% |
| Broadband Home | 134 | 66.7% |
| Cellular Data Only | 13 | 6.5% |
| Satellite Internet | 5 | 2.5% |
| No Internet | 47 | 23.4% |
| Total | 201 | 100.0% |
Huntsville Summary
Huntsville, Utah is a small town located in Weber County, Utah, United States. It is situated in the Ogden Valley, at the base of the Wasatch Mountains. The town is located approximately 20 miles east of Ogden and 30 miles north of Salt Lake City. The population of Huntsville was 1,719 at the 2010 census.
History
Huntsville was first settled in 1859 by a group of Mormon pioneers led by William H. Adams. The town was named after Adams’ hometown of Huntsville, Alabama. The settlers built a fort and a sawmill, and the town quickly grew. By the 1870s, Huntsville had become a popular summer resort destination for wealthy Salt Lakers.
In the early 1900s, Huntsville was a popular destination for skiers. The first ski jump in Utah was built in Huntsville in 1912. The town was also home to the first ski school in the state, which opened in 1924.
Geography
Huntsville is located in the Ogden Valley, at the base of the Wasatch Mountains. The town is situated at an elevation of 4,890 feet. The area is known for its scenic beauty, with the Wasatch Mountains to the east and the Great Salt Lake to the west.
The climate in Huntsville is semi-arid, with cold winters and hot summers. The average annual temperature is 44.3°F, with an average high of 68.2°F and an average low of 20.4°F.
Economy
Huntsville’s economy is largely based on tourism. The town is a popular destination for outdoor recreation, such as skiing, snowboarding, hiking, and mountain biking. The town is also home to several resorts, including Wolf Creek Resort and Snowbasin Resort.
The town is also home to several businesses, including a grocery store, a hardware store, and a gas station. The town is also home to several restaurants, including the Huntsville Grill and the Huntsville Cafe.
Demographics
As of the 2010 census, the population of Huntsville was 1,719. The racial makeup of the town was 95.2% White, 0.3% African American, 0.3% Native American, 0.7% Asian, 0.1% Pacific Islander, 1.2% from other races, and 2.3% from two or more races. Hispanic or Latino of any race were 3.2% of the population.
The median income for a household in Huntsville was $50,000, and the median income for a family was $54,000. The per capita income for the town was $22,000. About 8.2% of families and 10.2% of the population were below the poverty line, including 11.2% of those under age 18 and 8.3% of those age 65 or over.
Huntsville is a small town with a rich history and a vibrant economy. The town is a popular destination for outdoor recreation, and is home to several businesses and resorts. The town has a diverse population, with a median income that is slightly higher than the national average.
Common Questions
What is Per Capita Income in Huntsville?
Per Capita income in Huntsville is $43,763.
What is the Median Family Income in Huntsville?
Median Family Income in Huntsville is $115,924.
What is the Median Household income in Huntsville?
Median Household Income in Huntsville is $110,417.
What is Income or Wage Gap in Huntsville?
Income or Wage Gap in Huntsville is 68.9%.
Women in Huntsville earn 31.1 cents for every dollar earned by a man.
What is Inequality or Gini Index in Huntsville?
Inequality or Gini Index in Huntsville is 0.37.
What is the Total Population of Huntsville?
Total Population of Huntsville is 480.
What is the Total Male Population of Huntsville?
Total Male Population of Huntsville is 263.
What is the Total Female Population of Huntsville?
Total Female Population of Huntsville is 217.
What is the Ratio of Males per 100 Females in Huntsville?
There are 121.20 Males per 100 Females in Huntsville.
What is the Ratio of Females per 100 Males in Huntsville?
There are 82.51 Females per 100 Males in Huntsville.
What is the Median Population Age in Huntsville?
Median Population Age in Huntsville is 56.8 Years.
What is the Average Family Size in Huntsville
Average Family Size in Huntsville is 2.6 People.
What is the Average Household Size in Huntsville
Average Household Size in Huntsville is 2.4 People.
How Large is the Labor Force in Huntsville?
There are 239 People in the Labor Forcein in Huntsville.
What is the Percentage of People in the Labor Force in Huntsville?
56.8% of People are in the Labor Force in Huntsville.
What is the Unemployment Rate in Huntsville?
Unemployment Rate in Huntsville is 5.0%.