Veyo, UT Map & Demographics
Veyo Map
Veyo Overview
$32,045
PER CAPITA INCOME
0.25
INEQUALITY / GINI INDEX
381
TOTAL POPULATION
201
MALE POPULATION
180
FEMALE POPULATION
111.67
MALES / 100 FEMALES
89.55
FEMALES / 100 MALES
55.2
MEDIAN AGE
2.9
AVG FAMILY SIZE
2.9
AVG HOUSEHOLD SIZE
157
LABOR FORCE [ PEOPLE ]
53.8%
PERCENT IN LABOR FORCE
10.2%
UNEMPLOYMENT RATE
Veyo Zip Codes
Veyo Area Codes
Income in Veyo
Income Overview in Veyo
| Characteristic | Number | Measure |
| Per Capita Income | 381 | $32,045 |
| Median Family Income | 132 | $0 |
| Mean Family Income | 132 | $93,436 |
| Median Household Income | 132 | $0 |
| Mean Household Income | 132 | $93,436 |
| Income Deficit | 132 | $0 |
| Wage / Income Gap (%) | 381 | 0.00% |
| Wage / Income Gap ($) | 381 | 100.00¢ per $1 |
| Gini / Inequality Index | 381 | 0.25 |
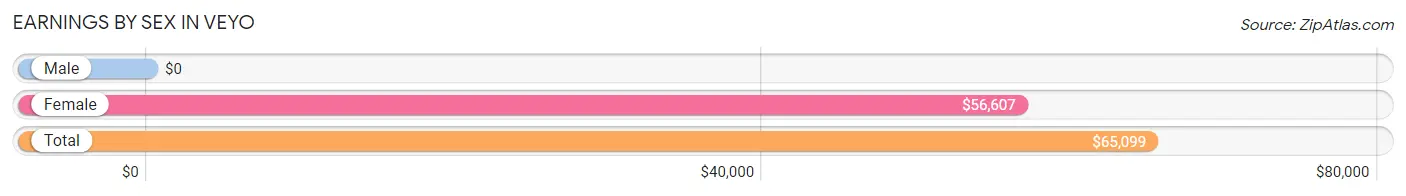
Earnings by Sex in Veyo
| Sex | Number | Average Earnings |
| Male | 72 (51.1%) | $0 |
| Female | 69 (48.9%) | $56,607 |
| Total | 141 (100.0%) | $65,099 |
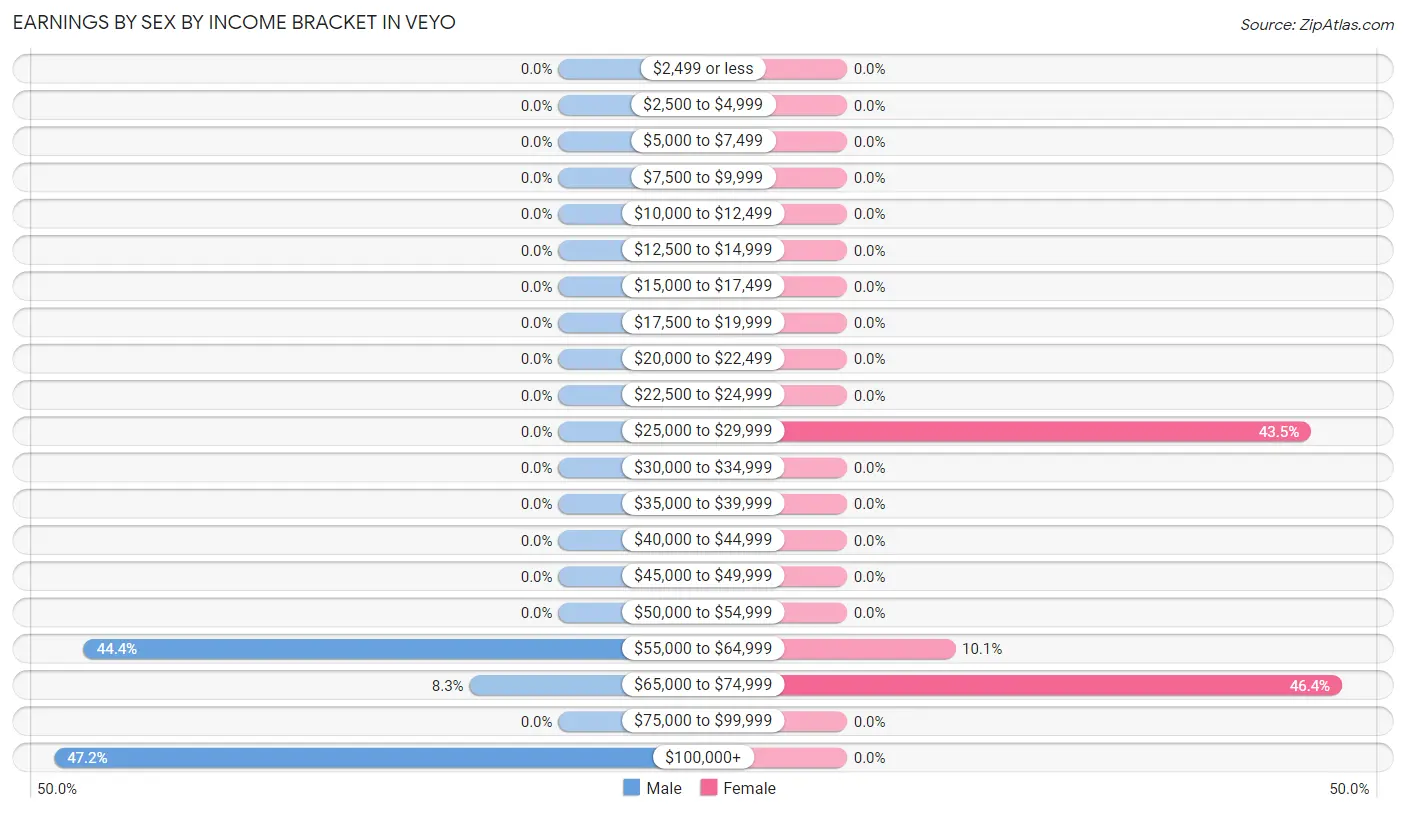
Earnings by Sex by Income Bracket in Veyo
The most common earnings brackets in Veyo are $100,000+ for men (34 | 47.2%) and $65,000 to $74,999 for women (32 | 46.4%).
| Income | Male | Female |
| $2,499 or less | 0 (0.0%) | 0 (0.0%) |
| $2,500 to $4,999 | 0 (0.0%) | 0 (0.0%) |
| $5,000 to $7,499 | 0 (0.0%) | 0 (0.0%) |
| $7,500 to $9,999 | 0 (0.0%) | 0 (0.0%) |
| $10,000 to $12,499 | 0 (0.0%) | 0 (0.0%) |
| $12,500 to $14,999 | 0 (0.0%) | 0 (0.0%) |
| $15,000 to $17,499 | 0 (0.0%) | 0 (0.0%) |
| $17,500 to $19,999 | 0 (0.0%) | 0 (0.0%) |
| $20,000 to $22,499 | 0 (0.0%) | 0 (0.0%) |
| $22,500 to $24,999 | 0 (0.0%) | 0 (0.0%) |
| $25,000 to $29,999 | 0 (0.0%) | 30 (43.5%) |
| $30,000 to $34,999 | 0 (0.0%) | 0 (0.0%) |
| $35,000 to $39,999 | 0 (0.0%) | 0 (0.0%) |
| $40,000 to $44,999 | 0 (0.0%) | 0 (0.0%) |
| $45,000 to $49,999 | 0 (0.0%) | 0 (0.0%) |
| $50,000 to $54,999 | 0 (0.0%) | 0 (0.0%) |
| $55,000 to $64,999 | 32 (44.4%) | 7 (10.1%) |
| $65,000 to $74,999 | 6 (8.3%) | 32 (46.4%) |
| $75,000 to $99,999 | 0 (0.0%) | 0 (0.0%) |
| $100,000+ | 34 (47.2%) | 0 (0.0%) |
| Total | 72 (100.0%) | 69 (100.0%) |
Earnings by Sex by Educational Attainment in Veyo
| Educational Attainment | Male Income | Female Income |
| Less than High School | - | - |
| High School Diploma | - | - |
| College or Associate's Degree | - | - |
| Bachelor's Degree | - | - |
| Graduate Degree | - | - |
| Total | - | - |
Family Income in Veyo
Family Income Brackets in Veyo
According to the Veyo family income data, there are 73 families falling into the $100,000 to $149,999 income range, which is the most common income bracket and makes up 55.3% of all families.
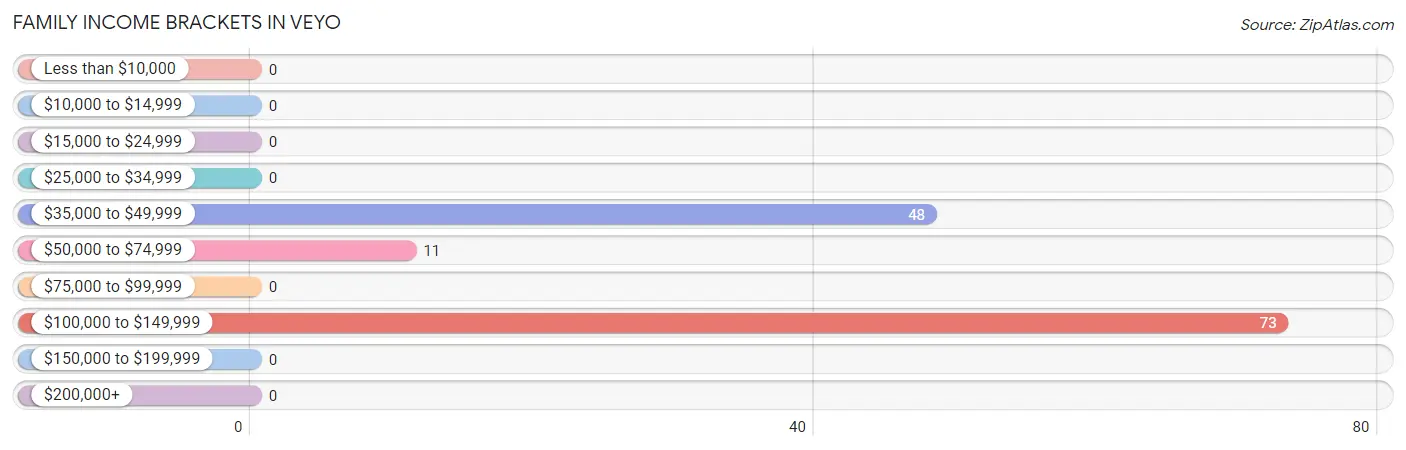
| Income Bracket | # Families | % Families |
| Less than $10,000 | 0 | 0.0% |
| $10,000 to $14,999 | 0 | 0.0% |
| $15,000 to $24,999 | 0 | 0.0% |
| $25,000 to $34,999 | 0 | 0.0% |
| $35,000 to $49,999 | 48 | 36.4% |
| $50,000 to $74,999 | 11 | 8.3% |
| $75,000 to $99,999 | 0 | 0.0% |
| $100,000 to $149,999 | 73 | 55.3% |
| $150,000 to $199,999 | 0 | 0.0% |
| $200,000+ | 0 | 0.0% |
Family Income by Famaliy Size in Veyo
2-person families (108 | 81.8%) account for the highest median family income in Veyo with $128,438 per family, while 2-person families (108 | 81.8%) have the highest median income of $64,219 per family member.
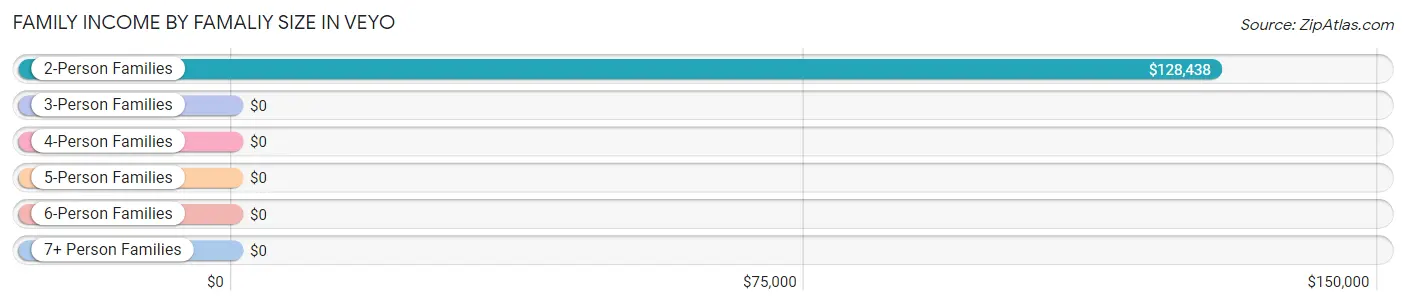
| Income Bracket | # Families | Median Income |
| 2-Person Families | 108 (81.8%) | $128,438 |
| 3-Person Families | 7 (5.3%) | $0 |
| 4-Person Families | 0 (0.0%) | $0 |
| 5-Person Families | 0 (0.0%) | $0 |
| 6-Person Families | 0 (0.0%) | $0 |
| 7+ Person Families | 17 (12.9%) | $0 |
| Total | 132 (100.0%) | $0 |
Family Income by Number of Earners in Veyo
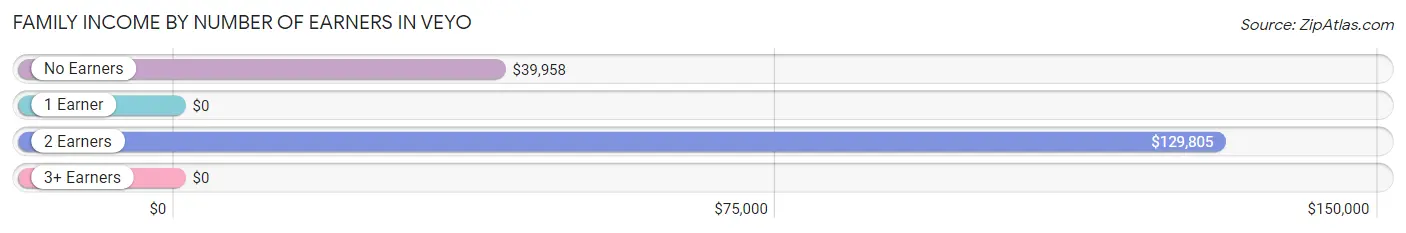
| Number of Earners | # Families | Median Income |
| No Earners | 59 (44.7%) | $39,958 |
| 1 Earner | 0 (0.0%) | $0 |
| 2 Earners | 73 (55.3%) | $129,805 |
| 3+ Earners | 0 (0.0%) | $0 |
| Total | 132 (100.0%) | $0 |
Household Income in Veyo
Household Income Brackets in Veyo
With 73 households falling in the category, the $100,000 to $149,999 income range is the most frequent in Veyo, accounting for 55.3% of all households.
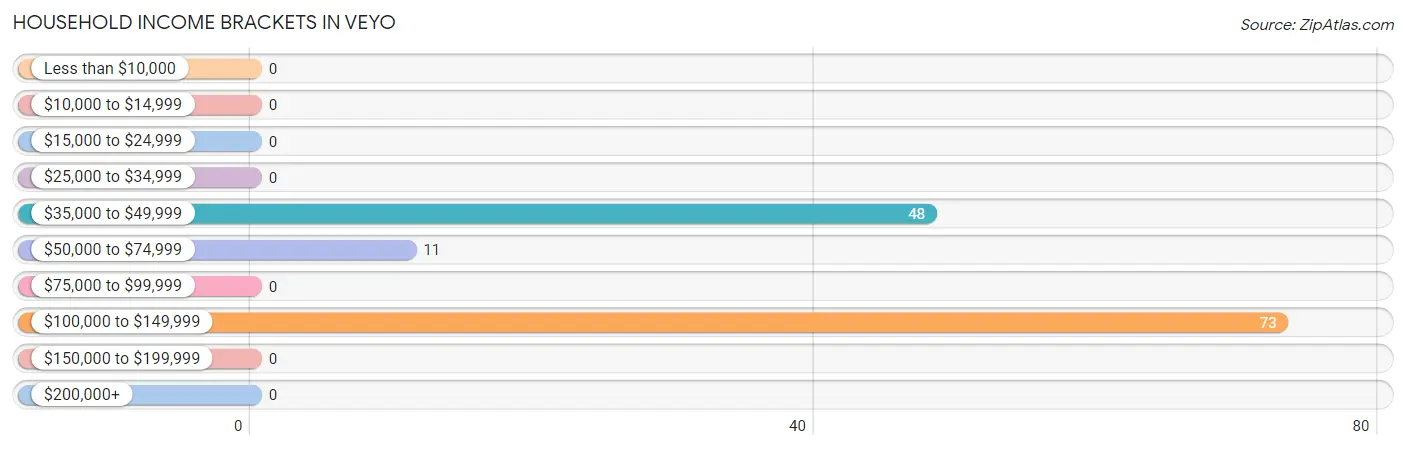
| Income Bracket | # Households | % Households |
| Less than $10,000 | 0 | 0.0% |
| $10,000 to $14,999 | 0 | 0.0% |
| $15,000 to $24,999 | 0 | 0.0% |
| $25,000 to $34,999 | 0 | 0.0% |
| $35,000 to $49,999 | 48 | 36.4% |
| $50,000 to $74,999 | 11 | 8.3% |
| $75,000 to $99,999 | 0 | 0.0% |
| $100,000 to $149,999 | 73 | 55.3% |
| $150,000 to $199,999 | 0 | 0.0% |
| $200,000+ | 0 | 0.0% |
Household Income by Householder Age in Veyo
The median household income in Veyo is $0, with the highest median household income of $46,111 found in the 65+ years age bracket for the primary householder. A total of 42 households (31.8%) fall into this category.
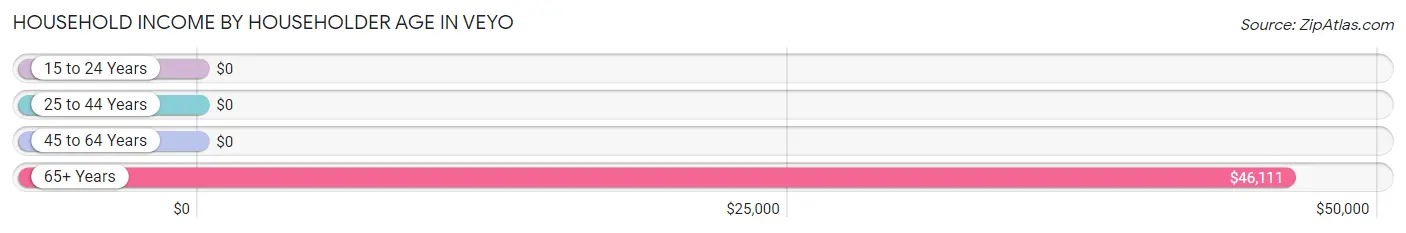
| Income Bracket | # Households | Median Income |
| 15 to 24 Years | 0 (0.0%) | $0 |
| 25 to 44 Years | 24 (18.2%) | $0 |
| 45 to 64 Years | 66 (50.0%) | $0 |
| 65+ Years | 42 (31.8%) | $46,111 |
| Total | 132 (100.0%) | $0 |
Poverty in Veyo
Income Below Poverty by Sex and Age in Veyo
With 42.8% poverty level for males and 37.2% for females among the residents of Veyo, under 5 year old males and 6 to 11 year old females are the most vulnerable to poverty, with 12 males (100.0%) and 14 females (100.0%) in their respective age groups living below the poverty level.
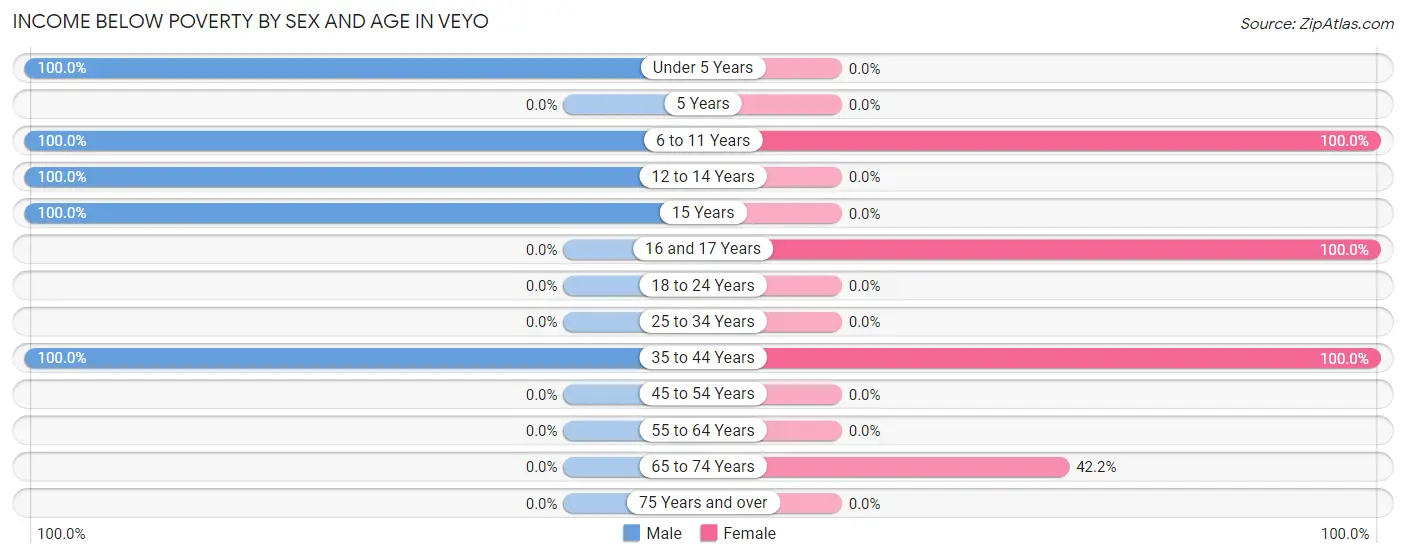
| Age Bracket | Male | Female |
| Under 5 Years | 12 (100.0%) | 0 (0.0%) |
| 5 Years | 0 (0.0%) | 0 (0.0%) |
| 6 to 11 Years | 26 (100.0%) | 14 (100.0%) |
| 12 to 14 Years | 14 (100.0%) | 0 (0.0%) |
| 15 Years | 18 (100.0%) | 0 (0.0%) |
| 16 and 17 Years | 0 (0.0%) | 17 (100.0%) |
| 18 to 24 Years | 0 (0.0%) | 0 (0.0%) |
| 25 to 34 Years | 0 (0.0%) | 0 (0.0%) |
| 35 to 44 Years | 16 (100.0%) | 17 (100.0%) |
| 45 to 54 Years | 0 (0.0%) | 0 (0.0%) |
| 55 to 64 Years | 0 (0.0%) | 0 (0.0%) |
| 65 to 74 Years | 0 (0.0%) | 19 (42.2%) |
| 75 Years and over | 0 (0.0%) | 0 (0.0%) |
| Total | 86 (42.8%) | 67 (37.2%) |
Income Above Poverty by Sex and Age in Veyo
According to the poverty statistics in Veyo, males aged 25 to 34 years and females aged under 5 years are the age groups that are most secure financially, with 100.0% of males and 100.0% of females in these age groups living above the poverty line.
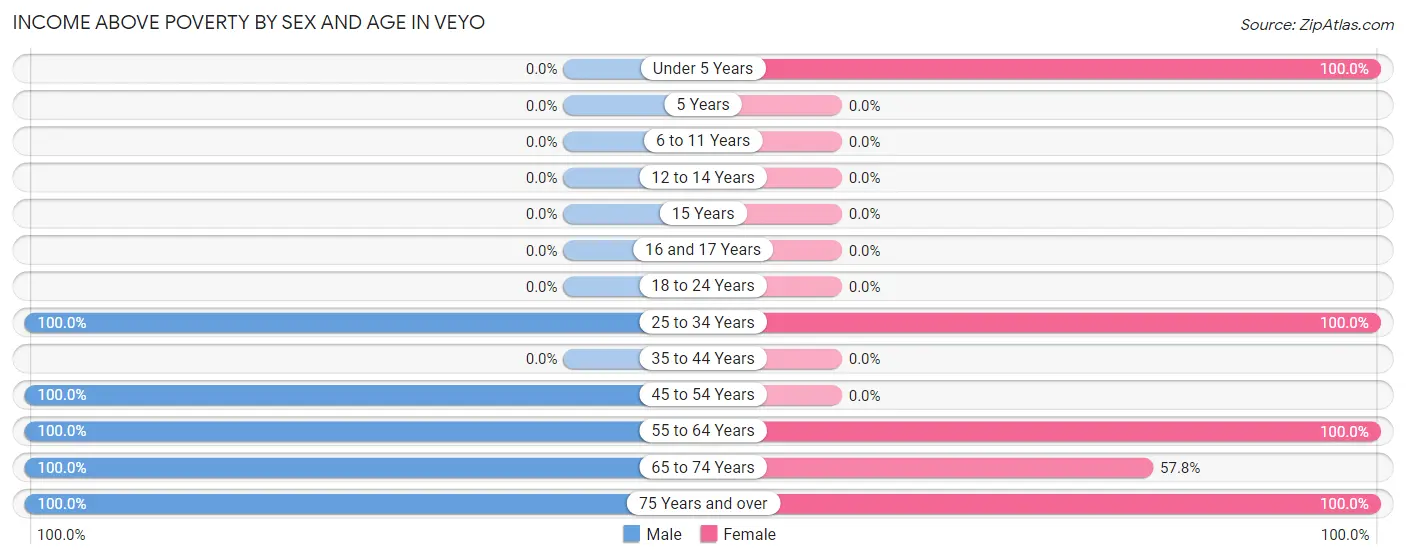
| Age Bracket | Male | Female |
| Under 5 Years | 0 (0.0%) | 5 (100.0%) |
| 5 Years | 0 (0.0%) | 0 (0.0%) |
| 6 to 11 Years | 0 (0.0%) | 0 (0.0%) |
| 12 to 14 Years | 0 (0.0%) | 0 (0.0%) |
| 15 Years | 0 (0.0%) | 0 (0.0%) |
| 16 and 17 Years | 0 (0.0%) | 0 (0.0%) |
| 18 to 24 Years | 0 (0.0%) | 0 (0.0%) |
| 25 to 34 Years | 6 (100.0%) | 7 (100.0%) |
| 35 to 44 Years | 0 (0.0%) | 0 (0.0%) |
| 45 to 54 Years | 32 (100.0%) | 0 (0.0%) |
| 55 to 64 Years | 34 (100.0%) | 62 (100.0%) |
| 65 to 74 Years | 18 (100.0%) | 26 (57.8%) |
| 75 Years and over | 25 (100.0%) | 13 (100.0%) |
| Total | 115 (57.2%) | 113 (62.8%) |
Income Below Poverty Among Married-Couple Families in Veyo
The poverty statistics for married-couple families in Veyo show that 12.9% or 17 of the total 132 families live below the poverty line. Families with 5 or more children have the highest poverty rate of 100.0%, comprising of 17 families. On the other hand, families with no children have the lowest poverty rate of 0.0%, which includes 0 families.
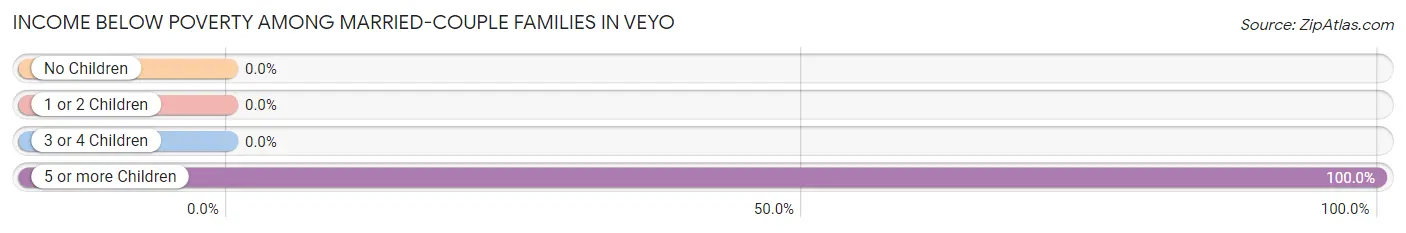
| Children | Above Poverty | Below Poverty |
| No Children | 108 (100.0%) | 0 (0.0%) |
| 1 or 2 Children | 7 (100.0%) | 0 (0.0%) |
| 3 or 4 Children | 0 (0.0%) | 0 (0.0%) |
| 5 or more Children | 0 (0.0%) | 17 (100.0%) |
| Total | 115 (87.1%) | 17 (12.9%) |
Income Below Poverty Among Single-Parent Households in Veyo
| Children | Single Father | Single Mother |
| No Children | 0 (0.0%) | 0 (0.0%) |
| 1 or 2 Children | 0 (0.0%) | 0 (0.0%) |
| 3 or 4 Children | 0 (0.0%) | 0 (0.0%) |
| 5 or more Children | 0 (0.0%) | 0 (0.0%) |
| Total | 0 (0.0%) | 0 (0.0%) |
Income Below Poverty Among Married-Couple vs Single-Parent Households in Veyo
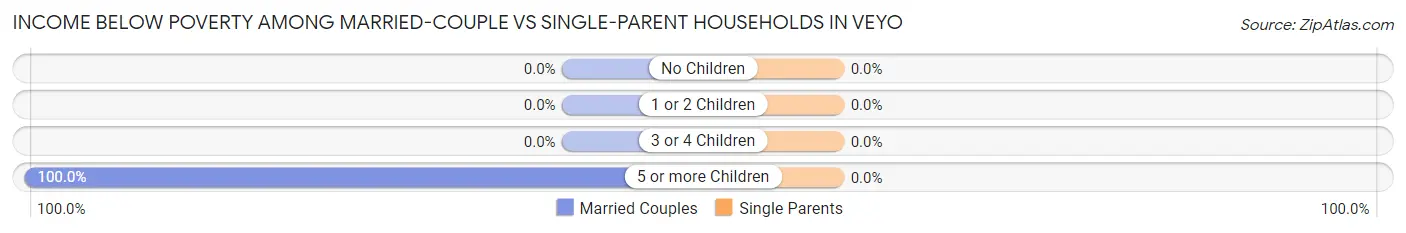
| Children | Married-Couple Families | Single-Parent Households |
| No Children | 0 (0.0%) | 0 (0.0%) |
| 1 or 2 Children | 0 (0.0%) | 0 (0.0%) |
| 3 or 4 Children | 0 (0.0%) | 0 (0.0%) |
| 5 or more Children | 17 (100.0%) | 0 (0.0%) |
| Total | 17 (12.9%) | 0 (0.0%) |
Race in Veyo
The most populous races in Veyo are White / Caucasian (341 | 89.5%), Hispanic or Latino (40 | 10.5%), and Some other Race (40 | 10.5%).
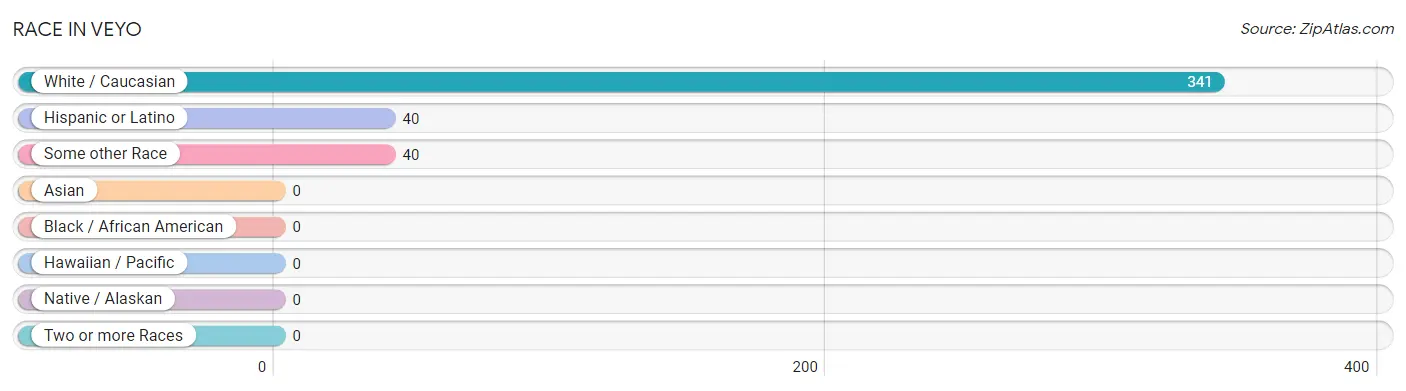
| Race | # Population | % Population |
| Asian | 0 | 0.0% |
| Black / African American | 0 | 0.0% |
| Hawaiian / Pacific | 0 | 0.0% |
| Hispanic or Latino | 40 | 10.5% |
| Native / Alaskan | 0 | 0.0% |
| White / Caucasian | 341 | 89.5% |
| Two or more Races | 0 | 0.0% |
| Some other Race | 40 | 10.5% |
| Total | 381 | 100.0% |
Ancestry in Veyo
The most populous ancestries reported in Veyo are English (130 | 34.1%), American (66 | 17.3%), Mexican (40 | 10.5%), Scandinavian (34 | 8.9%), and Irish (30 | 7.9%), together accounting for 78.7% of all Veyo residents.
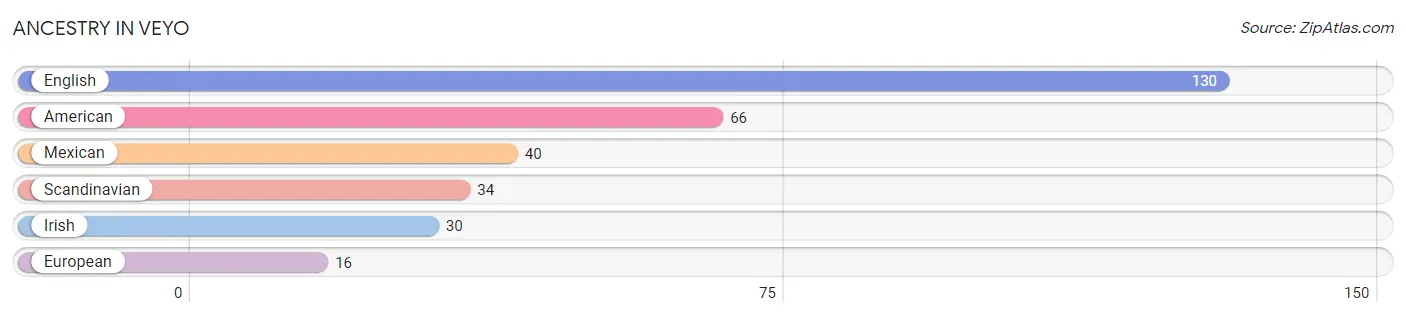
| Ancestry | # Population | % Population |
| American | 66 | 17.3% |
| English | 130 | 34.1% |
| European | 16 | 4.2% |
| Irish | 30 | 7.9% |
| Mexican | 40 | 10.5% |
| Scandinavian | 34 | 8.9% | View All 6 Rows |
Immigrants in Veyo

| Immigration Origin | # Population | % Population | View All 0 Rows |
Sex and Age in Veyo
Sex and Age in Veyo
The most populous age groups in Veyo are 55 to 59 Years (34 | 16.9%) for men and 55 to 59 Years (62 | 34.4%) for women.
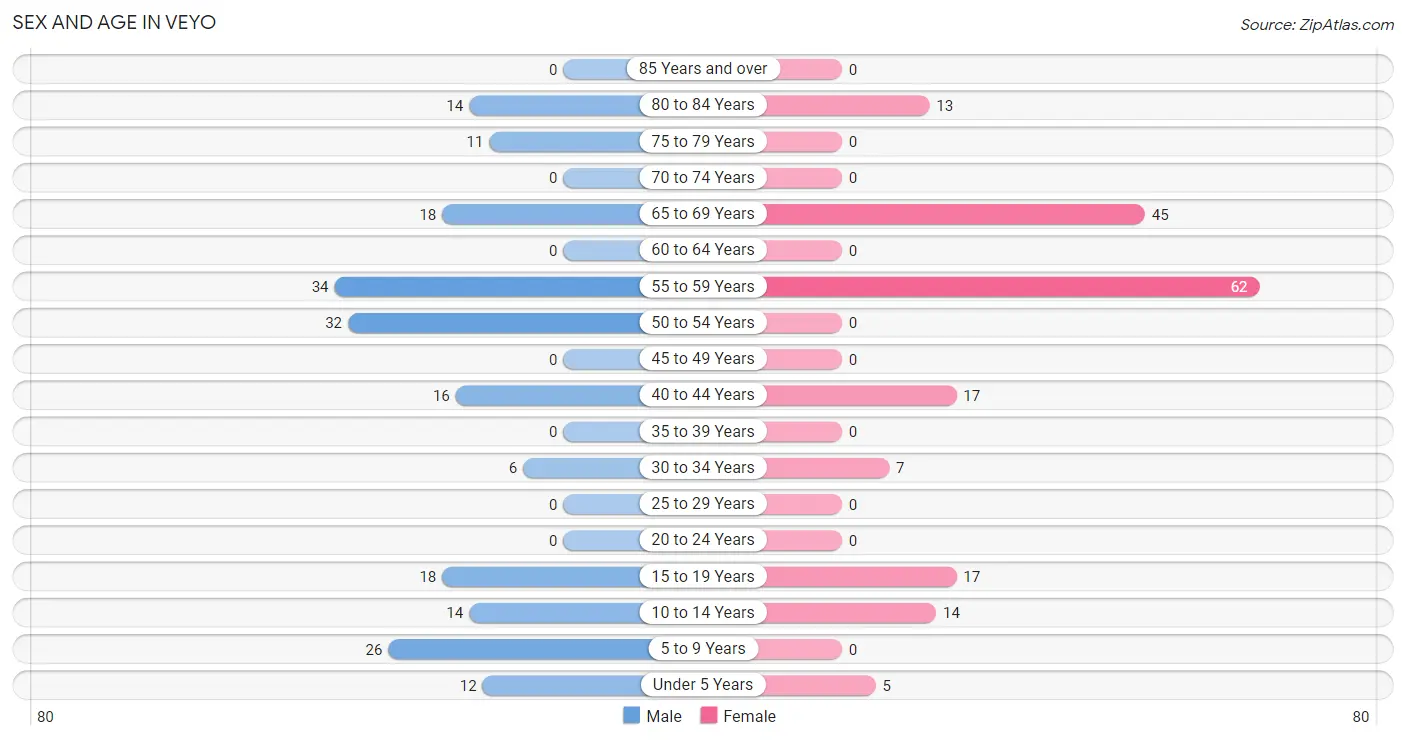
| Age Bracket | Male | Female |
| Under 5 Years | 12 (6.0%) | 5 (2.8%) |
| 5 to 9 Years | 26 (12.9%) | 0 (0.0%) |
| 10 to 14 Years | 14 (7.0%) | 14 (7.8%) |
| 15 to 19 Years | 18 (9.0%) | 17 (9.4%) |
| 20 to 24 Years | 0 (0.0%) | 0 (0.0%) |
| 25 to 29 Years | 0 (0.0%) | 0 (0.0%) |
| 30 to 34 Years | 6 (3.0%) | 7 (3.9%) |
| 35 to 39 Years | 0 (0.0%) | 0 (0.0%) |
| 40 to 44 Years | 16 (8.0%) | 17 (9.4%) |
| 45 to 49 Years | 0 (0.0%) | 0 (0.0%) |
| 50 to 54 Years | 32 (15.9%) | 0 (0.0%) |
| 55 to 59 Years | 34 (16.9%) | 62 (34.4%) |
| 60 to 64 Years | 0 (0.0%) | 0 (0.0%) |
| 65 to 69 Years | 18 (9.0%) | 45 (25.0%) |
| 70 to 74 Years | 0 (0.0%) | 0 (0.0%) |
| 75 to 79 Years | 11 (5.5%) | 0 (0.0%) |
| 80 to 84 Years | 14 (7.0%) | 13 (7.2%) |
| 85 Years and over | 0 (0.0%) | 0 (0.0%) |
| Total | 201 (100.0%) | 180 (100.0%) |
Families and Households in Veyo
Median Family Size in Veyo
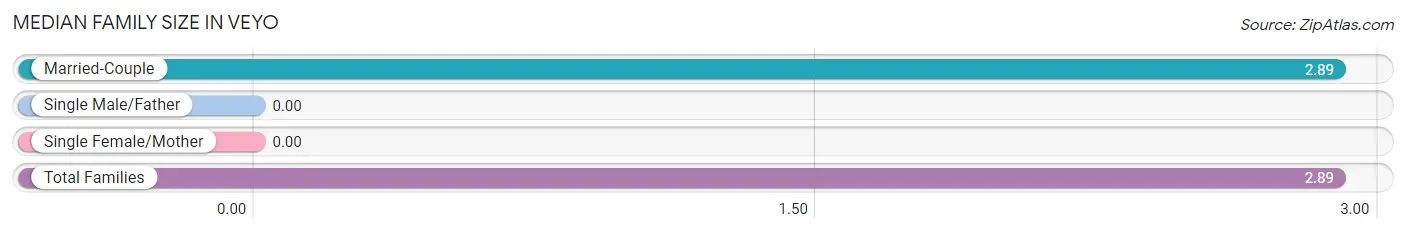
| Family Type | # Families | Family Size |
| Married-Couple | 132 (100.0%) | 2.89 |
| Single Male/Father | 0 (0.0%) | - |
| Single Female/Mother | 0 (0.0%) | - |
| Total Families | 132 (100.0%) | 2.89 |
Median Household Size in Veyo
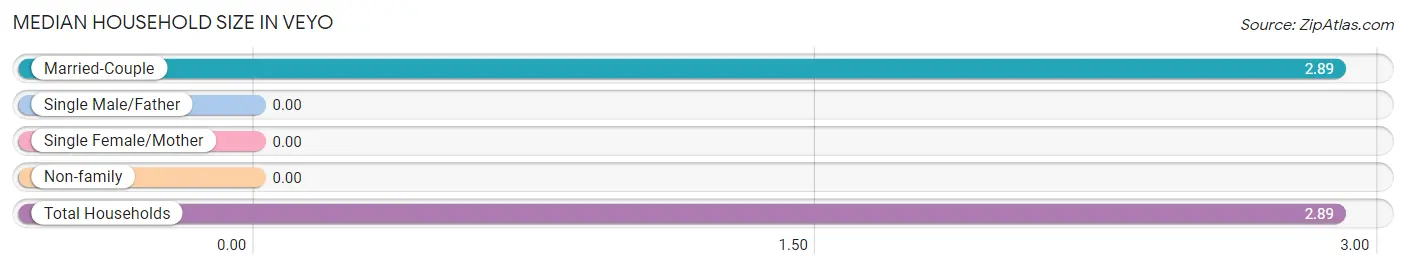
| Household Type | # Households | Household Size |
| Married-Couple | 132 (100.0%) | 2.89 |
| Single Male/Father | 0 (0.0%) | - |
| Single Female/Mother | 0 (0.0%) | - |
| Non-family | 0 (0.0%) | - |
| Total Households | 132 (100.0%) | 2.89 |
Household Size by Marriage Status in Veyo
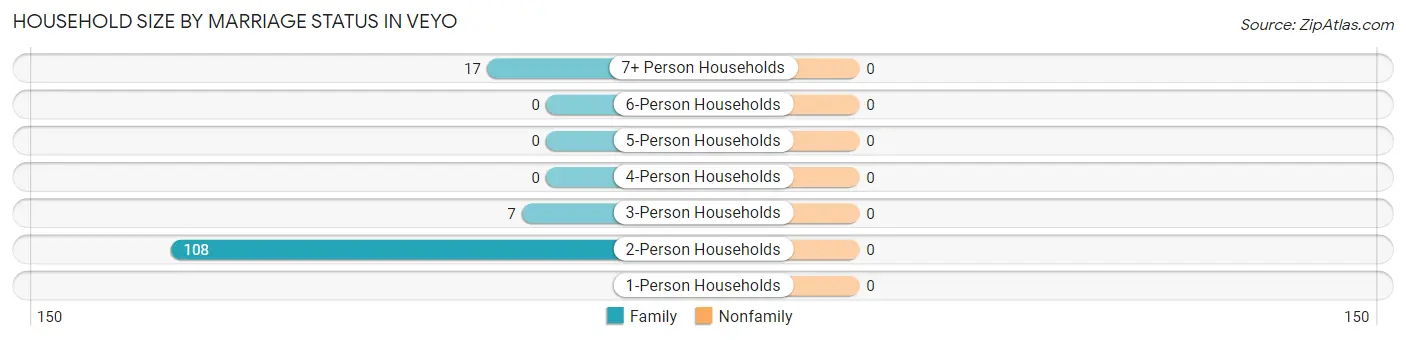
| Household Size | Family Households | Nonfamily Households |
| 1-Person Households | - | 0 (0.0%) |
| 2-Person Households | 108 (81.8%) | 0 (0.0%) |
| 3-Person Households | 7 (5.3%) | 0 (0.0%) |
| 4-Person Households | 0 (0.0%) | 0 (0.0%) |
| 5-Person Households | 0 (0.0%) | 0 (0.0%) |
| 6-Person Households | 0 (0.0%) | 0 (0.0%) |
| 7+ Person Households | 17 (12.9%) | 0 (0.0%) |
| Total | 132 (100.0%) | 0 (0.0%) |
Female Fertility in Veyo
Fertility by Age in Veyo
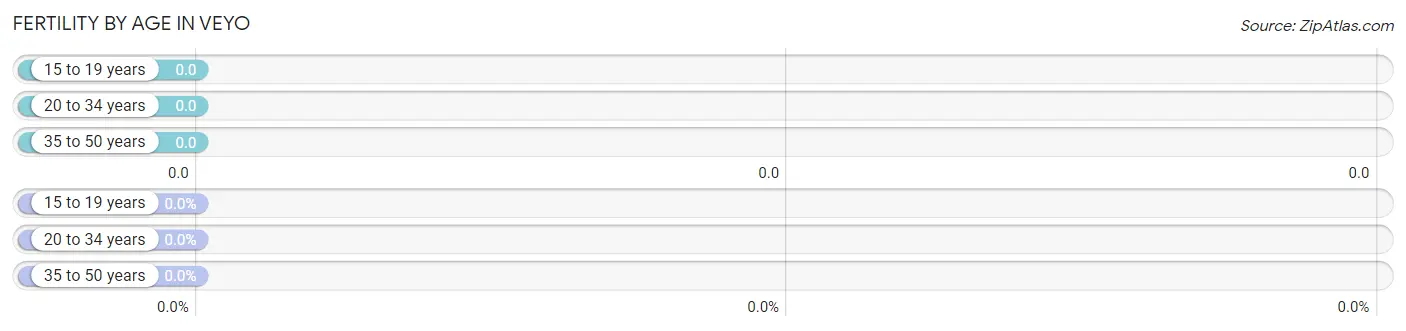
| Age Bracket | Women with Births | Births / 1,000 Women |
| 15 to 19 years | 0 (0.0%) | 0.0 |
| 20 to 34 years | 0 (0.0%) | 0.0 |
| 35 to 50 years | 0 (0.0%) | 0.0 |
| Total | 0 (0.0%) | 0.0 |
Fertility by Age by Marriage Status in Veyo
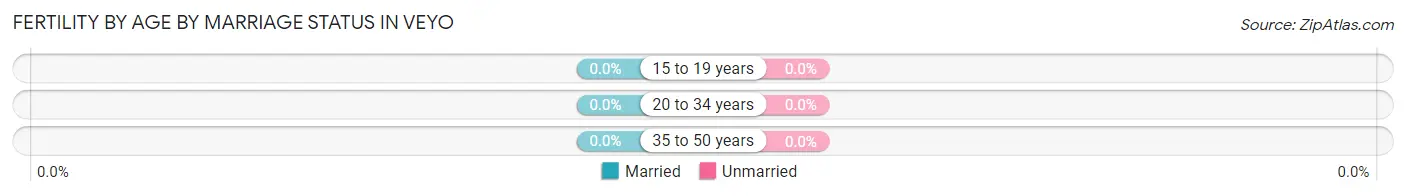
| Age Bracket | Married | Unmarried |
| 15 to 19 years | 0 (0.0%) | 0 (0.0%) |
| 20 to 34 years | 0 (0.0%) | 0 (0.0%) |
| 35 to 50 years | 0 (0.0%) | 0 (0.0%) |
| Total | 0 (0.0%) | 0 (0.0%) |
Fertility by Education in Veyo
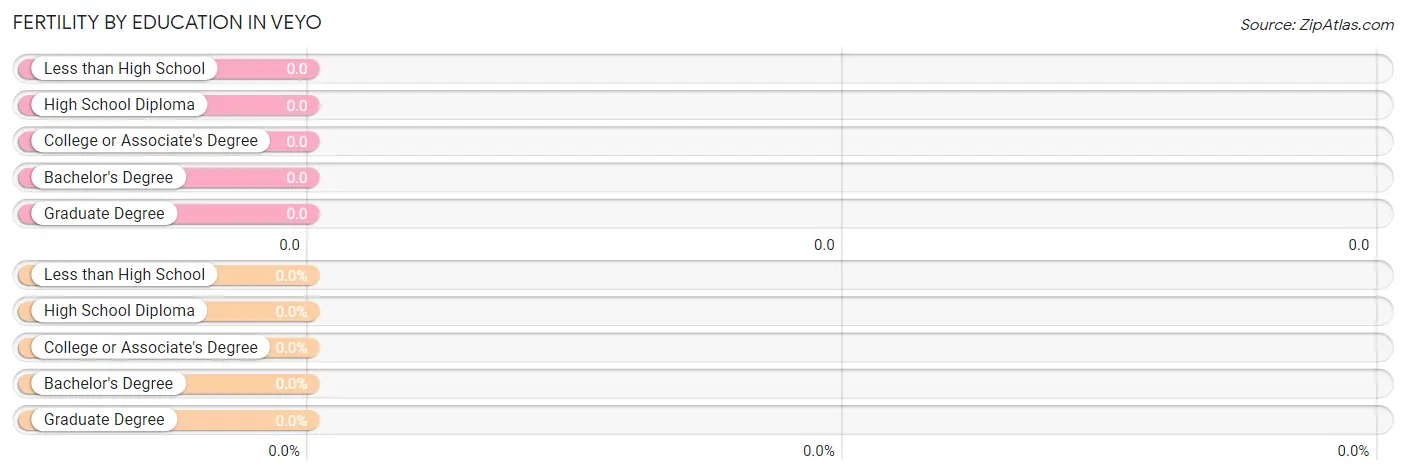
| Educational Attainment | Women with Births | Births / 1,000 Women |
| Less than High School | 0 (0.0%) | 0.0 |
| High School Diploma | 0 (0.0%) | 0.0 |
| College or Associate's Degree | 0 (0.0%) | 0.0 |
| Bachelor's Degree | 0 (0.0%) | 0.0 |
| Graduate Degree | 0 (0.0%) | 0.0 |
| Total | 0 (0.0%) | 0.0 |
Fertility by Education by Marriage Status in Veyo
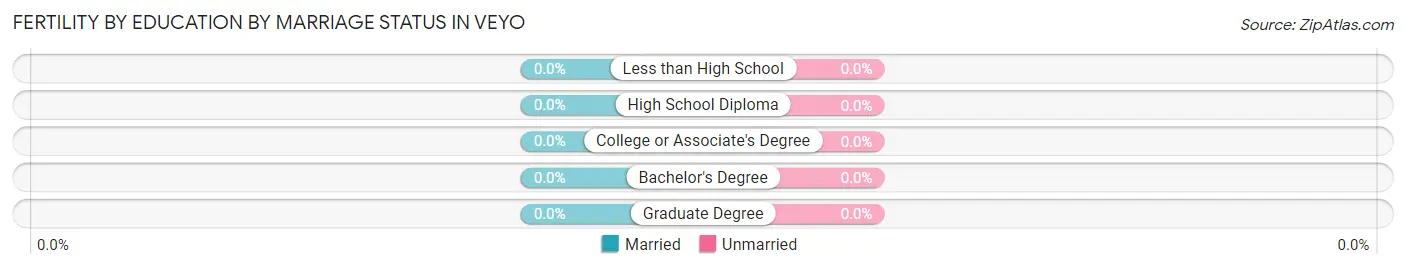
| Educational Attainment | Married | Unmarried |
| Less than High School | 0 (0.0%) | 0 (0.0%) |
| High School Diploma | 0 (0.0%) | 0 (0.0%) |
| College or Associate's Degree | 0 (0.0%) | 0 (0.0%) |
| Bachelor's Degree | 0 (0.0%) | 0 (0.0%) |
| Graduate Degree | 0 (0.0%) | 0 (0.0%) |
| Total | 0 (0.0%) | 0 (0.0%) |
Employment Characteristics in Veyo
Employment by Class of Employer in Veyo
Among the 141 employed individuals in Veyo, private company employees (66 | 46.8%), local government employees (32 | 22.7%), and self-employed (not incorporated) (30 | 21.3%) make up the most common classes of employment.
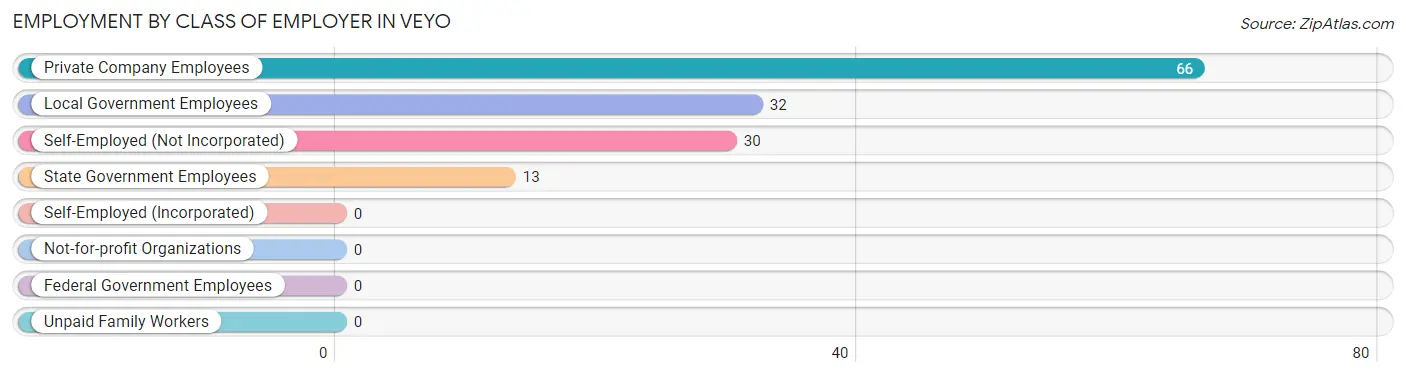
| Employer Class | # Employees | % Employees |
| Private Company Employees | 66 | 46.8% |
| Self-Employed (Incorporated) | 0 | 0.0% |
| Self-Employed (Not Incorporated) | 30 | 21.3% |
| Not-for-profit Organizations | 0 | 0.0% |
| Local Government Employees | 32 | 22.7% |
| State Government Employees | 13 | 9.2% |
| Federal Government Employees | 0 | 0.0% |
| Unpaid Family Workers | 0 | 0.0% |
| Total | 141 | 100.0% |
Employment Status by Age in Veyo
According to the labor force statistics for Veyo, out of the total population over 16 years of age (292), 53.8% or 157 individuals are in the labor force, with 10.2% or 16 of them unemployed. The age group with the highest labor force participation rate is 30 to 34 years, with 100.0% or 13 individuals in the labor force. Within the labor force, the 35 to 44 years age range has the highest percentage of unemployed individuals, with 100.0% or 16 of them being unemployed.
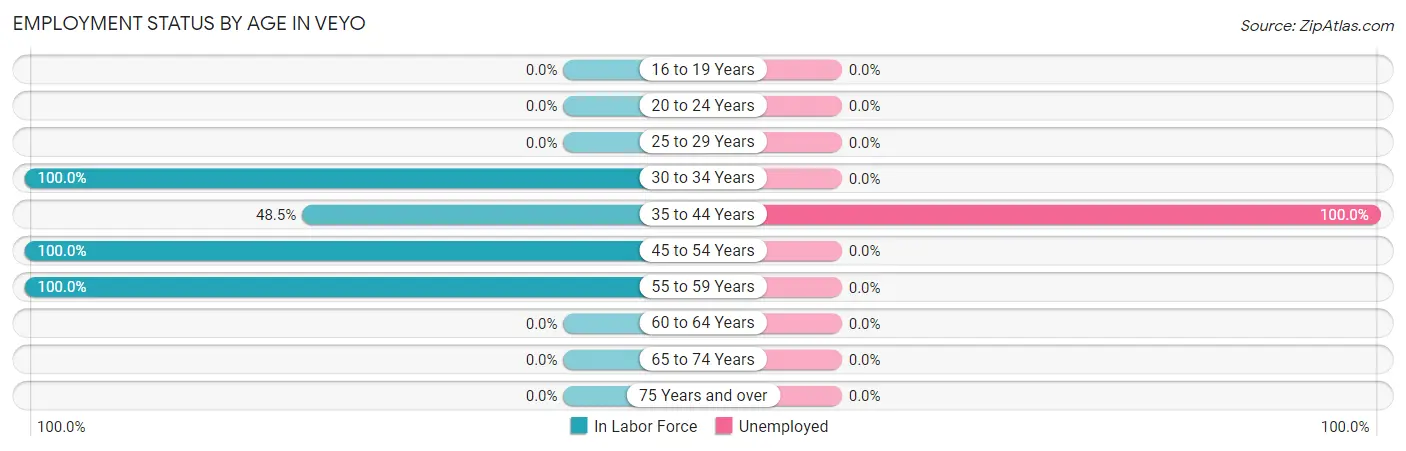
| Age Bracket | In Labor Force | Unemployed |
| 16 to 19 Years | 0 (0.0%) | 0 (0.0%) |
| 20 to 24 Years | 0 (0.0%) | 0 (0.0%) |
| 25 to 29 Years | 0 (0.0%) | 0 (0.0%) |
| 30 to 34 Years | 13 (100.0%) | 0 (0.0%) |
| 35 to 44 Years | 16 (48.5%) | 16 (100.0%) |
| 45 to 54 Years | 32 (100.0%) | 0 (0.0%) |
| 55 to 59 Years | 96 (100.0%) | 0 (0.0%) |
| 60 to 64 Years | 0 (0.0%) | 0 (0.0%) |
| 65 to 74 Years | 0 (0.0%) | 0 (0.0%) |
| 75 Years and over | 0 (0.0%) | 0 (0.0%) |
| Total | 157 (53.8%) | 16 (10.2%) |
Employment Status by Educational Attainment in Veyo
According to labor force statistics for Veyo, 90.2% of individuals (157) out of the total population between 25 and 64 years of age (174) are in the labor force, with 10.2% or 16 of them being unemployed. The group with the highest labor force participation rate are those with the educational attainment of high school diploma, with 100.0% or 64 individuals in the labor force. Within the labor force, individuals with college / associate degree education have the highest percentage of unemployment, with 20.0% or 16 of them being unemployed.
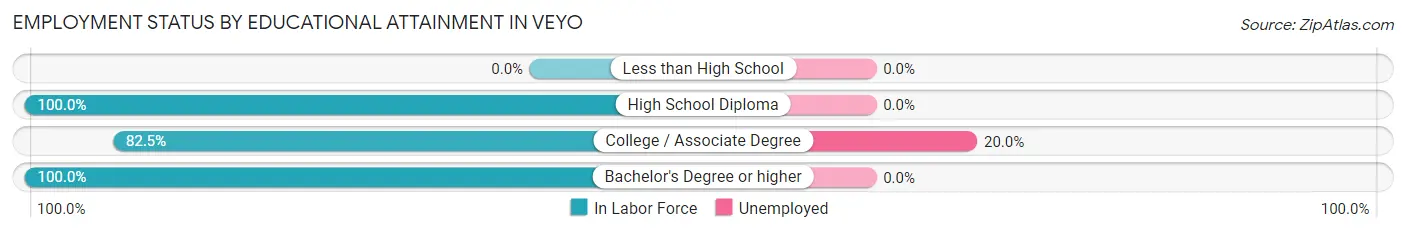
| Educational Attainment | In Labor Force | Unemployed |
| Less than High School | 0 (0.0%) | 0 (0.0%) |
| High School Diploma | 64 (100.0%) | 0 (0.0%) |
| College / Associate Degree | 80 (82.5%) | 19 (20.0%) |
| Bachelor's Degree or higher | 13 (100.0%) | 0 (0.0%) |
| Total | 157 (90.2%) | 18 (10.2%) |
Employment Occupations by Sex in Veyo
Management, Business, Science and Arts Occupations
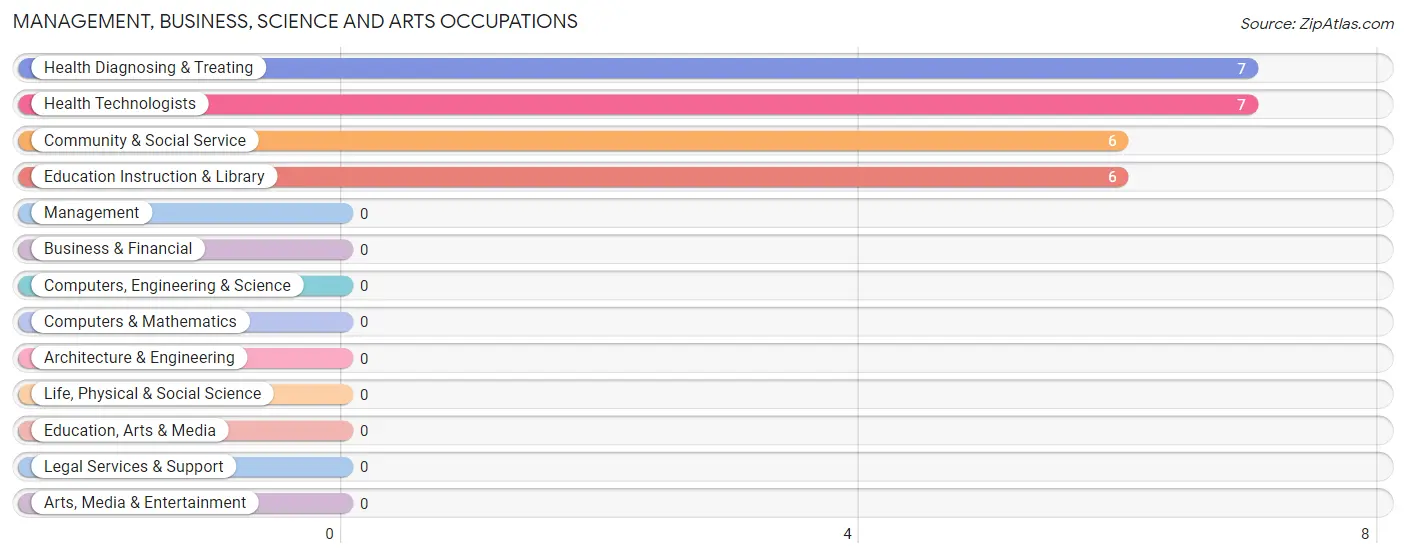
The most common Management, Business, Science and Arts occupations in Veyo are Health Diagnosing & Treating (7 | 5.0%), Health Technologists (7 | 5.0%), Community & Social Service (6 | 4.3%), and Education Instruction & Library (6 | 4.3%).
Management, Business, Science and Arts Occupations by Sex
Within the Management, Business, Science and Arts occupations in Veyo, the most male-oriented occupations are Community & Social Service (100.0%), and Education Instruction & Library (100.0%), while the most female-oriented occupations are Health Diagnosing & Treating (100.0%), and Health Technologists (100.0%).
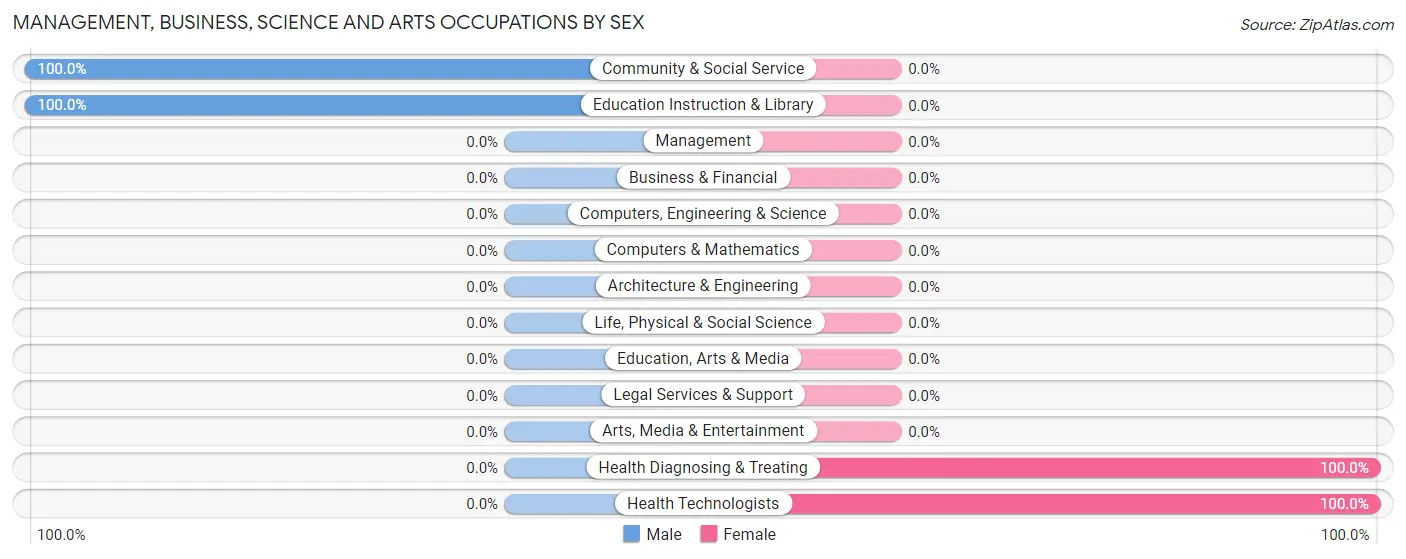
| Occupation | Male | Female |
| Management | 0 (0.0%) | 0 (0.0%) |
| Business & Financial | 0 (0.0%) | 0 (0.0%) |
| Computers, Engineering & Science | 0 (0.0%) | 0 (0.0%) |
| Computers & Mathematics | 0 (0.0%) | 0 (0.0%) |
| Architecture & Engineering | 0 (0.0%) | 0 (0.0%) |
| Life, Physical & Social Science | 0 (0.0%) | 0 (0.0%) |
| Community & Social Service | 6 (100.0%) | 0 (0.0%) |
| Education, Arts & Media | 0 (0.0%) | 0 (0.0%) |
| Legal Services & Support | 0 (0.0%) | 0 (0.0%) |
| Education Instruction & Library | 6 (100.0%) | 0 (0.0%) |
| Arts, Media & Entertainment | 0 (0.0%) | 0 (0.0%) |
| Health Diagnosing & Treating | 0 (0.0%) | 7 (100.0%) |
| Health Technologists | 0 (0.0%) | 7 (100.0%) |
| Total (Category) | 6 (46.2%) | 7 (53.8%) |
| Total (Overall) | 72 (51.1%) | 69 (48.9%) |
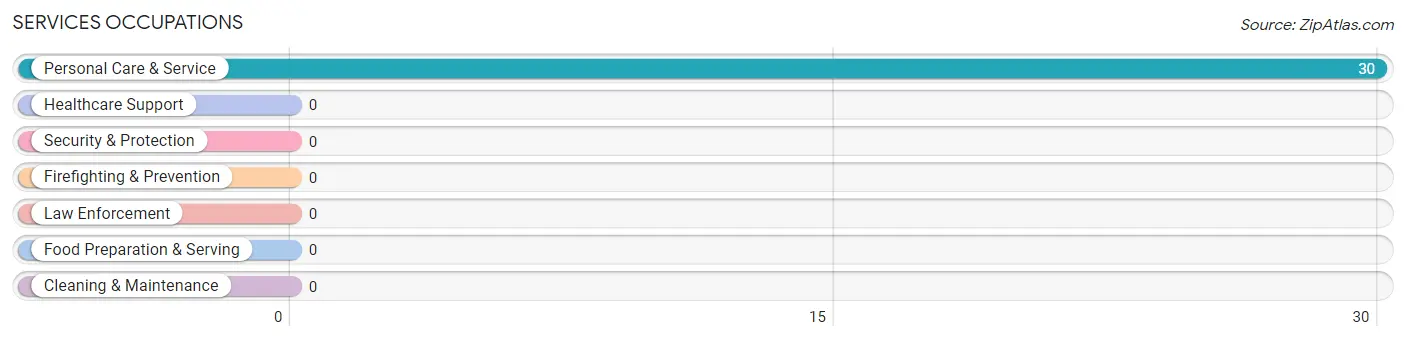
Services Occupations
The most common Services occupations in Veyo are , and Personal Care & Service (30 | 21.3%).
Services Occupations by Sex
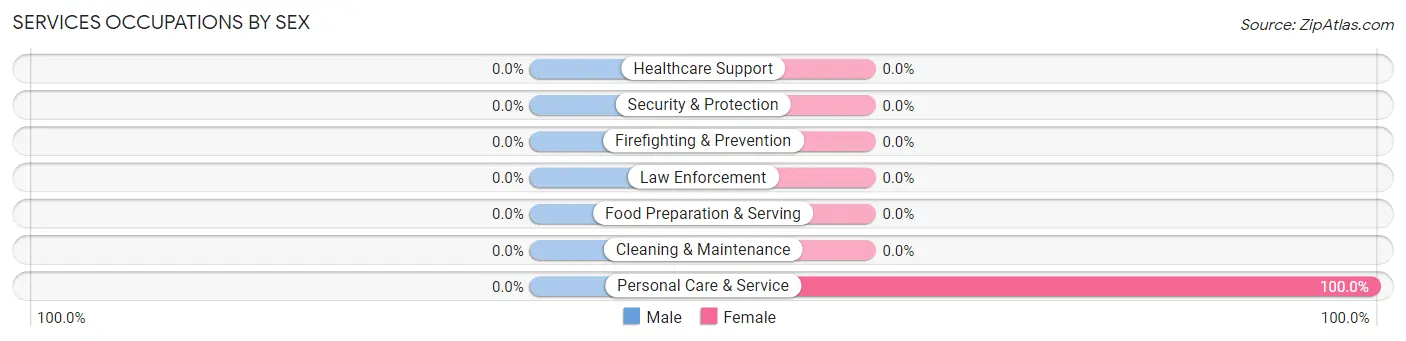
| Occupation | Male | Female |
| Healthcare Support | 0 (0.0%) | 0 (0.0%) |
| Security & Protection | 0 (0.0%) | 0 (0.0%) |
| Firefighting & Prevention | 0 (0.0%) | 0 (0.0%) |
| Law Enforcement | 0 (0.0%) | 0 (0.0%) |
| Food Preparation & Serving | 0 (0.0%) | 0 (0.0%) |
| Cleaning & Maintenance | 0 (0.0%) | 0 (0.0%) |
| Personal Care & Service | 0 (0.0%) | 30 (100.0%) |
| Total (Category) | 0 (0.0%) | 30 (100.0%) |
| Total (Overall) | 72 (51.1%) | 69 (48.9%) |
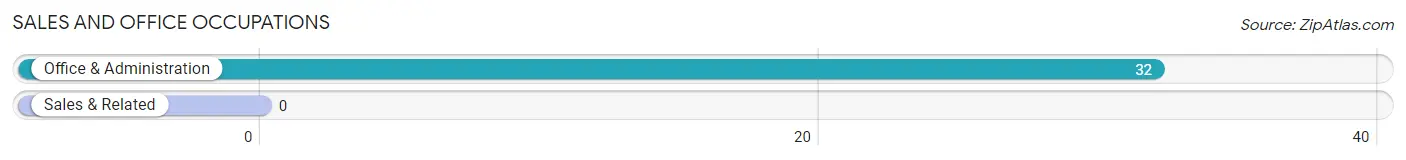
Sales and Office Occupations
The most common Sales and Office occupations in Veyo are , and Office & Administration (32 | 22.7%).
Sales and Office Occupations by Sex
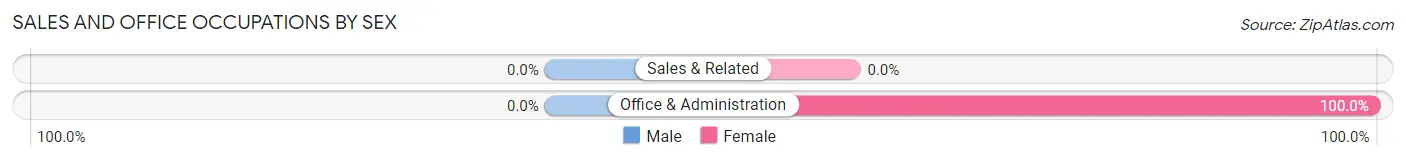
| Occupation | Male | Female |
| Sales & Related | 0 (0.0%) | 0 (0.0%) |
| Office & Administration | 0 (0.0%) | 32 (100.0%) |
| Total (Category) | 0 (0.0%) | 32 (100.0%) |
| Total (Overall) | 72 (51.1%) | 69 (48.9%) |
Natural Resources, Construction and Maintenance Occupations
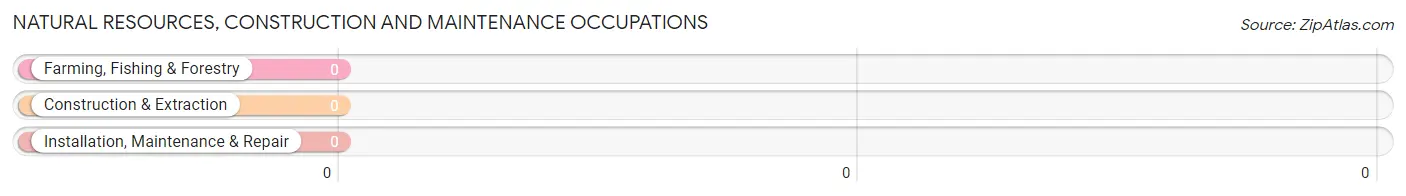
Natural Resources, Construction and Maintenance Occupations by Sex
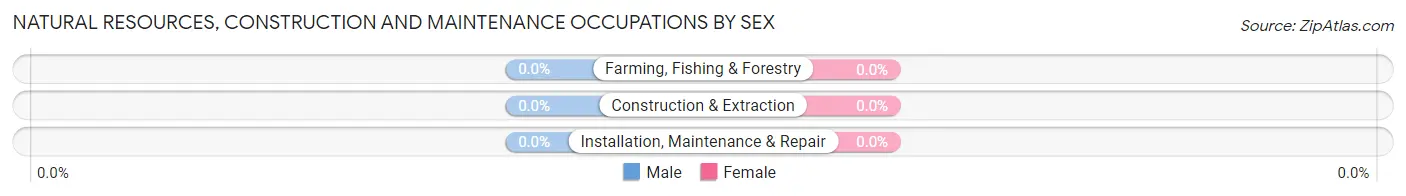
| Occupation | Male | Female |
| Farming, Fishing & Forestry | 0 (0.0%) | 0 (0.0%) |
| Construction & Extraction | 0 (0.0%) | 0 (0.0%) |
| Installation, Maintenance & Repair | 0 (0.0%) | 0 (0.0%) |
| Total (Category) | 0 (0.0%) | 0 (0.0%) |
| Total (Overall) | 72 (51.1%) | 69 (48.9%) |
Production, Transportation and Moving Occupations
The most common Production, Transportation and Moving occupations in Veyo are Transportation (34 | 24.1%), and Production (32 | 22.7%).
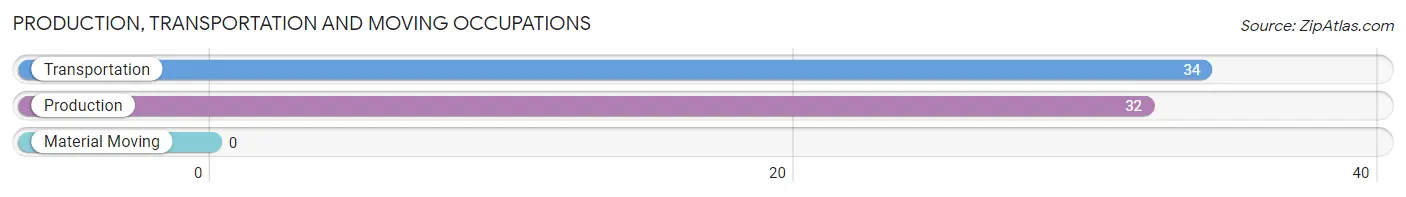
Production, Transportation and Moving Occupations by Sex
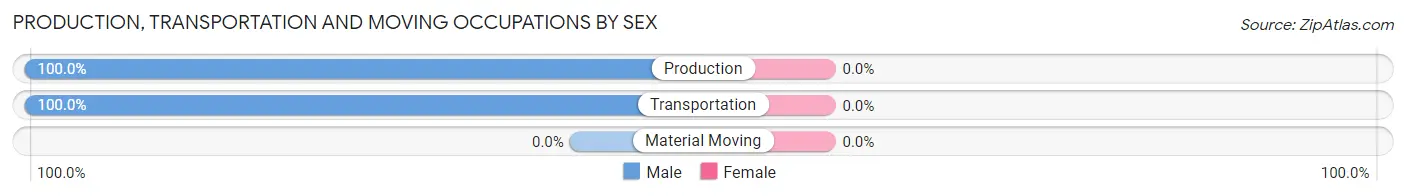
| Occupation | Male | Female |
| Production | 32 (100.0%) | 0 (0.0%) |
| Transportation | 34 (100.0%) | 0 (0.0%) |
| Material Moving | 0 (0.0%) | 0 (0.0%) |
| Total (Category) | 66 (100.0%) | 0 (0.0%) |
| Total (Overall) | 72 (51.1%) | 69 (48.9%) |
Employment Industries by Sex in Veyo
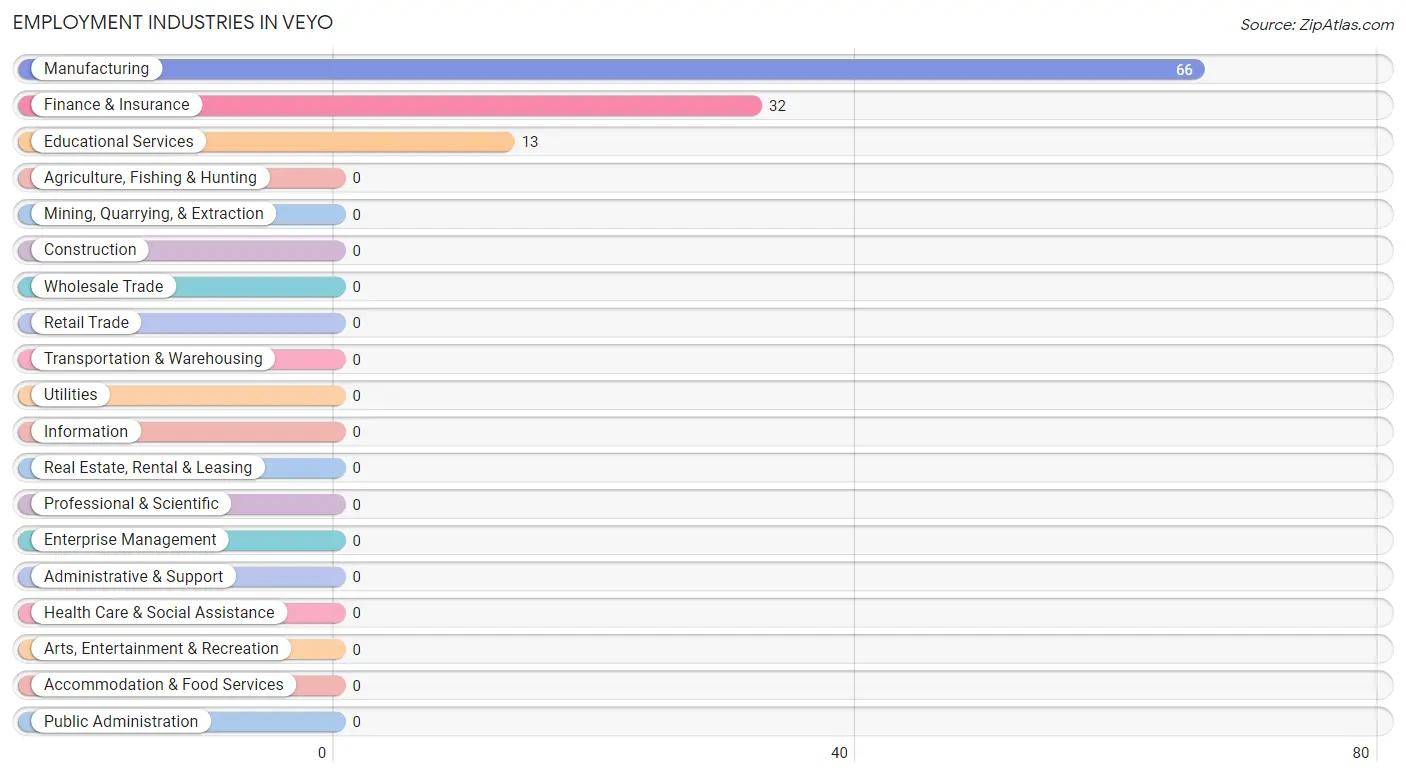
Employment Industries in Veyo
The major employment industries in Veyo include Manufacturing (66 | 46.8%), Finance & Insurance (32 | 22.7%), and Educational Services (13 | 9.2%).
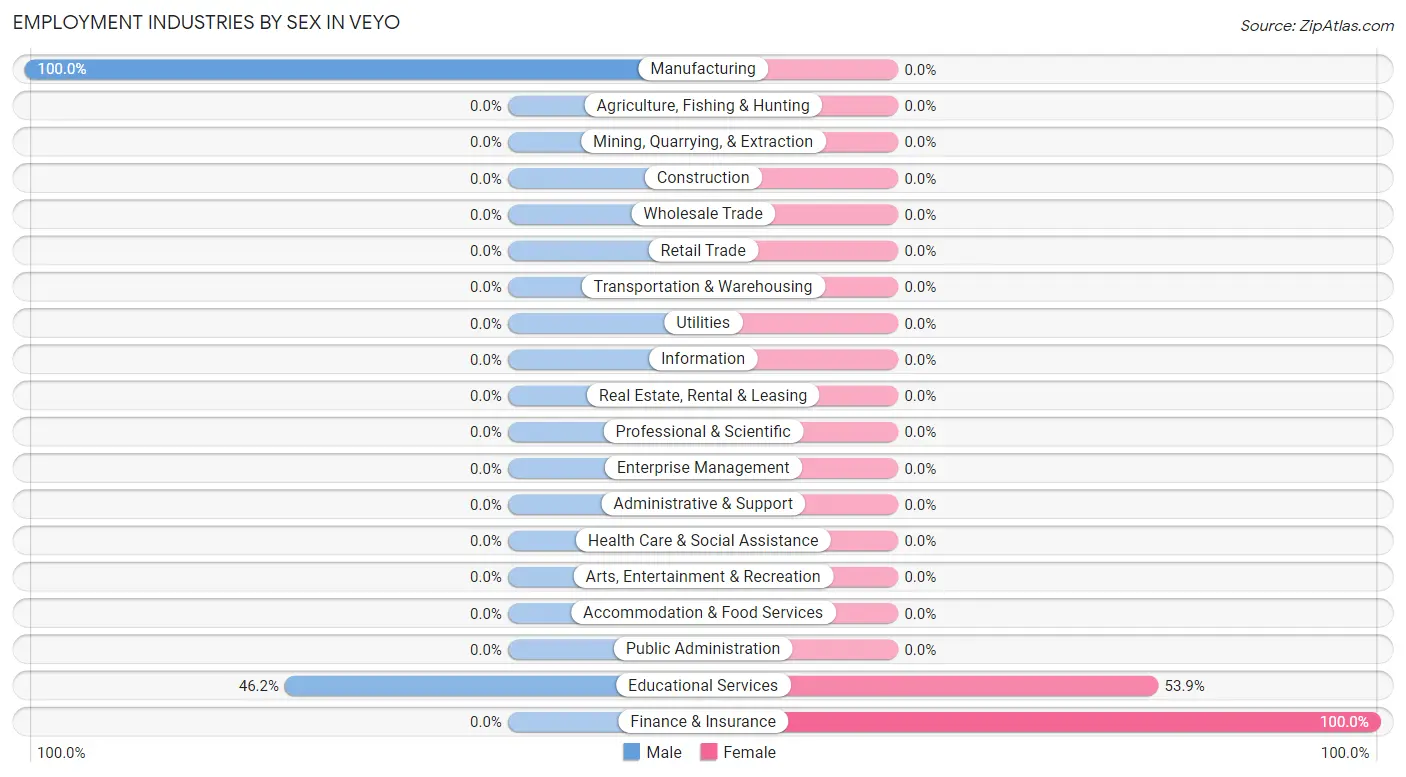
Employment Industries by Sex in Veyo
The Veyo industries that see more men than women are Manufacturing (100.0%), and Educational Services (46.2%), whereas the industries that tend to have a higher number of women are Finance & Insurance (100.0%), and Educational Services (53.8%).
| Industry | Male | Female |
| Agriculture, Fishing & Hunting | 0 (0.0%) | 0 (0.0%) |
| Mining, Quarrying, & Extraction | 0 (0.0%) | 0 (0.0%) |
| Construction | 0 (0.0%) | 0 (0.0%) |
| Manufacturing | 66 (100.0%) | 0 (0.0%) |
| Wholesale Trade | 0 (0.0%) | 0 (0.0%) |
| Retail Trade | 0 (0.0%) | 0 (0.0%) |
| Transportation & Warehousing | 0 (0.0%) | 0 (0.0%) |
| Utilities | 0 (0.0%) | 0 (0.0%) |
| Information | 0 (0.0%) | 0 (0.0%) |
| Finance & Insurance | 0 (0.0%) | 32 (100.0%) |
| Real Estate, Rental & Leasing | 0 (0.0%) | 0 (0.0%) |
| Professional & Scientific | 0 (0.0%) | 0 (0.0%) |
| Enterprise Management | 0 (0.0%) | 0 (0.0%) |
| Administrative & Support | 0 (0.0%) | 0 (0.0%) |
| Educational Services | 6 (46.2%) | 7 (53.8%) |
| Health Care & Social Assistance | 0 (0.0%) | 0 (0.0%) |
| Arts, Entertainment & Recreation | 0 (0.0%) | 0 (0.0%) |
| Accommodation & Food Services | 0 (0.0%) | 0 (0.0%) |
| Public Administration | 0 (0.0%) | 0 (0.0%) |
| Total | 72 (51.1%) | 69 (48.9%) |
Education in Veyo
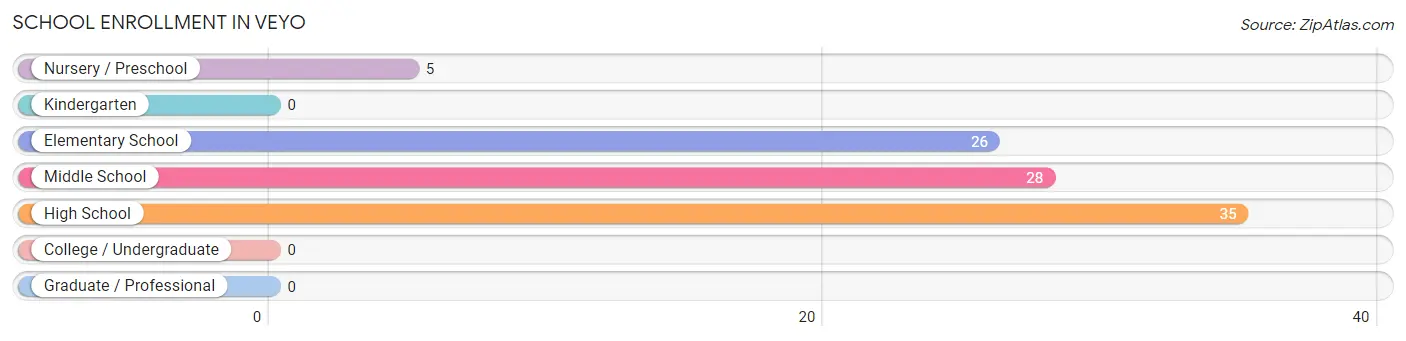
School Enrollment in Veyo
The most common levels of schooling among the 94 students in Veyo are high school (35 | 37.2%), middle school (28 | 29.8%), and elementary school (26 | 27.7%).
| School Level | # Students | % Students |
| Nursery / Preschool | 5 | 5.3% |
| Kindergarten | 0 | 0.0% |
| Elementary School | 26 | 27.7% |
| Middle School | 28 | 29.8% |
| High School | 35 | 37.2% |
| College / Undergraduate | 0 | 0.0% |
| Graduate / Professional | 0 | 0.0% |
| Total | 94 | 100.0% |
School Enrollment by Age by Funding Source in Veyo
Out of a total of 94 students who are enrolled in schools in Veyo, 5 (5.3%) attend a private institution, while the remaining 89 (94.7%) are enrolled in public schools. The age group of 3 to 4 year olds has the highest likelihood of being enrolled in private schools, with 5 (100.0% in the age bracket) enrolled. Conversely, the age group of 5 to 9 year old has the lowest likelihood of being enrolled in a private school, with 26 (100.0% in the age bracket) attending a public institution.
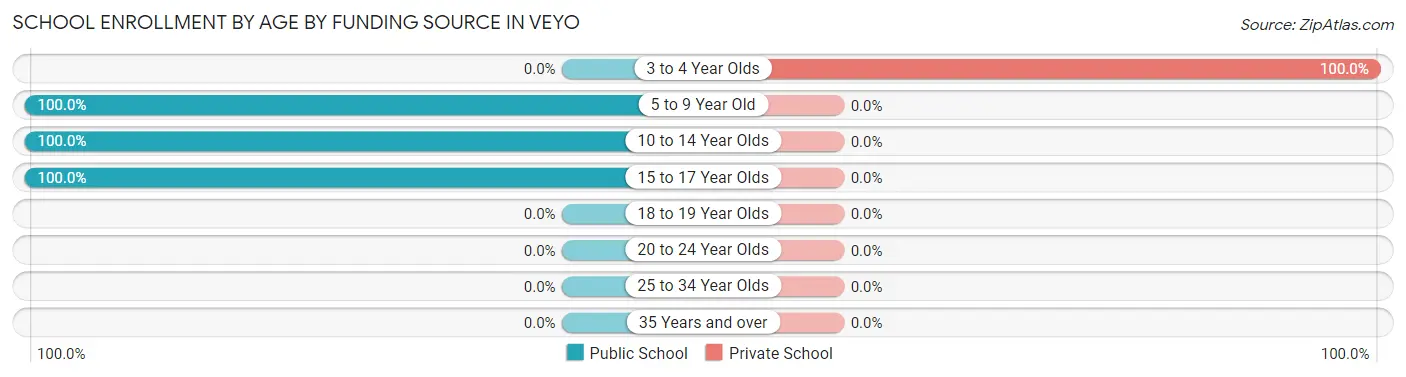
| Age Bracket | Public School | Private School |
| 3 to 4 Year Olds | 0 (0.0%) | 5 (100.0%) |
| 5 to 9 Year Old | 26 (100.0%) | 0 (0.0%) |
| 10 to 14 Year Olds | 28 (100.0%) | 0 (0.0%) |
| 15 to 17 Year Olds | 35 (100.0%) | 0 (0.0%) |
| 18 to 19 Year Olds | 0 (0.0%) | 0 (0.0%) |
| 20 to 24 Year Olds | 0 (0.0%) | 0 (0.0%) |
| 25 to 34 Year Olds | 0 (0.0%) | 0 (0.0%) |
| 35 Years and over | 0 (0.0%) | 0 (0.0%) |
| Total | 89 (94.7%) | 5 (5.3%) |
Educational Attainment by Field of Study in Veyo
Social sciences (19 | 29.2%), liberal arts & history (19 | 29.2%), physical & health sciences (14 | 21.5%), science & technology (7 | 10.8%), and bio, nature & agricultural (6 | 9.2%) are the most common fields of study among 65 individuals in Veyo who have obtained a bachelor's degree or higher.
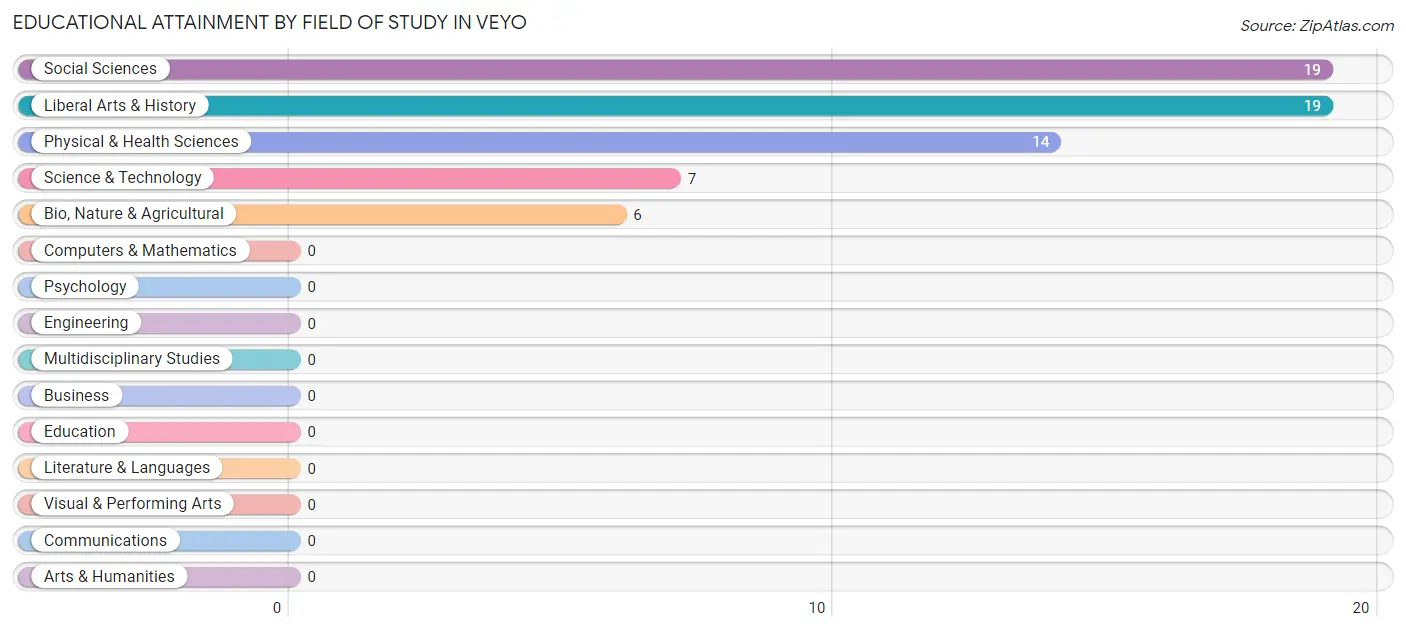
| Field of Study | # Graduates | % Graduates |
| Computers & Mathematics | 0 | 0.0% |
| Bio, Nature & Agricultural | 6 | 9.2% |
| Physical & Health Sciences | 14 | 21.5% |
| Psychology | 0 | 0.0% |
| Social Sciences | 19 | 29.2% |
| Engineering | 0 | 0.0% |
| Multidisciplinary Studies | 0 | 0.0% |
| Science & Technology | 7 | 10.8% |
| Business | 0 | 0.0% |
| Education | 0 | 0.0% |
| Literature & Languages | 0 | 0.0% |
| Liberal Arts & History | 19 | 29.2% |
| Visual & Performing Arts | 0 | 0.0% |
| Communications | 0 | 0.0% |
| Arts & Humanities | 0 | 0.0% |
| Total | 65 | 100.0% |
Transportation & Commute in Veyo
Vehicle Availability by Sex in Veyo
The most prevalent vehicle ownership categories in Veyo are males with 2 vehicles (38, accounting for 52.8%) and females with 2 vehicles (39, making up 55.1%).
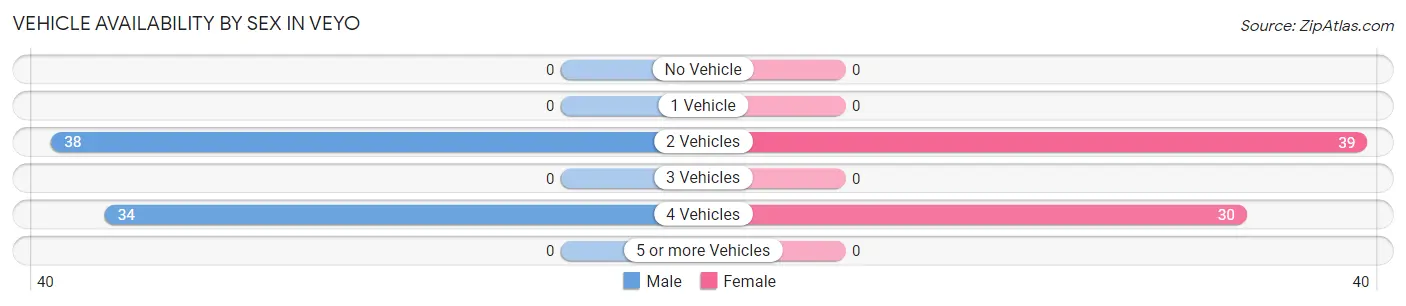
| Vehicles Available | Male | Female |
| No Vehicle | 0 (0.0%) | 0 (0.0%) |
| 1 Vehicle | 0 (0.0%) | 0 (0.0%) |
| 2 Vehicles | 38 (52.8%) | 39 (56.5%) |
| 3 Vehicles | 0 (0.0%) | 0 (0.0%) |
| 4 Vehicles | 34 (47.2%) | 30 (43.5%) |
| 5 or more Vehicles | 0 (0.0%) | 0 (0.0%) |
| Total | 72 (100.0%) | 69 (100.0%) |
Commute Time in Veyo
The most frequently occuring commute durations in Veyo are 25 to 29 minutes (66 commuters, 46.8%), 20 to 24 minutes (32 commuters, 22.7%), and 35 to 39 minutes (30 commuters, 21.3%).
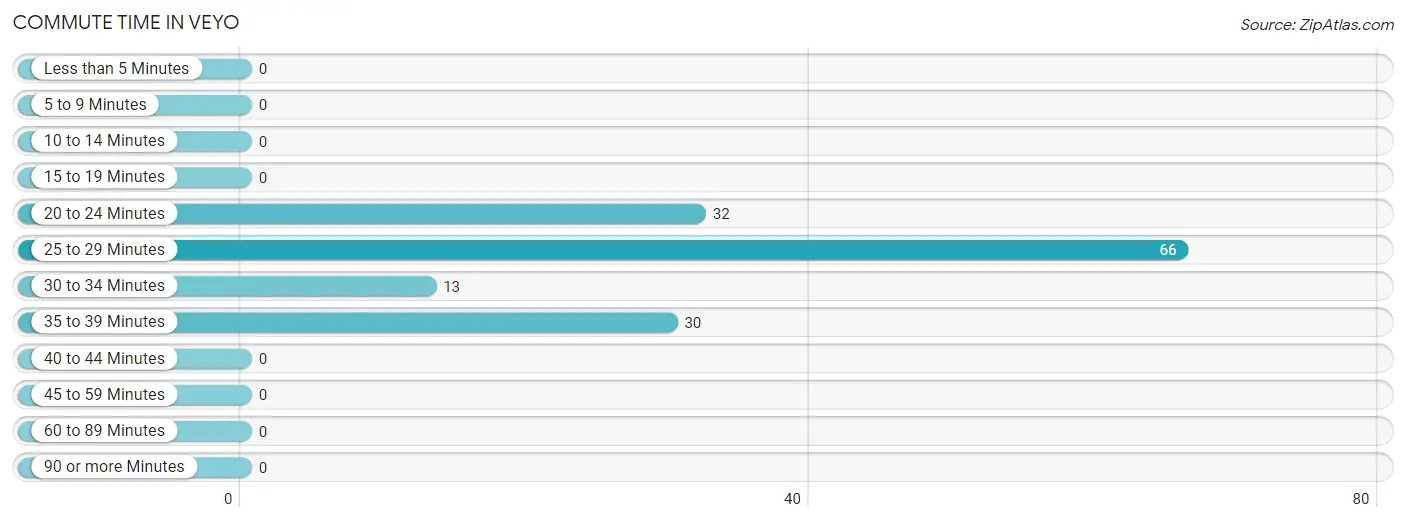
| Commute Time | # Commuters | % Commuters |
| Less than 5 Minutes | 0 | 0.0% |
| 5 to 9 Minutes | 0 | 0.0% |
| 10 to 14 Minutes | 0 | 0.0% |
| 15 to 19 Minutes | 0 | 0.0% |
| 20 to 24 Minutes | 32 | 22.7% |
| 25 to 29 Minutes | 66 | 46.8% |
| 30 to 34 Minutes | 13 | 9.2% |
| 35 to 39 Minutes | 30 | 21.3% |
| 40 to 44 Minutes | 0 | 0.0% |
| 45 to 59 Minutes | 0 | 0.0% |
| 60 to 89 Minutes | 0 | 0.0% |
| 90 or more Minutes | 0 | 0.0% |
Commute Time by Sex in Veyo
The most common commute times in Veyo are 25 to 29 minutes (34 commuters, 47.2%) for males and 25 to 29 minutes (32 commuters, 46.4%) for females.
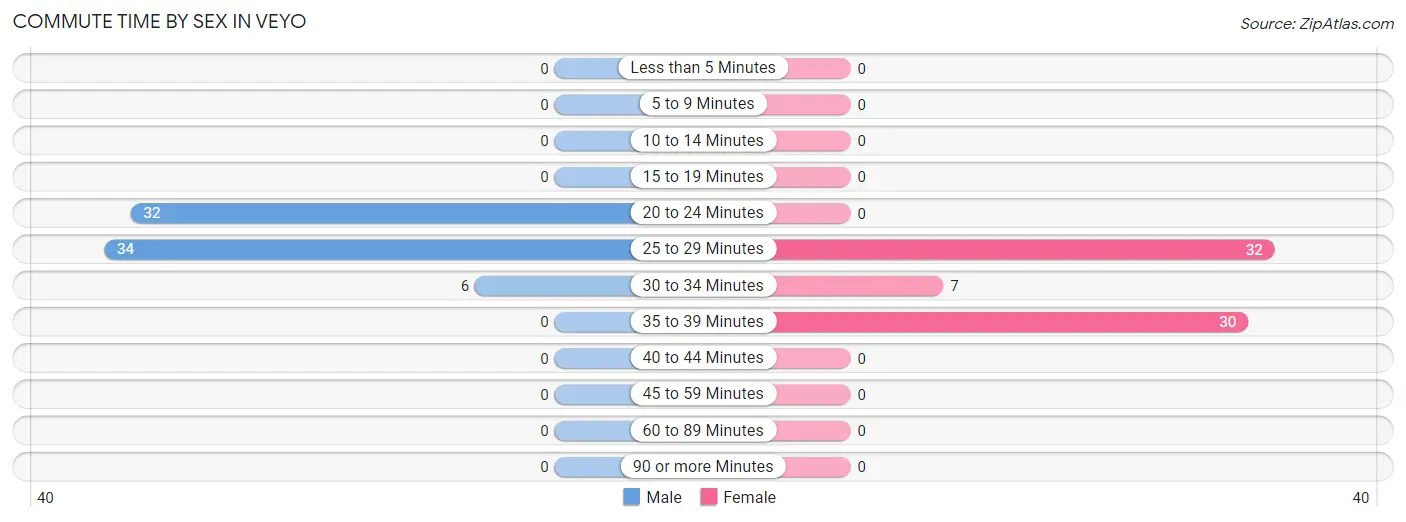
| Commute Time | Male | Female |
| Less than 5 Minutes | 0 (0.0%) | 0 (0.0%) |
| 5 to 9 Minutes | 0 (0.0%) | 0 (0.0%) |
| 10 to 14 Minutes | 0 (0.0%) | 0 (0.0%) |
| 15 to 19 Minutes | 0 (0.0%) | 0 (0.0%) |
| 20 to 24 Minutes | 32 (44.4%) | 0 (0.0%) |
| 25 to 29 Minutes | 34 (47.2%) | 32 (46.4%) |
| 30 to 34 Minutes | 6 (8.3%) | 7 (10.1%) |
| 35 to 39 Minutes | 0 (0.0%) | 30 (43.5%) |
| 40 to 44 Minutes | 0 (0.0%) | 0 (0.0%) |
| 45 to 59 Minutes | 0 (0.0%) | 0 (0.0%) |
| 60 to 89 Minutes | 0 (0.0%) | 0 (0.0%) |
| 90 or more Minutes | 0 (0.0%) | 0 (0.0%) |
Time of Departure to Work by Sex in Veyo
The most frequent times of departure to work in Veyo are 12:00 AM to 4:59 AM (34, 47.2%) for males and 7:30 AM to 7:59 AM (32, 46.4%) for females.
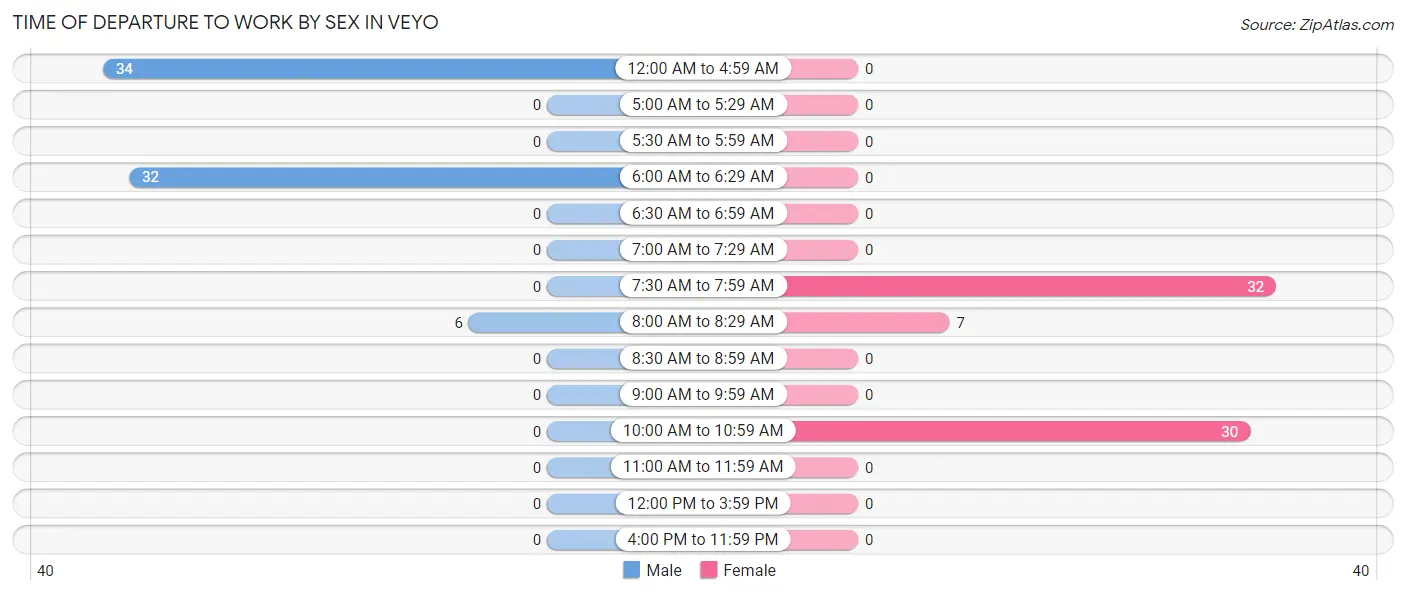
| Time of Departure | Male | Female |
| 12:00 AM to 4:59 AM | 34 (47.2%) | 0 (0.0%) |
| 5:00 AM to 5:29 AM | 0 (0.0%) | 0 (0.0%) |
| 5:30 AM to 5:59 AM | 0 (0.0%) | 0 (0.0%) |
| 6:00 AM to 6:29 AM | 32 (44.4%) | 0 (0.0%) |
| 6:30 AM to 6:59 AM | 0 (0.0%) | 0 (0.0%) |
| 7:00 AM to 7:29 AM | 0 (0.0%) | 0 (0.0%) |
| 7:30 AM to 7:59 AM | 0 (0.0%) | 32 (46.4%) |
| 8:00 AM to 8:29 AM | 6 (8.3%) | 7 (10.1%) |
| 8:30 AM to 8:59 AM | 0 (0.0%) | 0 (0.0%) |
| 9:00 AM to 9:59 AM | 0 (0.0%) | 0 (0.0%) |
| 10:00 AM to 10:59 AM | 0 (0.0%) | 30 (43.5%) |
| 11:00 AM to 11:59 AM | 0 (0.0%) | 0 (0.0%) |
| 12:00 PM to 3:59 PM | 0 (0.0%) | 0 (0.0%) |
| 4:00 PM to 11:59 PM | 0 (0.0%) | 0 (0.0%) |
| Total | 72 (100.0%) | 69 (100.0%) |
Housing Occupancy in Veyo
Occupancy by Ownership in Veyo
Of the total 132 dwellings in Veyo, owner-occupied units account for 132 (100.0%), while renter-occupied units make up 0 (0.0%).
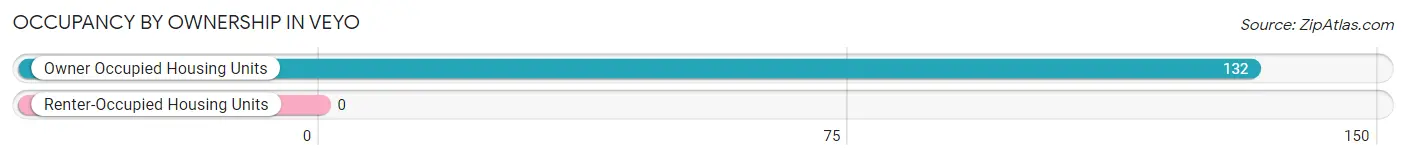
| Occupancy | # Housing Units | % Housing Units |
| Owner Occupied Housing Units | 132 | 100.0% |
| Renter-Occupied Housing Units | 0 | 0.0% |
| Total Occupied Housing Units | 132 | 100.0% |
Occupancy by Household Size in Veyo
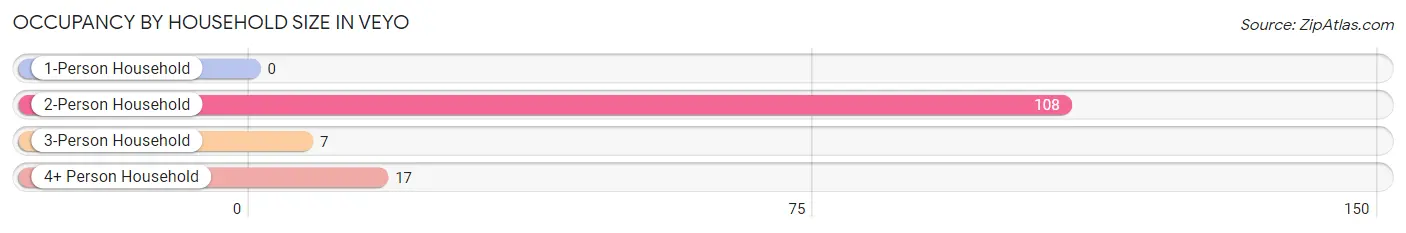
| Household Size | # Housing Units | % Housing Units |
| 1-Person Household | 0 | 0.0% |
| 2-Person Household | 108 | 81.8% |
| 3-Person Household | 7 | 5.3% |
| 4+ Person Household | 17 | 12.9% |
| Total Housing Units | 132 | 100.0% |
Occupancy by Ownership by Household Size in Veyo
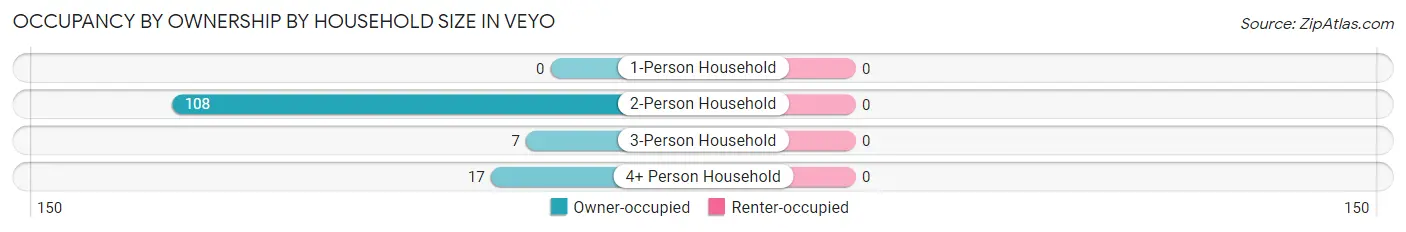
| Household Size | Owner-occupied | Renter-occupied |
| 1-Person Household | 0 (0.0%) | 0 (0.0%) |
| 2-Person Household | 108 (100.0%) | 0 (0.0%) |
| 3-Person Household | 7 (100.0%) | 0 (0.0%) |
| 4+ Person Household | 17 (100.0%) | 0 (0.0%) |
| Total Housing Units | 132 (100.0%) | 0 (0.0%) |
Occupancy by Educational Attainment in Veyo
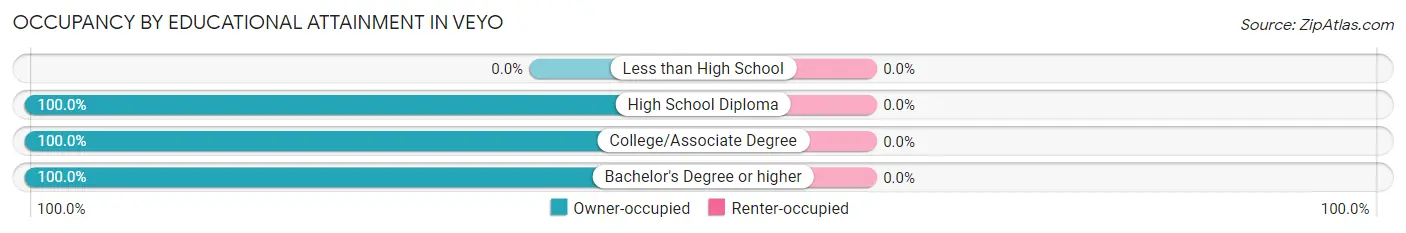
| Household Size | Owner-occupied | Renter-occupied |
| Less than High School | 0 (0.0%) | 0 (0.0%) |
| High School Diploma | 63 (100.0%) | 0 (0.0%) |
| College/Associate Degree | 62 (100.0%) | 0 (0.0%) |
| Bachelor's Degree or higher | 7 (100.0%) | 0 (0.0%) |
Occupancy by Age of Householder in Veyo
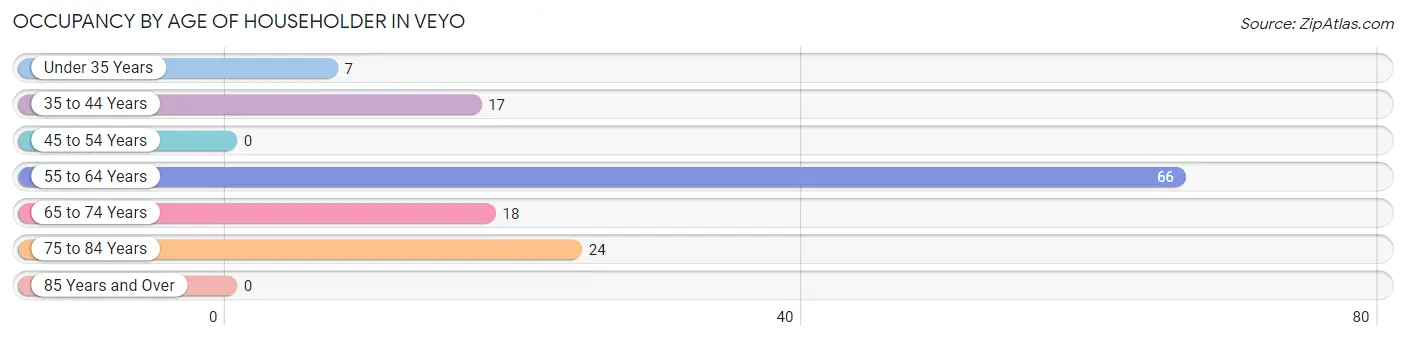
| Age Bracket | # Households | % Households |
| Under 35 Years | 7 | 5.3% |
| 35 to 44 Years | 17 | 12.9% |
| 45 to 54 Years | 0 | 0.0% |
| 55 to 64 Years | 66 | 50.0% |
| 65 to 74 Years | 18 | 13.6% |
| 75 to 84 Years | 24 | 18.2% |
| 85 Years and Over | 0 | 0.0% |
| Total | 132 | 100.0% |
Housing Finances in Veyo
Median Income by Occupancy in Veyo
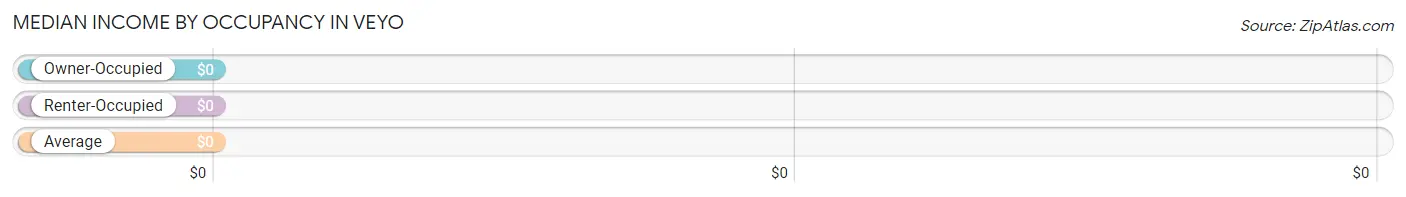
| Occupancy Type | # Households | Median Income |
| Owner-Occupied | 132 (100.0%) | $0 |
| Renter-Occupied | 0 (0.0%) | $0 |
| Average | 132 (100.0%) | $0 |
Occupancy by Householder Income Bracket in Veyo
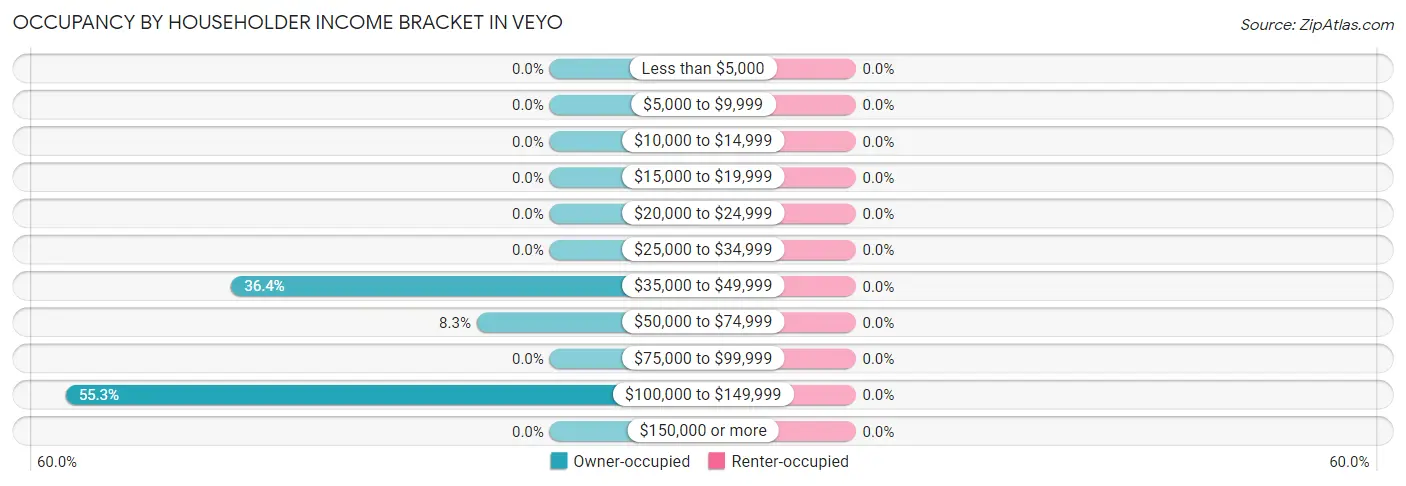
| Income Bracket | Owner-occupied | Renter-occupied |
| Less than $5,000 | 0 (0.0%) | 0 (0.0%) |
| $5,000 to $9,999 | 0 (0.0%) | 0 (0.0%) |
| $10,000 to $14,999 | 0 (0.0%) | 0 (0.0%) |
| $15,000 to $19,999 | 0 (0.0%) | 0 (0.0%) |
| $20,000 to $24,999 | 0 (0.0%) | 0 (0.0%) |
| $25,000 to $34,999 | 0 (0.0%) | 0 (0.0%) |
| $35,000 to $49,999 | 48 (36.4%) | 0 (0.0%) |
| $50,000 to $74,999 | 11 (8.3%) | 0 (0.0%) |
| $75,000 to $99,999 | 0 (0.0%) | 0 (0.0%) |
| $100,000 to $149,999 | 73 (55.3%) | 0 (0.0%) |
| $150,000 or more | 0 (0.0%) | 0 (0.0%) |
| Total | 132 (100.0%) | 0 (0.0%) |
Monthly Housing Cost Tiers in Veyo
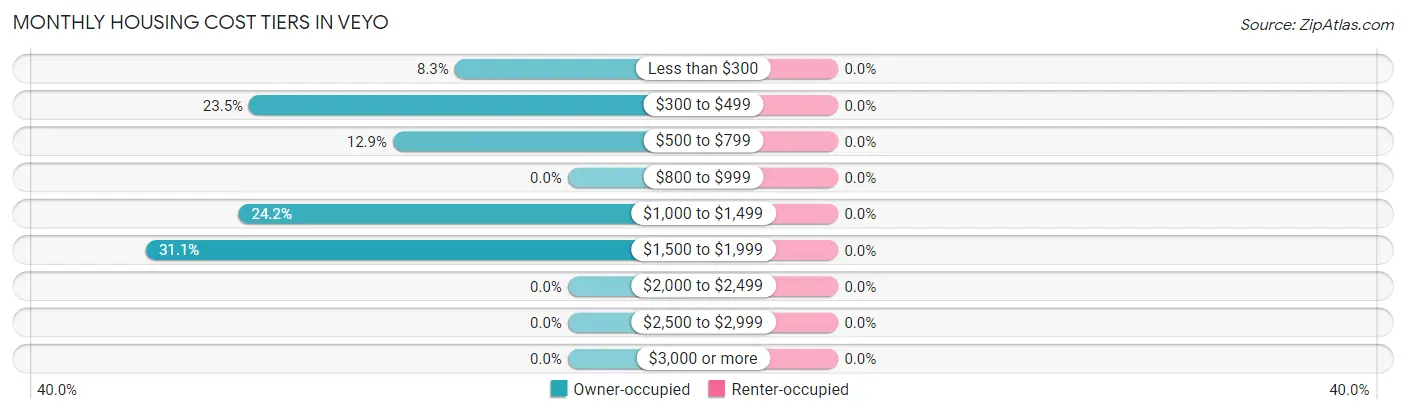
| Monthly Cost | Owner-occupied | Renter-occupied |
| Less than $300 | 11 (8.3%) | 0 (0.0%) |
| $300 to $499 | 31 (23.5%) | 0 (0.0%) |
| $500 to $799 | 17 (12.9%) | 0 (0.0%) |
| $800 to $999 | 0 (0.0%) | 0 (0.0%) |
| $1,000 to $1,499 | 32 (24.2%) | 0 (0.0%) |
| $1,500 to $1,999 | 41 (31.1%) | 0 (0.0%) |
| $2,000 to $2,499 | 0 (0.0%) | 0 (0.0%) |
| $2,500 to $2,999 | 0 (0.0%) | 0 (0.0%) |
| $3,000 or more | 0 (0.0%) | 0 (0.0%) |
| Total | 132 (100.0%) | 0 (0.0%) |
Physical Housing Characteristics in Veyo
Housing Structures in Veyo
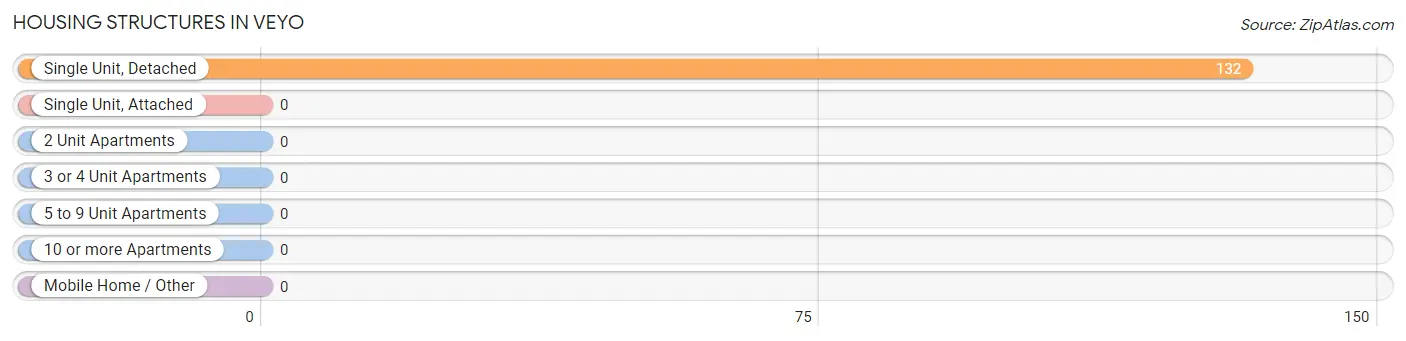
| Structure Type | # Housing Units | % Housing Units |
| Single Unit, Detached | 132 | 100.0% |
| Single Unit, Attached | 0 | 0.0% |
| 2 Unit Apartments | 0 | 0.0% |
| 3 or 4 Unit Apartments | 0 | 0.0% |
| 5 to 9 Unit Apartments | 0 | 0.0% |
| 10 or more Apartments | 0 | 0.0% |
| Mobile Home / Other | 0 | 0.0% |
| Total | 132 | 100.0% |
Housing Structures by Occupancy in Veyo
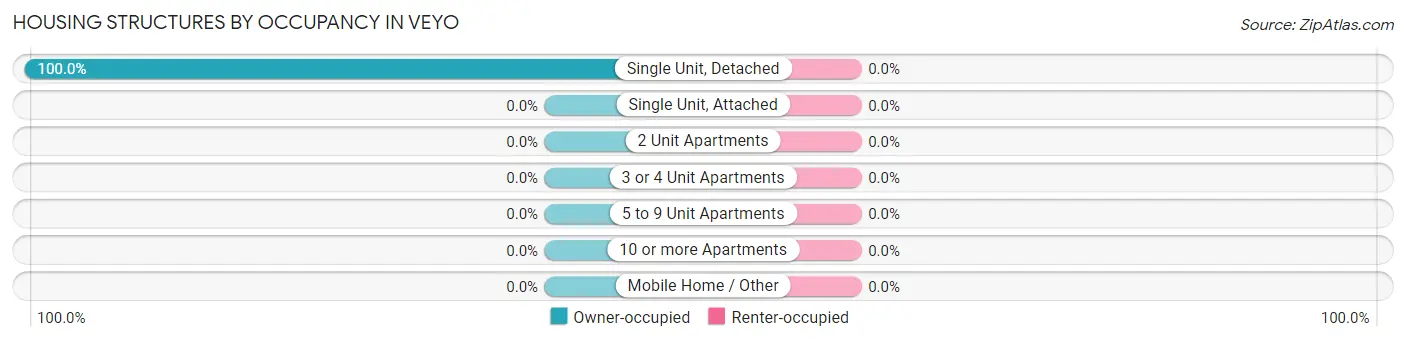
| Structure Type | Owner-occupied | Renter-occupied |
| Single Unit, Detached | 132 (100.0%) | 0 (0.0%) |
| Single Unit, Attached | 0 (0.0%) | 0 (0.0%) |
| 2 Unit Apartments | 0 (0.0%) | 0 (0.0%) |
| 3 or 4 Unit Apartments | 0 (0.0%) | 0 (0.0%) |
| 5 to 9 Unit Apartments | 0 (0.0%) | 0 (0.0%) |
| 10 or more Apartments | 0 (0.0%) | 0 (0.0%) |
| Mobile Home / Other | 0 (0.0%) | 0 (0.0%) |
| Total | 132 (100.0%) | 0 (0.0%) |
Housing Structures by Number of Rooms in Veyo
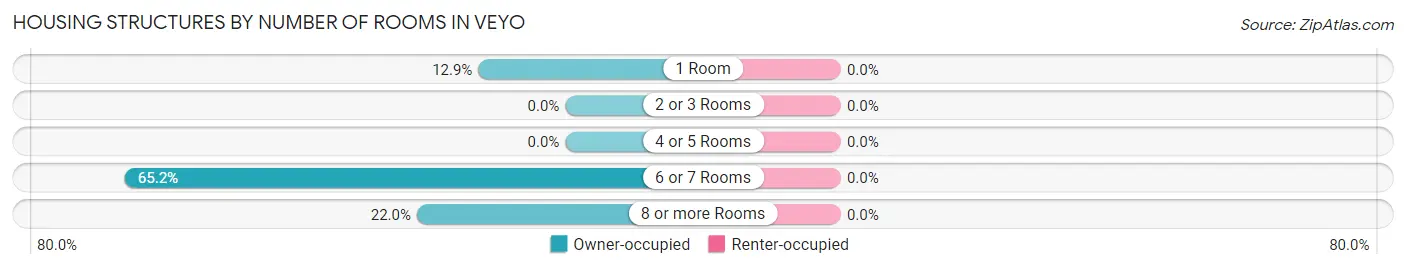
| Number of Rooms | Owner-occupied | Renter-occupied |
| 1 Room | 17 (12.9%) | 0 (0.0%) |
| 2 or 3 Rooms | 0 (0.0%) | 0 (0.0%) |
| 4 or 5 Rooms | 0 (0.0%) | 0 (0.0%) |
| 6 or 7 Rooms | 86 (65.1%) | 0 (0.0%) |
| 8 or more Rooms | 29 (22.0%) | 0 (0.0%) |
| Total | 132 (100.0%) | 0 (0.0%) |
Housing Structure by Heating Type in Veyo
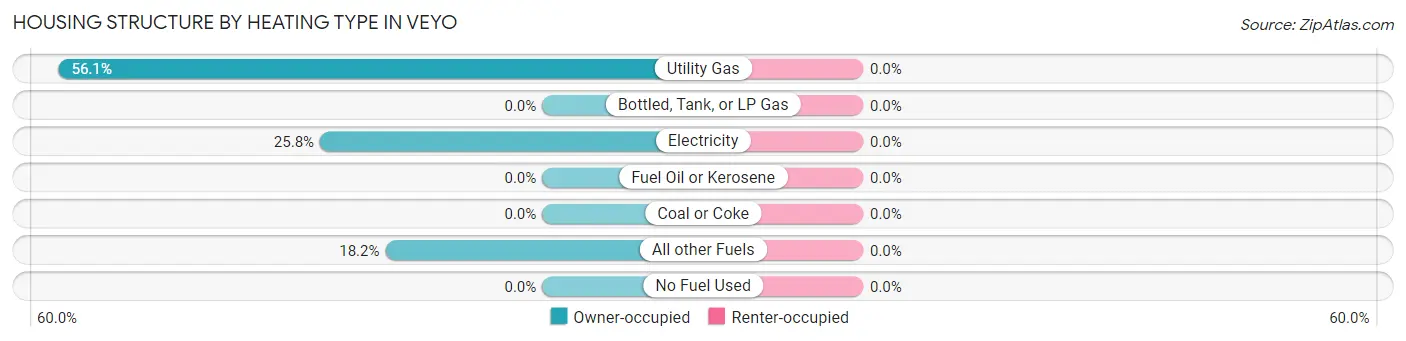
| Heating Type | Owner-occupied | Renter-occupied |
| Utility Gas | 74 (56.1%) | 0 (0.0%) |
| Bottled, Tank, or LP Gas | 0 (0.0%) | 0 (0.0%) |
| Electricity | 34 (25.8%) | 0 (0.0%) |
| Fuel Oil or Kerosene | 0 (0.0%) | 0 (0.0%) |
| Coal or Coke | 0 (0.0%) | 0 (0.0%) |
| All other Fuels | 24 (18.2%) | 0 (0.0%) |
| No Fuel Used | 0 (0.0%) | 0 (0.0%) |
| Total | 132 (100.0%) | 0 (0.0%) |
Household Vehicle Usage in Veyo
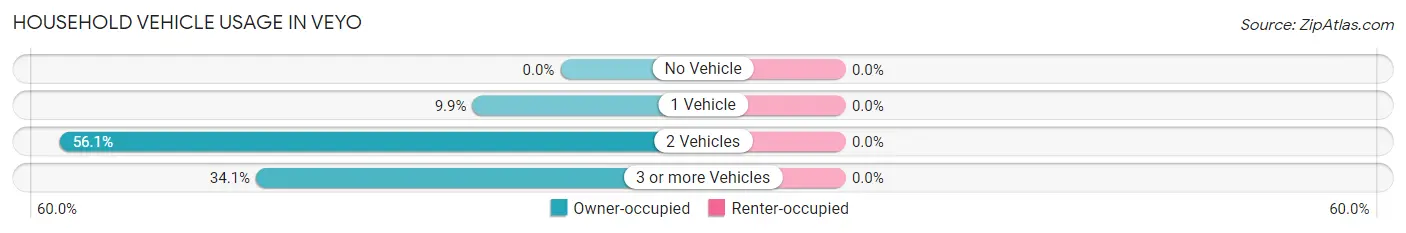
| Vehicles per Household | Owner-occupied | Renter-occupied |
| No Vehicle | 0 (0.0%) | 0 (0.0%) |
| 1 Vehicle | 13 (9.9%) | 0 (0.0%) |
| 2 Vehicles | 74 (56.1%) | 0 (0.0%) |
| 3 or more Vehicles | 45 (34.1%) | 0 (0.0%) |
| Total | 132 (100.0%) | 0 (0.0%) |
Real Estate & Mortgages in Veyo
Real Estate and Mortgage Overview in Veyo
| Characteristic | Without Mortgage | With Mortgage |
| Housing Units | 59 | 73 |
| Median Property Value | - | - |
| Median Household Income | $39,958 | $0 |
| Monthly Housing Costs | $404 | $0 |
| Real Estate Taxes | - | - |
Property Value by Mortgage Status in Veyo
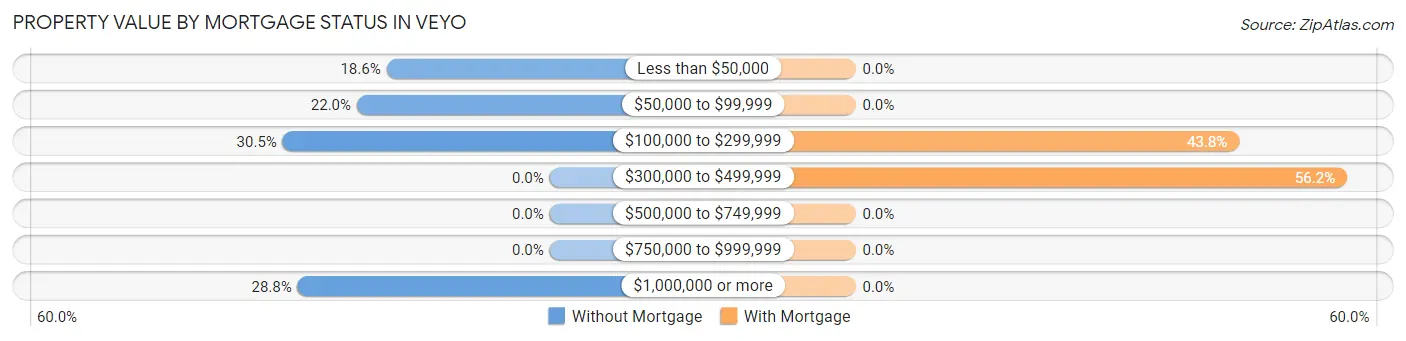
| Property Value | Without Mortgage | With Mortgage |
| Less than $50,000 | 11 (18.6%) | 0 (0.0%) |
| $50,000 to $99,999 | 13 (22.0%) | 0 (0.0%) |
| $100,000 to $299,999 | 18 (30.5%) | 32 (43.8%) |
| $300,000 to $499,999 | 0 (0.0%) | 41 (56.2%) |
| $500,000 to $749,999 | 0 (0.0%) | 0 (0.0%) |
| $750,000 to $999,999 | 0 (0.0%) | 0 (0.0%) |
| $1,000,000 or more | 17 (28.8%) | 0 (0.0%) |
| Total | 59 (100.0%) | 73 (100.0%) |
Household Income by Mortgage Status in Veyo
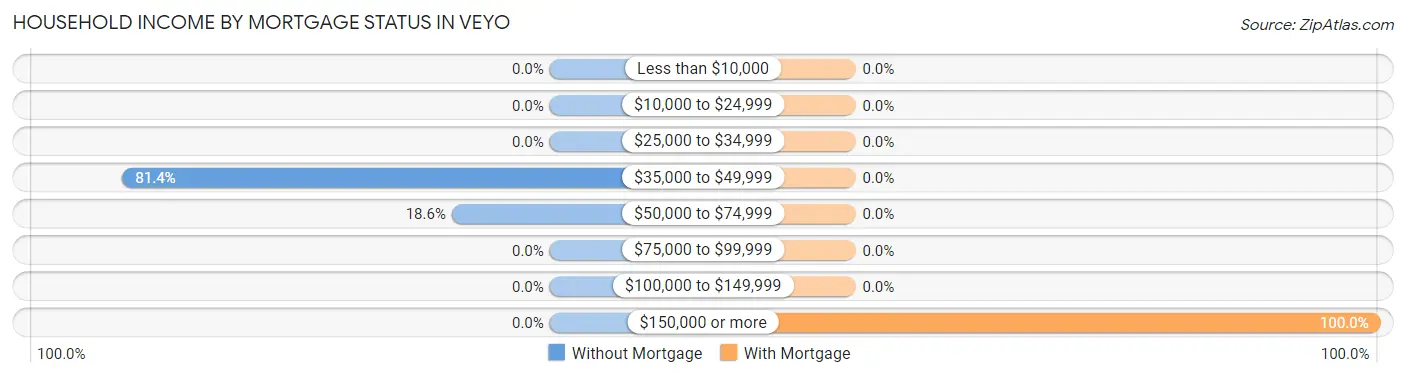
| Household Income | Without Mortgage | With Mortgage |
| Less than $10,000 | 0 (0.0%) | 0 (0.0%) |
| $10,000 to $24,999 | 0 (0.0%) | 0 (0.0%) |
| $25,000 to $34,999 | 0 (0.0%) | 0 (0.0%) |
| $35,000 to $49,999 | 48 (81.4%) | 0 (0.0%) |
| $50,000 to $74,999 | 11 (18.6%) | 0 (0.0%) |
| $75,000 to $99,999 | 0 (0.0%) | 0 (0.0%) |
| $100,000 to $149,999 | 0 (0.0%) | 0 (0.0%) |
| $150,000 or more | 0 (0.0%) | 73 (100.0%) |
| Total | 59 (100.0%) | 73 (100.0%) |
Property Value to Household Income Ratio in Veyo
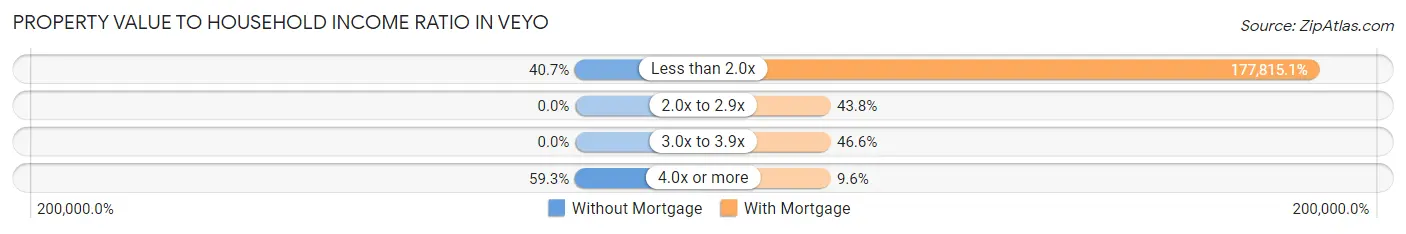
| Value-to-Income Ratio | Without Mortgage | With Mortgage |
| Less than 2.0x | 24 (40.7%) | 129,805 (177,815.1%) |
| 2.0x to 2.9x | 0 (0.0%) | 32 (43.8%) |
| 3.0x to 3.9x | 0 (0.0%) | 34 (46.6%) |
| 4.0x or more | 35 (59.3%) | 7 (9.6%) |
| Total | 59 (100.0%) | 73 (100.0%) |
Real Estate Taxes by Mortgage Status in Veyo
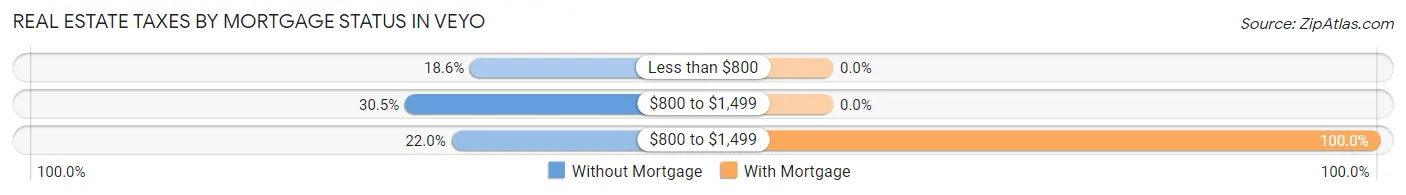
| Property Taxes | Without Mortgage | With Mortgage |
| Less than $800 | 11 (18.6%) | 0 (0.0%) |
| $800 to $1,499 | 18 (30.5%) | 0 (0.0%) |
| $800 to $1,499 | 13 (22.0%) | 73 (100.0%) |
| Total | 59 (100.0%) | 73 (100.0%) |
Health & Disability in Veyo
Health Insurance Coverage by Age in Veyo
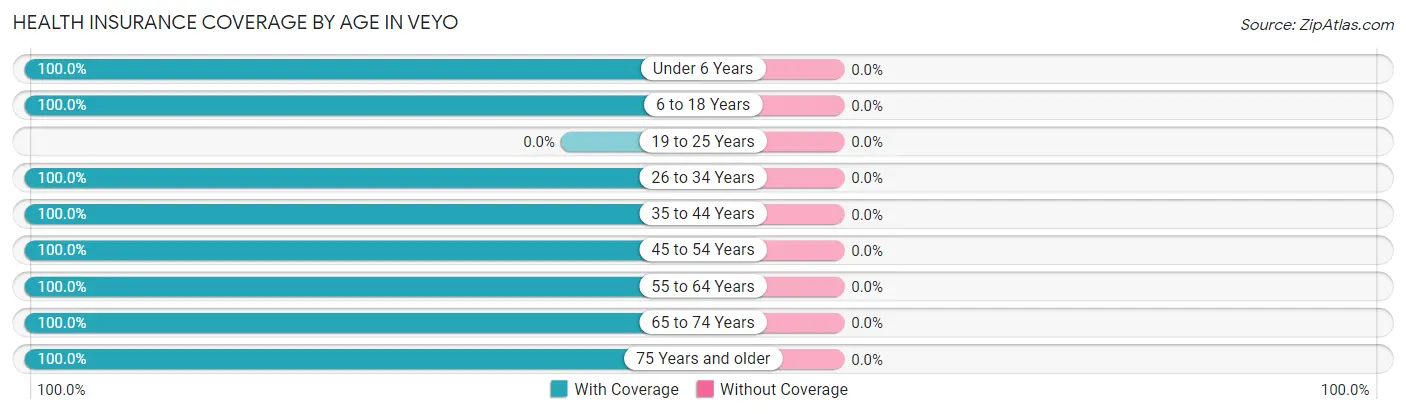
| Age Bracket | With Coverage | Without Coverage |
| Under 6 Years | 17 (100.0%) | 0 (0.0%) |
| 6 to 18 Years | 89 (100.0%) | 0 (0.0%) |
| 19 to 25 Years | 0 (0.0%) | 0 (0.0%) |
| 26 to 34 Years | 13 (100.0%) | 0 (0.0%) |
| 35 to 44 Years | 33 (100.0%) | 0 (0.0%) |
| 45 to 54 Years | 32 (100.0%) | 0 (0.0%) |
| 55 to 64 Years | 96 (100.0%) | 0 (0.0%) |
| 65 to 74 Years | 63 (100.0%) | 0 (0.0%) |
| 75 Years and older | 38 (100.0%) | 0 (0.0%) |
| Total | 381 (100.0%) | 0 (0.0%) |
Health Insurance Coverage by Citizenship Status in Veyo
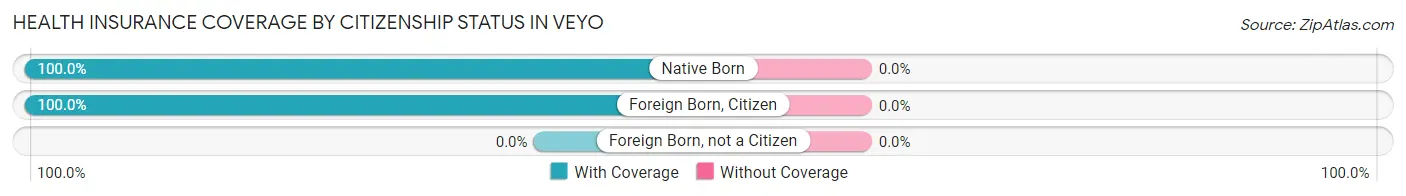
| Citizenship Status | With Coverage | Without Coverage |
| Native Born | 17 (100.0%) | 0 (0.0%) |
| Foreign Born, Citizen | 89 (100.0%) | 0 (0.0%) |
| Foreign Born, not a Citizen | 0 (0.0%) | 0 (0.0%) |
Health Insurance Coverage by Household Income in Veyo
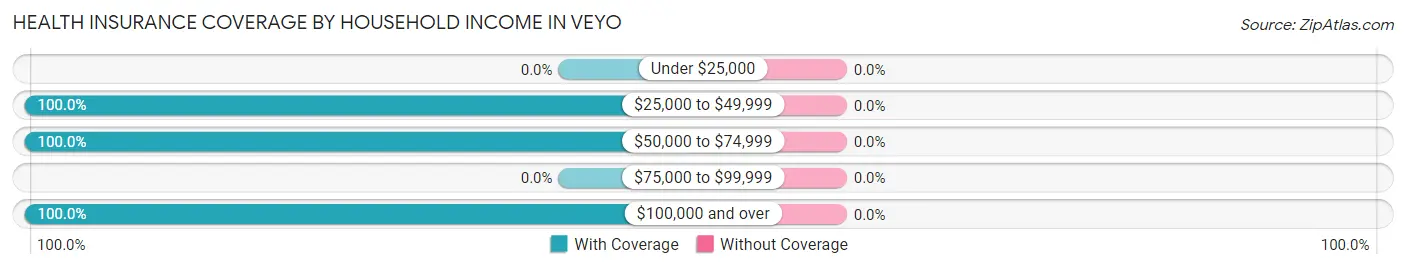
| Household Income | With Coverage | Without Coverage |
| Under $25,000 | 0 (0.0%) | 0 (0.0%) |
| $25,000 to $49,999 | 214 (100.0%) | 0 (0.0%) |
| $50,000 to $74,999 | 21 (100.0%) | 0 (0.0%) |
| $75,000 to $99,999 | 0 (0.0%) | 0 (0.0%) |
| $100,000 and over | 146 (100.0%) | 0 (0.0%) |
Public vs Private Health Insurance Coverage by Age in Veyo
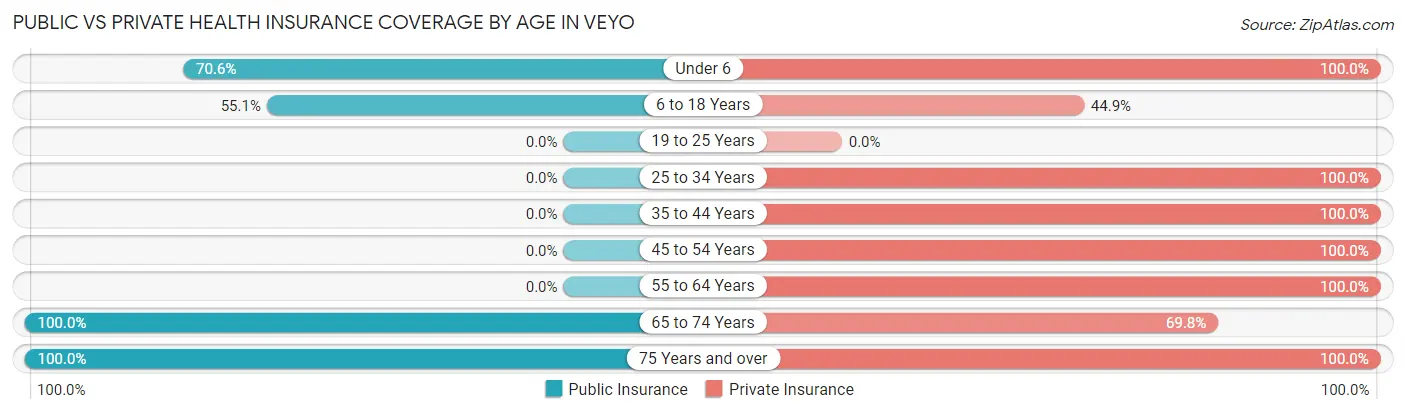
| Age Bracket | Public Insurance | Private Insurance |
| Under 6 | 12 (70.6%) | 17 (100.0%) |
| 6 to 18 Years | 49 (55.1%) | 40 (44.9%) |
| 19 to 25 Years | 0 (0.0%) | 0 (0.0%) |
| 25 to 34 Years | 0 (0.0%) | 13 (100.0%) |
| 35 to 44 Years | 0 (0.0%) | 33 (100.0%) |
| 45 to 54 Years | 0 (0.0%) | 32 (100.0%) |
| 55 to 64 Years | 0 (0.0%) | 96 (100.0%) |
| 65 to 74 Years | 63 (100.0%) | 44 (69.8%) |
| 75 Years and over | 38 (100.0%) | 38 (100.0%) |
| Total | 162 (42.5%) | 313 (82.2%) |
Disability Status by Sex by Age in Veyo
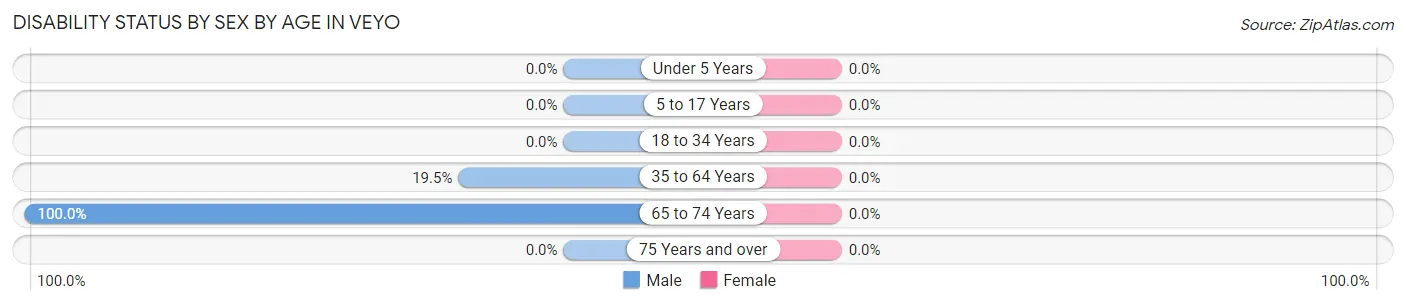
| Age Bracket | Male | Female |
| Under 5 Years | 0 (0.0%) | 0 (0.0%) |
| 5 to 17 Years | 0 (0.0%) | 0 (0.0%) |
| 18 to 34 Years | 0 (0.0%) | 0 (0.0%) |
| 35 to 64 Years | 16 (19.5%) | 0 (0.0%) |
| 65 to 74 Years | 18 (100.0%) | 0 (0.0%) |
| 75 Years and over | 0 (0.0%) | 0 (0.0%) |
Disability Class by Sex by Age in Veyo
Disability Class: Hearing Difficulty
| Age Bracket | Male | Female |
| Under 5 Years | 0 (0.0%) | 0 (0.0%) |
| 5 to 17 Years | 0 (0.0%) | 0 (0.0%) |
| 18 to 34 Years | 0 (0.0%) | 0 (0.0%) |
| 35 to 64 Years | 0 (0.0%) | 0 (0.0%) |
| 65 to 74 Years | 0 (0.0%) | 0 (0.0%) |
| 75 Years and over | 0 (0.0%) | 0 (0.0%) |
Disability Class: Vision Difficulty
| Age Bracket | Male | Female |
| Under 5 Years | 0 (0.0%) | 0 (0.0%) |
| 5 to 17 Years | 0 (0.0%) | 0 (0.0%) |
| 18 to 34 Years | 0 (0.0%) | 0 (0.0%) |
| 35 to 64 Years | 0 (0.0%) | 0 (0.0%) |
| 65 to 74 Years | 0 (0.0%) | 0 (0.0%) |
| 75 Years and over | 0 (0.0%) | 0 (0.0%) |
Disability Class: Cognitive Difficulty
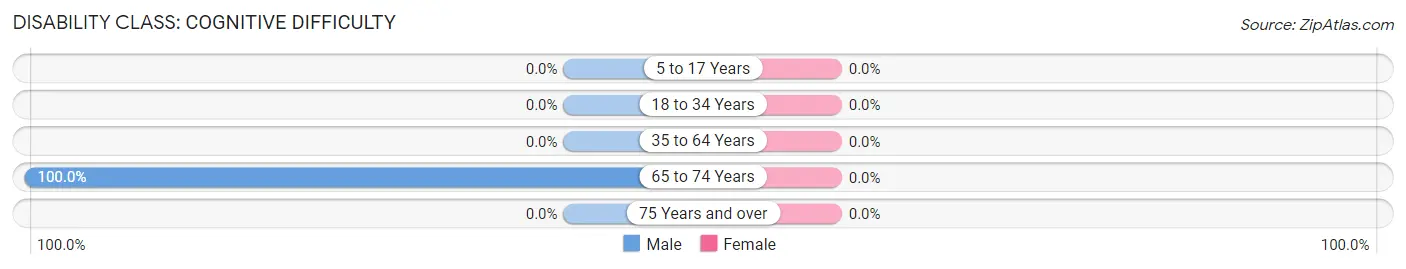
| Age Bracket | Male | Female |
| 5 to 17 Years | 0 (0.0%) | 0 (0.0%) |
| 18 to 34 Years | 0 (0.0%) | 0 (0.0%) |
| 35 to 64 Years | 0 (0.0%) | 0 (0.0%) |
| 65 to 74 Years | 18 (100.0%) | 0 (0.0%) |
| 75 Years and over | 0 (0.0%) | 0 (0.0%) |
Disability Class: Ambulatory Difficulty
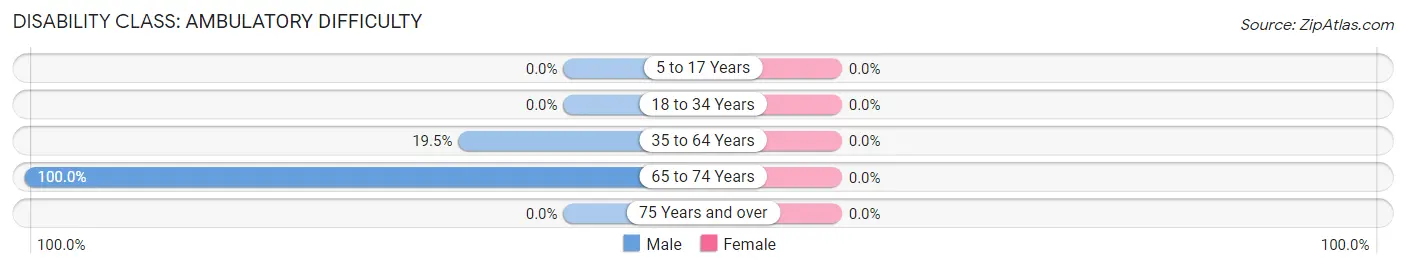
| Age Bracket | Male | Female |
| 5 to 17 Years | 0 (0.0%) | 0 (0.0%) |
| 18 to 34 Years | 0 (0.0%) | 0 (0.0%) |
| 35 to 64 Years | 16 (19.5%) | 0 (0.0%) |
| 65 to 74 Years | 18 (100.0%) | 0 (0.0%) |
| 75 Years and over | 0 (0.0%) | 0 (0.0%) |
Disability Class: Self-Care Difficulty
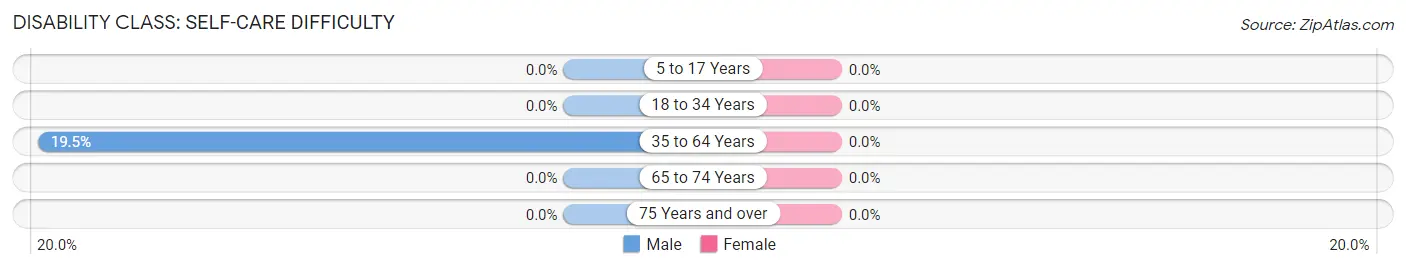
| Age Bracket | Male | Female |
| 5 to 17 Years | 0 (0.0%) | 0 (0.0%) |
| 18 to 34 Years | 0 (0.0%) | 0 (0.0%) |
| 35 to 64 Years | 16 (19.5%) | 0 (0.0%) |
| 65 to 74 Years | 0 (0.0%) | 0 (0.0%) |
| 75 Years and over | 0 (0.0%) | 0 (0.0%) |
Technology Access in Veyo
Computing Device Access in Veyo
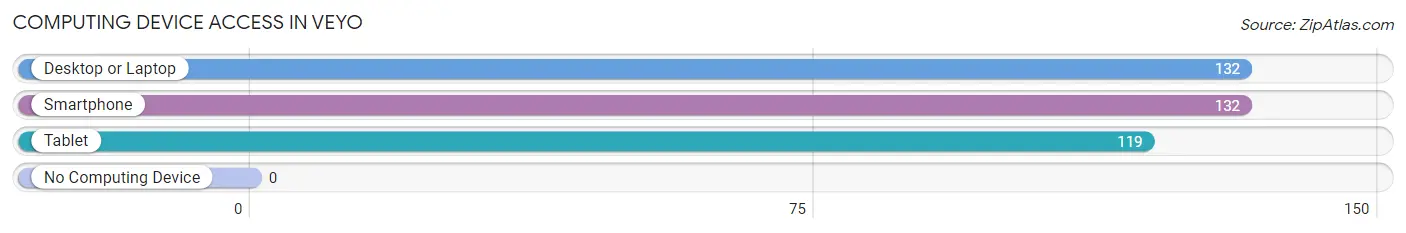
| Device Type | # Households | % Households |
| Desktop or Laptop | 132 | 100.0% |
| Smartphone | 132 | 100.0% |
| Tablet | 119 | 90.1% |
| No Computing Device | 0 | 0.0% |
| Total | 132 | 100.0% |
Internet Access in Veyo
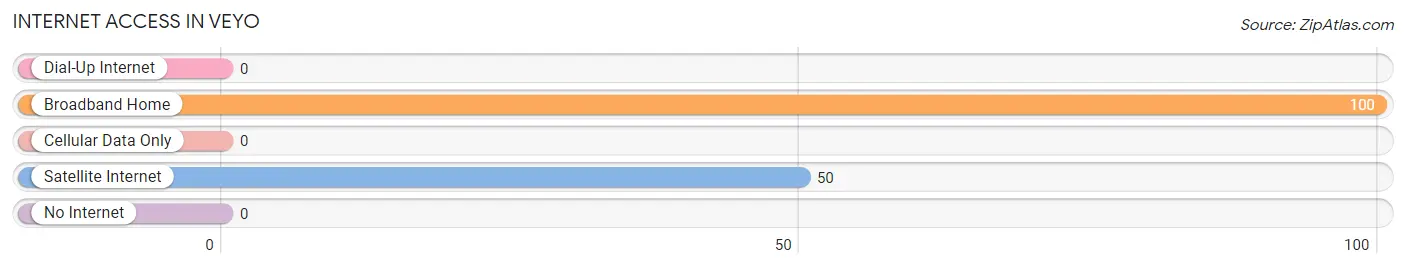
| Internet Type | # Households | % Households |
| Dial-Up Internet | 0 | 0.0% |
| Broadband Home | 100 | 75.8% |
| Cellular Data Only | 0 | 0.0% |
| Satellite Internet | 50 | 37.9% |
| No Internet | 0 | 0.0% |
| Total | 132 | 100.0% |
Veyo Summary
Veyo is a small unincorporated community located in Washington County, Utah. It is situated in the southwestern part of the state, approximately 15 miles northeast of St. George. The population of Veyo was estimated to be around 500 in 2020.
History
Veyo was first settled in 1854 by a group of Mormon pioneers led by John D. Lee. The settlement was originally called "Lee's Ferry" after Lee, who had established a ferry service across the Virgin River. In 1859, the settlement was renamed "Veyo" after the Paiute word for "willow".
The town grew slowly over the years, and by the early 1900s, it had become a popular stop for travelers on the Old Spanish Trail. In the 1920s, the town was home to a number of businesses, including a hotel, a general store, a blacksmith shop, and a post office.
Geography
Veyo is located in the southwestern part of Utah, approximately 15 miles northeast of St. George. The town is situated in a valley surrounded by the Pine Valley Mountains to the north and the Red Cliffs to the south. The Virgin River runs through the town, providing a source of irrigation for the local farms and ranches.
Economy
The economy of Veyo is largely based on agriculture. The town is home to several farms and ranches, which produce a variety of crops, including alfalfa, hay, corn, and wheat. The town is also home to a number of small businesses, including a gas station, a restaurant, and a grocery store.
Demographics
As of the 2010 census, the population of Veyo was estimated to be around 500. The racial makeup of the town was 94.2% White, 0.4% African American, 0.4% Native American, 0.4% Asian, 0.2% Pacific Islander, and 4.4% from other races. The median household income was $37,500, and the median family income was $41,250. The per capita income was $17,500.
Common Questions
What is Per Capita Income in Veyo?
Per Capita income in Veyo is $32,045.
What is Inequality or Gini Index in Veyo?
Inequality or Gini Index in Veyo is 0.25.
What is the Total Population of Veyo?
Total Population of Veyo is 381.
What is the Total Male Population of Veyo?
Total Male Population of Veyo is 201.
What is the Total Female Population of Veyo?
Total Female Population of Veyo is 180.
What is the Ratio of Males per 100 Females in Veyo?
There are 111.67 Males per 100 Females in Veyo.
What is the Ratio of Females per 100 Males in Veyo?
There are 89.55 Females per 100 Males in Veyo.
What is the Median Population Age in Veyo?
Median Population Age in Veyo is 55.2 Years.
What is the Average Family Size in Veyo
Average Family Size in Veyo is 2.9 People.
What is the Average Household Size in Veyo
Average Household Size in Veyo is 2.9 People.
How Large is the Labor Force in Veyo?
There are 157 People in the Labor Forcein in Veyo.
What is the Percentage of People in the Labor Force in Veyo?
53.8% of People are in the Labor Force in Veyo.
What is the Unemployment Rate in Veyo?
Unemployment Rate in Veyo is 10.2%.