Zip Codes with the Highest Percentage of Households with Income Below $10,000 in Portland, OR
RELATED REPORTS & OPTIONS
Household Income | $0-10k
Portland
Compare Zip Codes
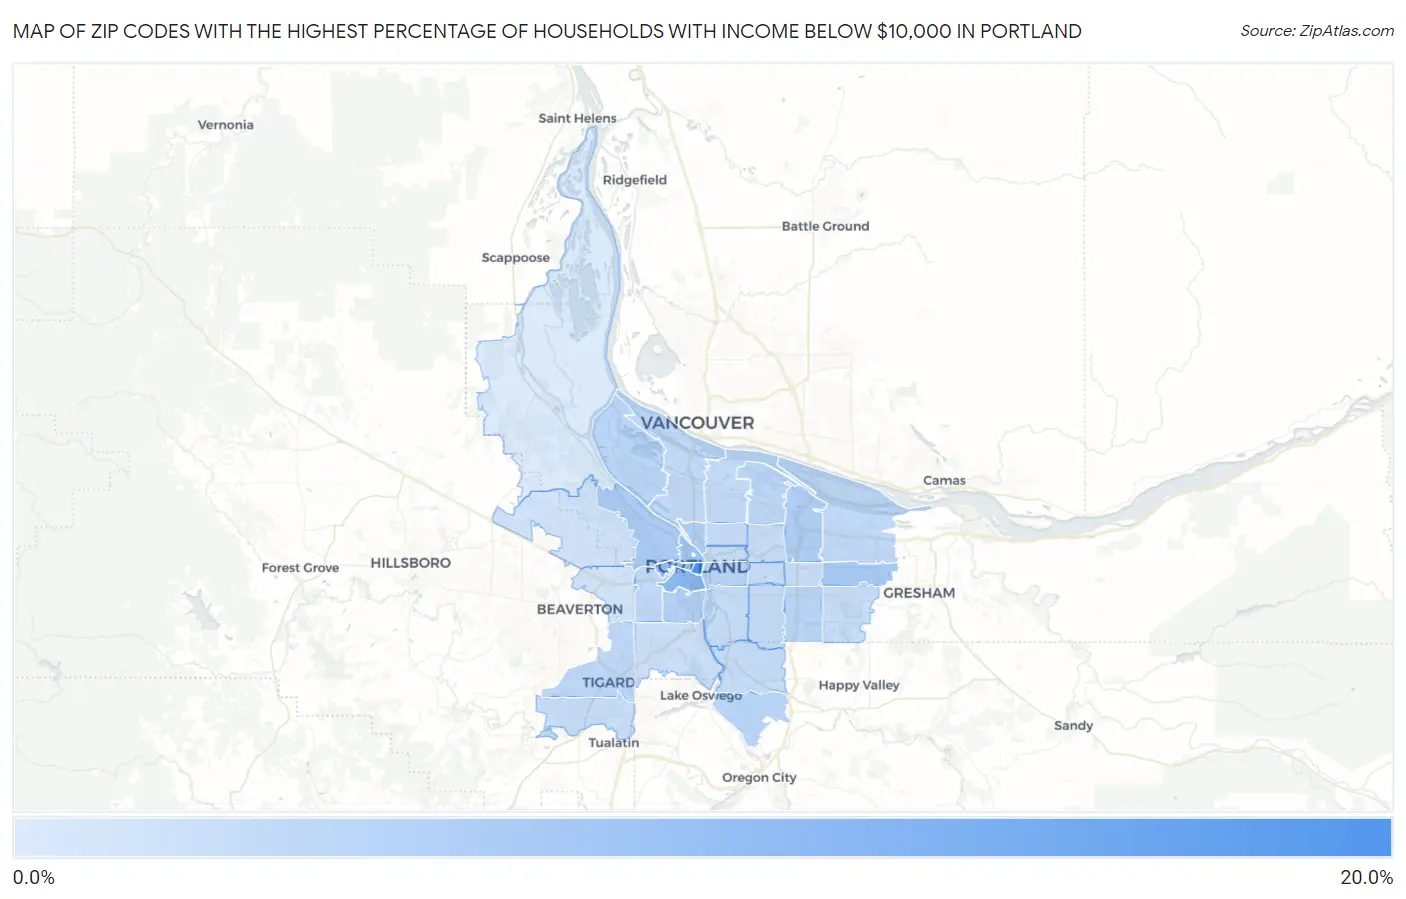
Map of Zip Codes with the Highest Percentage of Households with Income Below $10,000 in Portland
0.80%
19.7%
Zip Codes with the Highest Percentage of Households with Income Below $10,000 in Portland, OR
| Zip Code | Households with Income < $10k | vs State | vs National | |
| 1. | 97204 | 19.7% | 4.4%(+15.3)#12 | 4.9%(+14.8)#826 |
| 2. | 97201 | 11.0% | 4.4%(+6.60)#33 | 4.9%(+6.10)#2,953 |
| 3. | 97205 | 9.3% | 4.4%(+4.90)#45 | 4.9%(+4.40)#4,120 |
| 4. | 97209 | 8.3% | 4.4%(+3.90)#59 | 4.9%(+3.40)#5,174 |
| 5. | 97233 | 7.2% | 4.4%(+2.80)#75 | 4.9%(+2.30)#6,624 |
| 6. | 97210 | 6.5% | 4.4%(+2.10)#89 | 4.9%(+1.60)#7,948 |
| 7. | 97220 | 6.3% | 4.4%(+1.90)#94 | 4.9%(+1.40)#8,334 |
| 8. | 97227 | 5.9% | 4.4%(+1.50)#114 | 4.9%(+1.00)#9,297 |
| 9. | 97239 | 5.6% | 4.4%(+1.20)#125 | 4.9%(+0.700)#10,007 |
| 10. | 97214 | 5.2% | 4.4%(+0.800)#135 | 4.9%(+0.300)#11,071 |
| 11. | 97266 | 5.0% | 4.4%(+0.600)#142 | 4.9%(+0.100)#11,673 |
| 12. | 97203 | 4.8% | 4.4%(+0.400)#152 | 4.9%(-0.100)#12,306 |
| 13. | 97267 | 4.8% | 4.4%(+0.400)#154 | 4.9%(-0.100)#12,313 |
| 14. | 97218 | 4.7% | 4.4%(+0.300)#163 | 4.9%(-0.200)#12,723 |
| 15. | 97223 | 4.2% | 4.4%(-0.200)#178 | 4.9%(-0.700)#14,448 |
| 16. | 97230 | 4.1% | 4.4%(-0.300)#185 | 4.9%(-0.800)#14,816 |
| 17. | 97221 | 4.1% | 4.4%(-0.300)#188 | 4.9%(-0.800)#14,933 |
| 18. | 97217 | 4.0% | 4.4%(-0.400)#192 | 4.9%(-0.900)#15,236 |
| 19. | 97211 | 3.8% | 4.4%(-0.600)#201 | 4.9%(-1.10)#16,003 |
| 20. | 97206 | 3.6% | 4.4%(-0.800)#210 | 4.9%(-1.30)#16,782 |
| 21. | 97202 | 3.6% | 4.4%(-0.800)#212 | 4.9%(-1.30)#16,793 |
| 22. | 97222 | 3.6% | 4.4%(-0.800)#213 | 4.9%(-1.30)#16,817 |
| 23. | 97232 | 3.5% | 4.4%(-0.900)#222 | 4.9%(-1.40)#17,327 |
| 24. | 97224 | 3.3% | 4.4%(-1.10)#235 | 4.9%(-1.60)#18,074 |
| 25. | 97216 | 3.3% | 4.4%(-1.10)#237 | 4.9%(-1.60)#18,155 |
| 26. | 97213 | 3.2% | 4.4%(-1.20)#242 | 4.9%(-1.70)#18,499 |
| 27. | 97236 | 3.1% | 4.4%(-1.30)#249 | 4.9%(-1.80)#18,893 |
| 28. | 97212 | 3.1% | 4.4%(-1.30)#250 | 4.9%(-1.80)#18,926 |
| 29. | 97215 | 3.1% | 4.4%(-1.30)#251 | 4.9%(-1.80)#18,969 |
| 30. | 97219 | 2.6% | 4.4%(-1.80)#283 | 4.9%(-2.30)#21,068 |
| 31. | 97229 | 2.1% | 4.4%(-2.30)#302 | 4.9%(-2.80)#23,204 |
| 32. | 97225 | 2.0% | 4.4%(-2.40)#311 | 4.9%(-2.90)#23,626 |
| 33. | 97231 | 0.80% | 4.4%(-3.60)#346 | 4.9%(-4.10)#27,331 |
1
Common Questions
What are the Top 10 Zip Codes with the Highest Percentage of Households with Income Below $10,000 in Portland, OR?
Top 10 Zip Codes with the Highest Percentage of Households with Income Below $10,000 in Portland, OR are:
What zip code has the Highest Percentage of Households with Income Below $10,000 in Portland, OR?
97204 has the Highest Percentage of Households with Income Below $10,000 in Portland, OR with 19.7%.
What is the Percentage of Households with Income Below $10,000 in Portland, OR?
Percentage of Households with Income Below $10,000 in Portland is 4.7%.
What is the Percentage of Households with Income Below $10,000 in Oregon?
Percentage of Households with Income Below $10,000 in Oregon is 4.4%.
What is the Percentage of Households with Income Below $10,000 in the United States?
Percentage of Households with Income Below $10,000 in the United States is 4.9%.