Zip Codes with the Highest Percentage of Households with Income Above $200,000 in Portland, OR
RELATED REPORTS & OPTIONS
Household Income | $200k+
Portland
Compare Zip Codes
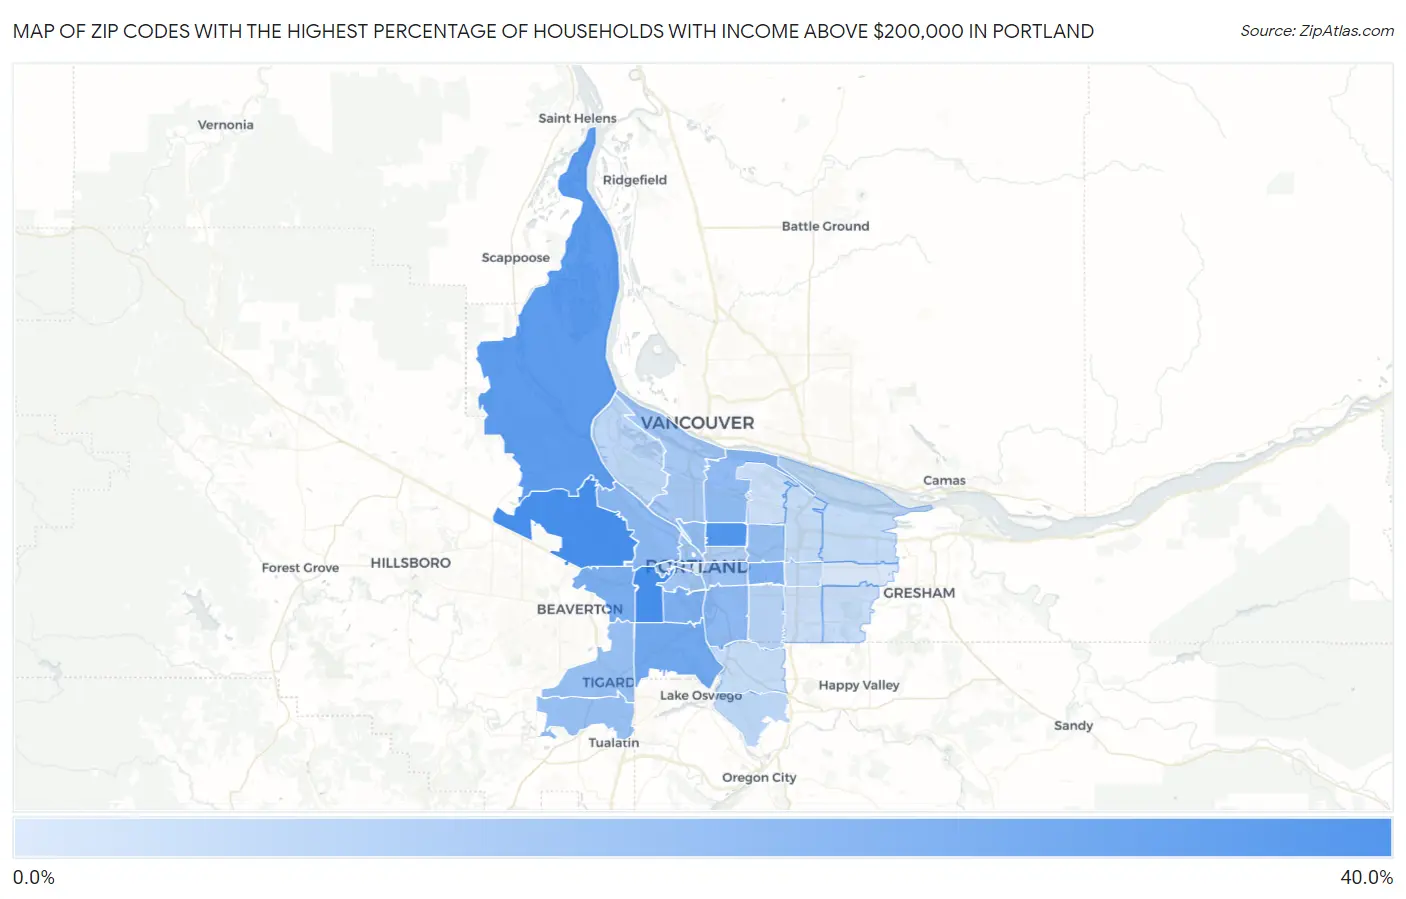
Map of Zip Codes with the Highest Percentage of Households with Income Above $200,000 in Portland
2.6%
35.0%
Zip Codes with the Highest Percentage of Households with Income Above $200,000 in Portland, OR
| Zip Code | Households with Income > $200k | vs State | vs National | |
| 1. | 97221 | 35.0% | 10.5%(+24.5)#4 | 11.4%(+23.6)#979 |
| 2. | 97229 | 34.8% | 10.5%(+24.3)#5 | 11.4%(+23.4)#992 |
| 3. | 97212 | 32.1% | 10.5%(+21.6)#6 | 11.4%(+20.7)#1,240 |
| 4. | 97231 | 29.2% | 10.5%(+18.7)#9 | 11.4%(+17.8)#1,564 |
| 5. | 97219 | 24.8% | 10.5%(+14.3)#14 | 11.4%(+13.4)#2,220 |
| 6. | 97225 | 22.4% | 10.5%(+11.9)#23 | 11.4%(+11.0)#2,691 |
| 7. | 97239 | 22.0% | 10.5%(+11.5)#24 | 11.4%(+10.6)#2,779 |
| 8. | 97215 | 21.6% | 10.5%(+11.1)#25 | 11.4%(+10.2)#2,873 |
| 9. | 97202 | 18.6% | 10.5%(+8.10)#30 | 11.4%(+7.20)#3,668 |
| 10. | 97210 | 18.3% | 10.5%(+7.80)#33 | 11.4%(+6.90)#3,756 |
| 11. | 97211 | 18.0% | 10.5%(+7.50)#35 | 11.4%(+6.60)#3,842 |
| 12. | 97227 | 17.9% | 10.5%(+7.40)#37 | 11.4%(+6.50)#3,886 |
| 13. | 97224 | 16.7% | 10.5%(+6.20)#40 | 11.4%(+5.30)#4,286 |
| 14. | 97223 | 16.5% | 10.5%(+6.00)#42 | 11.4%(+5.10)#4,363 |
| 15. | 97213 | 16.3% | 10.5%(+5.80)#44 | 11.4%(+4.90)#4,446 |
| 16. | 97214 | 15.5% | 10.5%(+5.00)#47 | 11.4%(+4.10)#4,755 |
| 17. | 97209 | 14.8% | 10.5%(+4.30)#51 | 11.4%(+3.40)#5,081 |
| 18. | 97201 | 14.5% | 10.5%(+4.00)#55 | 11.4%(+3.10)#5,221 |
| 19. | 97205 | 14.2% | 10.5%(+3.70)#58 | 11.4%(+2.80)#5,368 |
| 20. | 97217 | 13.6% | 10.5%(+3.10)#63 | 11.4%(+2.20)#5,680 |
| 21. | 97232 | 11.8% | 10.5%(+1.30)#80 | 11.4%(+0.400)#6,806 |
| 22. | 97206 | 9.8% | 10.5%(-0.700)#103 | 11.4%(-1.60)#8,432 |
| 23. | 97203 | 9.0% | 10.5%(-1.50)#119 | 11.4%(-2.40)#9,214 |
| 24. | 97267 | 9.0% | 10.5%(-1.50)#120 | 11.4%(-2.40)#9,215 |
| 25. | 97216 | 7.3% | 10.5%(-3.20)#156 | 11.4%(-4.10)#11,360 |
| 26. | 97222 | 7.2% | 10.5%(-3.30)#158 | 11.4%(-4.20)#11,485 |
| 27. | 97220 | 7.2% | 10.5%(-3.30)#159 | 11.4%(-4.20)#11,496 |
| 28. | 97230 | 6.9% | 10.5%(-3.60)#170 | 11.4%(-4.50)#11,904 |
| 29. | 97236 | 6.4% | 10.5%(-4.10)#183 | 11.4%(-5.00)#12,718 |
| 30. | 97266 | 6.2% | 10.5%(-4.30)#190 | 11.4%(-5.20)#13,075 |
| 31. | 97218 | 5.7% | 10.5%(-4.80)#206 | 11.4%(-5.70)#14,098 |
| 32. | 97233 | 3.2% | 10.5%(-7.30)#285 | 11.4%(-8.20)#20,285 |
| 33. | 97204 | 2.6% | 10.5%(-7.90)#305 | 11.4%(-8.80)#22,243 |
1
Common Questions
What are the Top 10 Zip Codes with the Highest Percentage of Households with Income Above $200,000 in Portland, OR?
Top 10 Zip Codes with the Highest Percentage of Households with Income Above $200,000 in Portland, OR are:
What zip code has the Highest Percentage of Households with Income Above $200,000 in Portland, OR?
97221 has the Highest Percentage of Households with Income Above $200,000 in Portland, OR with 35.0%.
What is the Percentage of Households with Income Above $200,000 in Portland, OR?
Percentage of Households with Income Above $200,000 in Portland is 14.8%.
What is the Percentage of Households with Income Above $200,000 in Oregon?
Percentage of Households with Income Above $200,000 in Oregon is 10.5%.
What is the Percentage of Households with Income Above $200,000 in the United States?
Percentage of Households with Income Above $200,000 in the United States is 11.4%.