Zip Codes with the Lowest Wage/Income Gap (%) in Portland, OR

RELATED REPORTS & OPTIONS

Lowest Wage/Income Gap (%)
Population
Families and Households
Female Fertility
Female Fertility (Unmarried)
Race (Community Size)
Race (Percentage)
Ancestry (Community Size)
AfghanAfricanAlaska NativeAlaskan AthabascanAlbanianAleutAlsatianAmericanApacheArabArgentineanArmenianAustralianAustrianBahamianBangladeshiBasqueBelgianBelizeanBhutaneseBlackfeetBolivianBrazilianBritishBritish West IndianBulgarianBurmeseCajunCambodianCanadianCelticCentral AmericanCentral American IndianCherokeeCheyenneChickasawChileanChineseChippewaChoctawColombianColvilleCosta RicanCreeCreekCroatianCubanCzechCzechoslovakianDanishDelawareDominicanDutchEastern EuropeanEcuadorianEgyptianEnglishEstonianEthiopianEuropeanFijianFilipinoFinnishFrenchFrench American IndianFrench CanadianGermanGerman RussianGhanaianGreekGuamanian / ChamorroGuatemalanGuyaneseHaitianHonduranHopiHungarianIcelanderIndian (Asian)IndonesianInupiatIranianIraqiIrishIroquoisIsraeliItalianJamaicanJapaneseJordanianKenyanKoreanLaotianLatvianLebaneseLiberianLithuanianLumbeeLuxembourgerMacedonianMalaysianMalteseMarshalleseMexicanMexican American IndianMongolianMoroccanNative HawaiianNavajoNepaleseNew ZealanderNicaraguanNigerianNorthern EuropeanNorwegianOkinawanOsagePaiutePakistaniPalestinianPanamanianParaguayanPennsylvania GermanPeruvianPimaPolishPortuguesePotawatomiPuebloPuerto RicanPuget Sound SalishRomanianRussianSalvadoranSamoanScandinavianScotch-IrishScottishSeminoleSenegaleseSerbianShoshoneSierra LeoneanSiouxSlavicSlovakSloveneSomaliSouth AfricanSouth AmericanSouth American IndianSoviet UnionSpaniardSpanishSpanish AmericanSpanish American IndianSri LankanSubsaharan AfricanSwedishSwissSyrianThaiTlingit-HaidaTonganTrinidadian and TobagonianTsimshianTurkishUgandanUkrainianUruguayanUteVenezuelanVietnameseWelshWest IndianYakamaYaquiYugoslavianYup'ik
Ancestry (Percentage)
AfghanAfricanAlaska NativeAlaskan AthabascanAlbanianAleutAlsatianAmericanApacheArabArgentineanArmenianAustralianAustrianBahamianBangladeshiBasqueBelgianBelizeanBhutaneseBlackfeetBolivianBrazilianBritishBritish West IndianBulgarianBurmeseCajunCambodianCanadianCelticCentral AmericanCentral American IndianCherokeeCheyenneChickasawChileanChineseChippewaChoctawColombianColvilleCosta RicanCreeCreekCroatianCubanCzechCzechoslovakianDanishDelawareDominicanDutchEastern EuropeanEcuadorianEgyptianEnglishEstonianEthiopianEuropeanFijianFilipinoFinnishFrenchFrench American IndianFrench CanadianGermanGerman RussianGhanaianGreekGuamanian / ChamorroGuatemalanGuyaneseHaitianHonduranHopiHungarianIcelanderIndian (Asian)IndonesianInupiatIranianIraqiIrishIroquoisIsraeliItalianJamaicanJapaneseJordanianKenyanKoreanLaotianLatvianLebaneseLiberianLithuanianLumbeeLuxembourgerMacedonianMalaysianMalteseMarshalleseMexicanMexican American IndianMongolianMoroccanNative HawaiianNavajoNepaleseNew ZealanderNicaraguanNigerianNorthern EuropeanNorwegianOkinawanOsagePaiutePakistaniPalestinianPanamanianParaguayanPennsylvania GermanPeruvianPimaPolishPortuguesePotawatomiPuebloPuerto RicanPuget Sound SalishRomanianRussianSalvadoranSamoanScandinavianScotch-IrishScottishSeminoleSenegaleseSerbianShoshoneSierra LeoneanSiouxSlavicSlovakSloveneSomaliSouth AfricanSouth AmericanSouth American IndianSoviet UnionSpaniardSpanishSpanish AmericanSpanish American IndianSri LankanSubsaharan AfricanSwedishSwissSyrianThaiTlingit-HaidaTonganTrinidadian and TobagonianTsimshianTurkishUgandanUkrainianUruguayanUteVenezuelanVietnameseWelshWest IndianYakamaYaquiYugoslavianYup'ik
Immigrant Origin (Total)
AfghanistanAfricaArgentinaArmeniaAsiaAustraliaAustriaBahamasBangladeshBarbadosBelarusBelgiumBelizeBosnia and HerzegovinaBrazilBulgariaBurma / MyanmarCambodiaCameroonCanadaCaribbeanCentral AmericaChileChinaColombiaCongoCosta RicaCroatiaCubaCzechoslovakiaDenmarkDominican RepublicEastern AfricaEastern AsiaEastern EuropeEcuadorEgyptEl SalvadorEnglandEritreaEthiopiaEuropeFijiFranceGermanyGhanaGreeceGuatemalaHaitiHondurasHong KongHungaryIndiaIndonesiaIranIraqIrelandIsraelItalyJamaicaJapanJordanKazakhstanKenyaKoreaKuwaitLaosLatin AmericaLatviaLebanonLiberiaLithuaniaMalaysiaMexicoMicronesiaMiddle AfricaMoldovaMoroccoNepalNetherlandsNicaraguaNigeriaNorth MacedoniaNorthern AfricaNorthern EuropeNorwayOceaniaPakistanPanamaPeruPhilippinesPolandPortugalRomaniaRussiaSaudi ArabiaScotlandSerbiaSingaporeSomaliaSouth AfricaSouth AmericaSouth Central AsiaSouth Eastern AsiaSouthern EuropeSpainSri LankaSudanSwedenSwitzerlandSyriaTaiwanThailandTrinidad and TobagoTurkeyUgandaUkraineUruguayUzbekistanVenezuelaVietnamWestern AfricaWestern AsiaWestern EuropeYemen
Immigrant Origin (Percentage)
AfghanistanAfricaArgentinaArmeniaAsiaAustraliaAustriaBahamasBangladeshBarbadosBelarusBelgiumBelizeBosnia and HerzegovinaBrazilBulgariaBurma / MyanmarCambodiaCameroonCanadaCaribbeanCentral AmericaChileChinaColombiaCongoCosta RicaCroatiaCubaCzechoslovakiaDenmarkDominican RepublicEastern AfricaEastern AsiaEastern EuropeEcuadorEgyptEl SalvadorEnglandEritreaEthiopiaEuropeFijiFranceGermanyGhanaGreeceGuatemalaHaitiHondurasHong KongHungaryIndiaIndonesiaIranIraqIrelandIsraelItalyJamaicaJapanJordanKazakhstanKenyaKoreaKuwaitLaosLatin AmericaLatviaLebanonLiberiaLithuaniaMalaysiaMexicoMicronesiaMiddle AfricaMoldovaMoroccoNepalNetherlandsNicaraguaNigeriaNorth MacedoniaNorthern AfricaNorthern EuropeNorwayOceaniaPakistanPanamaPeruPhilippinesPolandPortugalRomaniaRussiaSaudi ArabiaScotlandSerbiaSingaporeSomaliaSouth AfricaSouth AmericaSouth Central AsiaSouth Eastern AsiaSouthern EuropeSpainSri LankaSudanSwedenSwitzerlandSyriaTaiwanThailandTrinidad and TobagoTurkeyUgandaUkraineUruguayUzbekistanVenezuelaVietnamWestern AfricaWestern AsiaWestern EuropeYemen
Income
Income (Families)
Income (Households)
Poverty
Poverty (Families)
Unemployment
Employment Occupations
Employment Industries
Employer Class
Commute Time
Commute Means
School Enrollment
Education by Degree Field
Occupancy
Finances
Physical Characteristics
Portland
Compare Zip Codes
Comparison Subject

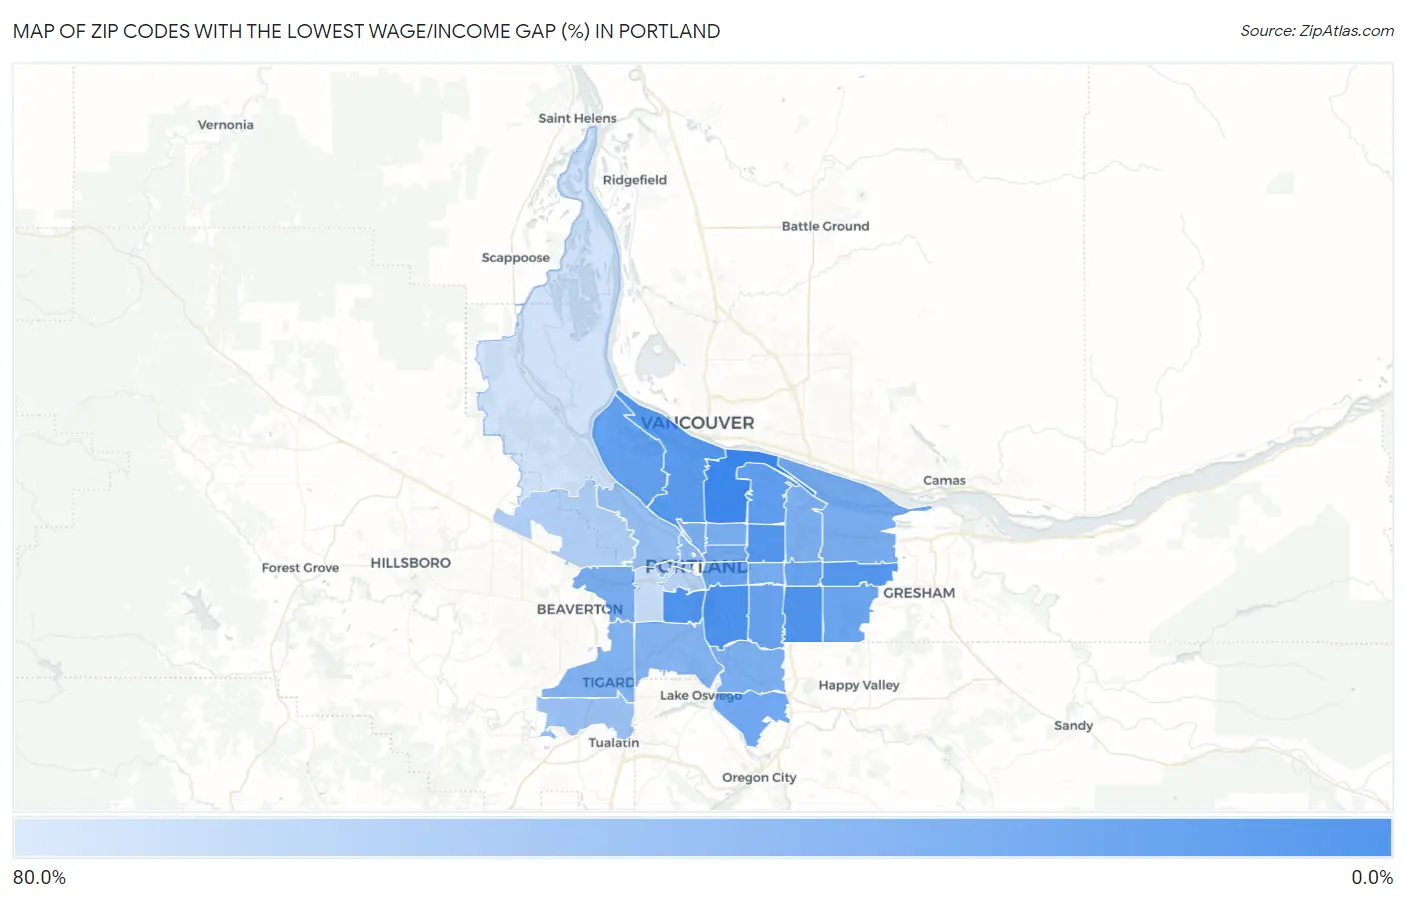
Map of Zip Codes with the Lowest Wage/Income Gap (%) in Portland

80.0%
0.0%
Zip Codes with the Lowest Wage/Income Gap (%) in Portland Map

Zip Codes with the Lowest Wage/Income Gap (%) in Portland, OR

Zip Code Wage/Income Gap (%) vs State vs National
1.972111.8%26.6%(-0.248)#328.0%(-0.262)#448
2.972026.8%26.6%(-0.198)#1828.0%(-0.212)#1,802
3.972397.3%26.6%(-0.192)#2128.0%(-0.206)#1,994
4.972668.0%26.6%(-0.186)#2528.0%(-0.200)#2,188
5.972139.9%26.6%(-0.167)#3428.0%(-0.181)#2,768
6.9723310.3%26.6%(-0.163)#3628.0%(-0.177)#2,931
7.9721711.6%26.6%(-0.150)#4128.0%(-0.164)#3,350
8.9721814.3%26.6%(-0.123)#4628.0%(-0.137)#4,397
9.9720314.6%26.6%(-0.120)#4828.0%(-0.134)#4,513
10.9720616.1%26.6%(-0.105)#5128.0%(-0.119)#5,128
11.9721616.7%26.6%(-0.098)#5428.0%(-0.112)#5,435
12.9721417.3%26.6%(-0.093)#5628.0%(-0.107)#5,687
13.9723617.8%26.6%(-0.088)#6028.0%(-0.102)#5,929
14.9726719.5%26.6%(-0.070)#7728.0%(-0.084)#6,883
15.9723219.8%26.6%(-0.068)#8128.0%(-0.082)#7,021
16.9723021.9%26.6%(-0.047)#9628.0%(-0.061)#8,367
17.9721522.0%26.6%(-0.045)#10028.0%(-0.059)#8,472
18.9722522.3%26.6%(-0.042)#10228.0%(-0.056)#8,695
19.9722723.0%26.6%(-0.036)#10628.0%(-0.050)#9,045
20.9721223.3%26.6%(-0.033)#11028.0%(-0.047)#9,241
21.9722023.8%26.6%(-0.028)#11428.0%(-0.042)#9,641
22.9722223.9%26.6%(-0.026)#11628.0%(-0.040)#9,722
23.9722325.7%26.6%(-0.009)#12428.0%(-0.023)#10,915
24.9721926.3%26.6%(-0.003)#13428.0%(-0.017)#11,353
25.9720931.5%26.6%(+0.049)#17728.0%(+0.035)#15,041
26.9721034.3%26.6%(+0.077)#19628.0%(+0.063)#16,997
27.9722435.5%26.6%(+0.089)#20728.0%(+0.075)#17,854
28.9720537.6%26.6%(+0.111)#22328.0%(+0.097)#19,267
29.9722946.1%26.6%(+0.195)#25928.0%(+0.181)#23,456
30.9720148.4%26.6%(+0.218)#27328.0%(+0.204)#24,295
31.9722157.0%26.6%(+0.304)#30928.0%(+0.290)#26,287
32.9723160.9%26.6%(+0.343)#31728.0%(+0.329)#26,837

Common Questions

What are the Top 10 Zip Codes with the Lowest Wage/Income Gap (%) in Portland, OR?
Top 10 Zip Codes with the Lowest Wage/Income Gap (%) in Portland, OR are:
#1
1.8%
#2
6.8%
#3
7.3%
#4
8.0%
#5
9.9%
#6
10.3%
#7
11.6%
#8
14.3%
#9
14.6%
#10
16.1%
What zip code has the Lowest Wage/Income Gap (%) in Portland, OR?
97211 has the Lowest Wage/Income Gap (%) in Portland, OR with 1.8%.
What is the Wage / Income Gap in Percentage Terms in Portland, OR?
Wage / Income Gap in Percentage Terms in Portland is 16.6%.
What is the Wage / Income Gap in Percentage Terms in Oregon?
Wage / Income Gap in Percentage Terms in Oregon is 26.6%.
What is the Wage / Income Gap in Percentage Terms in the United States?
Wage / Income Gap in Percentage Terms in the United States is 28.0%.