Zip Codes with the Highest Percentage of Self-Employed / Not Incorporated in Portland, OR

RELATED REPORTS & OPTIONS

Self-Employed / Not Incorporated
Population
Families and Households
Female Fertility
Female Fertility (Unmarried)
Race (Community Size)
Race (Percentage)
Ancestry (Community Size)
AfghanAfricanAlaska NativeAlaskan AthabascanAlbanianAleutAlsatianAmericanApacheArabArgentineanArmenianAustralianAustrianBahamianBangladeshiBasqueBelgianBelizeanBhutaneseBlackfeetBolivianBrazilianBritishBritish West IndianBulgarianBurmeseCajunCambodianCanadianCelticCentral AmericanCentral American IndianCherokeeCheyenneChickasawChileanChineseChippewaChoctawColombianColvilleCosta RicanCreeCreekCroatianCubanCzechCzechoslovakianDanishDelawareDominicanDutchEastern EuropeanEcuadorianEgyptianEnglishEstonianEthiopianEuropeanFijianFilipinoFinnishFrenchFrench American IndianFrench CanadianGermanGerman RussianGhanaianGreekGuamanian / ChamorroGuatemalanGuyaneseHaitianHonduranHopiHungarianIcelanderIndian (Asian)IndonesianInupiatIranianIraqiIrishIroquoisIsraeliItalianJamaicanJapaneseJordanianKenyanKoreanLaotianLatvianLebaneseLiberianLithuanianLumbeeLuxembourgerMacedonianMalaysianMalteseMarshalleseMexicanMexican American IndianMongolianMoroccanNative HawaiianNavajoNepaleseNew ZealanderNicaraguanNigerianNorthern EuropeanNorwegianOkinawanOsagePaiutePakistaniPalestinianPanamanianParaguayanPennsylvania GermanPeruvianPimaPolishPortuguesePotawatomiPuebloPuerto RicanPuget Sound SalishRomanianRussianSalvadoranSamoanScandinavianScotch-IrishScottishSeminoleSenegaleseSerbianShoshoneSierra LeoneanSiouxSlavicSlovakSloveneSomaliSouth AfricanSouth AmericanSouth American IndianSoviet UnionSpaniardSpanishSpanish AmericanSpanish American IndianSri LankanSubsaharan AfricanSwedishSwissSyrianThaiTlingit-HaidaTonganTrinidadian and TobagonianTsimshianTurkishUgandanUkrainianUruguayanUteVenezuelanVietnameseWelshWest IndianYakamaYaquiYugoslavianYup'ik
Ancestry (Percentage)
AfghanAfricanAlaska NativeAlaskan AthabascanAlbanianAleutAlsatianAmericanApacheArabArgentineanArmenianAustralianAustrianBahamianBangladeshiBasqueBelgianBelizeanBhutaneseBlackfeetBolivianBrazilianBritishBritish West IndianBulgarianBurmeseCajunCambodianCanadianCelticCentral AmericanCentral American IndianCherokeeCheyenneChickasawChileanChineseChippewaChoctawColombianColvilleCosta RicanCreeCreekCroatianCubanCzechCzechoslovakianDanishDelawareDominicanDutchEastern EuropeanEcuadorianEgyptianEnglishEstonianEthiopianEuropeanFijianFilipinoFinnishFrenchFrench American IndianFrench CanadianGermanGerman RussianGhanaianGreekGuamanian / ChamorroGuatemalanGuyaneseHaitianHonduranHopiHungarianIcelanderIndian (Asian)IndonesianInupiatIranianIraqiIrishIroquoisIsraeliItalianJamaicanJapaneseJordanianKenyanKoreanLaotianLatvianLebaneseLiberianLithuanianLumbeeLuxembourgerMacedonianMalaysianMalteseMarshalleseMexicanMexican American IndianMongolianMoroccanNative HawaiianNavajoNepaleseNew ZealanderNicaraguanNigerianNorthern EuropeanNorwegianOkinawanOsagePaiutePakistaniPalestinianPanamanianParaguayanPennsylvania GermanPeruvianPimaPolishPortuguesePotawatomiPuebloPuerto RicanPuget Sound SalishRomanianRussianSalvadoranSamoanScandinavianScotch-IrishScottishSeminoleSenegaleseSerbianShoshoneSierra LeoneanSiouxSlavicSlovakSloveneSomaliSouth AfricanSouth AmericanSouth American IndianSoviet UnionSpaniardSpanishSpanish AmericanSpanish American IndianSri LankanSubsaharan AfricanSwedishSwissSyrianThaiTlingit-HaidaTonganTrinidadian and TobagonianTsimshianTurkishUgandanUkrainianUruguayanUteVenezuelanVietnameseWelshWest IndianYakamaYaquiYugoslavianYup'ik
Immigrant Origin (Total)
AfghanistanAfricaArgentinaArmeniaAsiaAustraliaAustriaBahamasBangladeshBarbadosBelarusBelgiumBelizeBosnia and HerzegovinaBrazilBulgariaBurma / MyanmarCambodiaCameroonCanadaCaribbeanCentral AmericaChileChinaColombiaCongoCosta RicaCroatiaCubaCzechoslovakiaDenmarkDominican RepublicEastern AfricaEastern AsiaEastern EuropeEcuadorEgyptEl SalvadorEnglandEritreaEthiopiaEuropeFijiFranceGermanyGhanaGreeceGuatemalaHaitiHondurasHong KongHungaryIndiaIndonesiaIranIraqIrelandIsraelItalyJamaicaJapanJordanKazakhstanKenyaKoreaKuwaitLaosLatin AmericaLatviaLebanonLiberiaLithuaniaMalaysiaMexicoMicronesiaMiddle AfricaMoldovaMoroccoNepalNetherlandsNicaraguaNigeriaNorth MacedoniaNorthern AfricaNorthern EuropeNorwayOceaniaPakistanPanamaPeruPhilippinesPolandPortugalRomaniaRussiaSaudi ArabiaScotlandSerbiaSingaporeSomaliaSouth AfricaSouth AmericaSouth Central AsiaSouth Eastern AsiaSouthern EuropeSpainSri LankaSudanSwedenSwitzerlandSyriaTaiwanThailandTrinidad and TobagoTurkeyUgandaUkraineUruguayUzbekistanVenezuelaVietnamWestern AfricaWestern AsiaWestern EuropeYemen
Immigrant Origin (Percentage)
AfghanistanAfricaArgentinaArmeniaAsiaAustraliaAustriaBahamasBangladeshBarbadosBelarusBelgiumBelizeBosnia and HerzegovinaBrazilBulgariaBurma / MyanmarCambodiaCameroonCanadaCaribbeanCentral AmericaChileChinaColombiaCongoCosta RicaCroatiaCubaCzechoslovakiaDenmarkDominican RepublicEastern AfricaEastern AsiaEastern EuropeEcuadorEgyptEl SalvadorEnglandEritreaEthiopiaEuropeFijiFranceGermanyGhanaGreeceGuatemalaHaitiHondurasHong KongHungaryIndiaIndonesiaIranIraqIrelandIsraelItalyJamaicaJapanJordanKazakhstanKenyaKoreaKuwaitLaosLatin AmericaLatviaLebanonLiberiaLithuaniaMalaysiaMexicoMicronesiaMiddle AfricaMoldovaMoroccoNepalNetherlandsNicaraguaNigeriaNorth MacedoniaNorthern AfricaNorthern EuropeNorwayOceaniaPakistanPanamaPeruPhilippinesPolandPortugalRomaniaRussiaSaudi ArabiaScotlandSerbiaSingaporeSomaliaSouth AfricaSouth AmericaSouth Central AsiaSouth Eastern AsiaSouthern EuropeSpainSri LankaSudanSwedenSwitzerlandSyriaTaiwanThailandTrinidad and TobagoTurkeyUgandaUkraineUruguayUzbekistanVenezuelaVietnamWestern AfricaWestern AsiaWestern EuropeYemen
Income
Income (Families)
Income (Households)
Poverty
Poverty (Families)
Unemployment
Employment Occupations
Employment Industries
Employer Class
Commute Time
Commute Means
School Enrollment
Education by Degree Field
Occupancy
Finances
Physical Characteristics
Portland
Compare Zip Codes
Comparison Subject

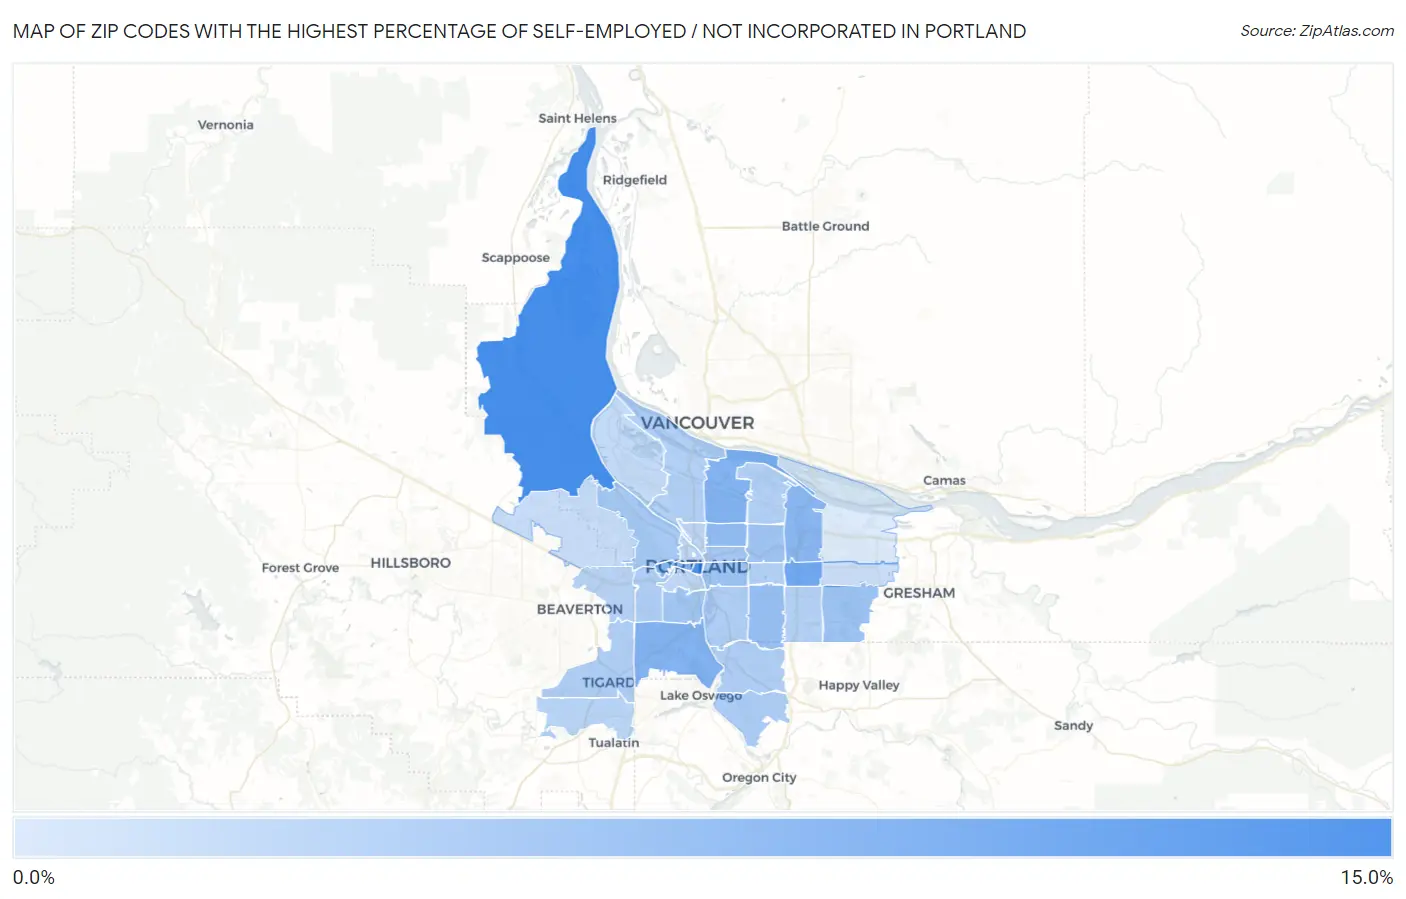
Map of Zip Codes with the Highest Percentage of Self-Employed / Not Incorporated in Portland

0.0%
15.0%
Zip Codes with the Highest Percentage of Self-Employed / Not Incorporated in Portland Map

Zip Codes with the Highest Percentage of Self-Employed / Not Incorporated in Portland, OR

Zip Code % Self-Employed / Not Incorporated vs State vs National
1.9723113.2%6.9%(+6.34)#785.8%(+7.43)#4,354
2.9720412.8%6.9%(+5.90)#805.8%(+6.99)#4,660
3.9721610.4%6.9%(+3.51)#1215.8%(+4.60)#6,871
4.972119.3%6.9%(+2.40)#1505.8%(+3.49)#8,294
5.972199.3%6.9%(+2.38)#1515.8%(+3.48)#8,317
6.972059.0%6.9%(+2.05)#1615.8%(+3.15)#8,836
7.972208.8%6.9%(+1.94)#1675.8%(+3.03)#9,069
8.972128.2%6.9%(+1.31)#1845.8%(+2.40)#10,209
9.972068.0%6.9%(+1.10)#1895.8%(+2.19)#10,616
10.972147.6%6.9%(+0.656)#2075.8%(+1.75)#11,619
11.972367.5%6.9%(+0.602)#2085.8%(+1.69)#11,753
12.972137.3%6.9%(+0.407)#2175.8%(+1.50)#12,257
13.972397.2%6.9%(+0.317)#2195.8%(+1.41)#12,455
14.972327.0%6.9%(+0.111)#2275.8%(+1.20)#13,004
15.972106.9%6.9%(-0.018)#2355.8%(+1.07)#13,349
16.972676.7%6.9%(-0.235)#2435.8%(+0.857)#13,931
17.972236.5%6.9%(-0.374)#2525.8%(+0.718)#14,357
18.972216.5%6.9%(-0.391)#2535.8%(+0.701)#14,420
19.972026.5%6.9%(-0.423)#2555.8%(+0.670)#14,514
20.972226.4%6.9%(-0.477)#2595.8%(+0.616)#14,681
21.972176.2%6.9%(-0.686)#2685.8%(+0.406)#15,350
22.972156.2%6.9%(-0.753)#2705.8%(+0.340)#15,561
23.972186.1%6.9%(-0.772)#2715.8%(+0.320)#15,629
24.972666.0%6.9%(-0.924)#2765.8%(+0.169)#16,126
25.972255.9%6.9%(-1.03)#2825.8%(+0.065)#16,449
26.972245.7%6.9%(-1.19)#2855.8%(-0.094)#16,955
27.972095.7%6.9%(-1.26)#2905.8%(-0.163)#17,224
28.972275.6%6.9%(-1.29)#2925.8%(-0.199)#17,357
29.972015.4%6.9%(-1.47)#3045.8%(-0.381)#18,011
30.972035.2%6.9%(-1.72)#3075.8%(-0.623)#18,949
31.972294.8%6.9%(-2.09)#3235.8%(-0.995)#20,338
32.972334.7%6.9%(-2.19)#3295.8%(-1.10)#20,729
33.972303.6%6.9%(-3.30)#3575.8%(-2.21)#24,691

Common Questions

What are the Top 10 Zip Codes with the Highest Percentage of Self-Employed / Not Incorporated in Portland, OR?
Top 10 Zip Codes with the Highest Percentage of Self-Employed / Not Incorporated in Portland, OR are:
#1
13.2%
#2
12.8%
#3
10.4%
#4
9.3%
#5
9.3%
#6
9.0%
#7
8.8%
#8
8.2%
#9
8.0%
#10
7.6%
What zip code has the Highest Percentage of Self-Employed / Not Incorporated in Portland, OR?
97231 has the Highest Percentage of Self-Employed / Not Incorporated in Portland, OR with 13.2%.
What is the Percentage of Self-Employed / Not Incorporated in Portland, OR?
Percentage of Self-Employed / Not Incorporated in Portland is 7.1%.
What is the Percentage of Self-Employed / Not Incorporated in Oregon?
Percentage of Self-Employed / Not Incorporated in Oregon is 6.9%.
What is the Percentage of Self-Employed / Not Incorporated in the United States?
Percentage of Self-Employed / Not Incorporated in the United States is 5.8%.