Zip Codes with the Highest Percentage of Families with Income Below $10,000 in Portland, OR

RELATED REPORTS & OPTIONS

Family Income | $0-10k
Population
Families and Households
Female Fertility
Female Fertility (Unmarried)
Race (Community Size)
Race (Percentage)
Ancestry (Community Size)
AfghanAfricanAlaska NativeAlaskan AthabascanAlbanianAleutAlsatianAmericanApacheArabArgentineanArmenianAustralianAustrianBahamianBangladeshiBasqueBelgianBelizeanBhutaneseBlackfeetBolivianBrazilianBritishBritish West IndianBulgarianBurmeseCajunCambodianCanadianCelticCentral AmericanCentral American IndianCherokeeCheyenneChickasawChileanChineseChippewaChoctawColombianColvilleCosta RicanCreeCreekCroatianCubanCzechCzechoslovakianDanishDelawareDominicanDutchEastern EuropeanEcuadorianEgyptianEnglishEstonianEthiopianEuropeanFijianFilipinoFinnishFrenchFrench American IndianFrench CanadianGermanGerman RussianGhanaianGreekGuamanian / ChamorroGuatemalanGuyaneseHaitianHonduranHopiHungarianIcelanderIndian (Asian)IndonesianInupiatIranianIraqiIrishIroquoisIsraeliItalianJamaicanJapaneseJordanianKenyanKoreanLaotianLatvianLebaneseLiberianLithuanianLumbeeLuxembourgerMacedonianMalaysianMalteseMarshalleseMexicanMexican American IndianMongolianMoroccanNative HawaiianNavajoNepaleseNew ZealanderNicaraguanNigerianNorthern EuropeanNorwegianOkinawanOsagePaiutePakistaniPalestinianPanamanianParaguayanPennsylvania GermanPeruvianPimaPolishPortuguesePotawatomiPuebloPuerto RicanPuget Sound SalishRomanianRussianSalvadoranSamoanScandinavianScotch-IrishScottishSeminoleSenegaleseSerbianShoshoneSierra LeoneanSiouxSlavicSlovakSloveneSomaliSouth AfricanSouth AmericanSouth American IndianSoviet UnionSpaniardSpanishSpanish AmericanSpanish American IndianSri LankanSubsaharan AfricanSwedishSwissSyrianThaiTlingit-HaidaTonganTrinidadian and TobagonianTsimshianTurkishUgandanUkrainianUruguayanUteVenezuelanVietnameseWelshWest IndianYakamaYaquiYugoslavianYup'ik
Ancestry (Percentage)
AfghanAfricanAlaska NativeAlaskan AthabascanAlbanianAleutAlsatianAmericanApacheArabArgentineanArmenianAustralianAustrianBahamianBangladeshiBasqueBelgianBelizeanBhutaneseBlackfeetBolivianBrazilianBritishBritish West IndianBulgarianBurmeseCajunCambodianCanadianCelticCentral AmericanCentral American IndianCherokeeCheyenneChickasawChileanChineseChippewaChoctawColombianColvilleCosta RicanCreeCreekCroatianCubanCzechCzechoslovakianDanishDelawareDominicanDutchEastern EuropeanEcuadorianEgyptianEnglishEstonianEthiopianEuropeanFijianFilipinoFinnishFrenchFrench American IndianFrench CanadianGermanGerman RussianGhanaianGreekGuamanian / ChamorroGuatemalanGuyaneseHaitianHonduranHopiHungarianIcelanderIndian (Asian)IndonesianInupiatIranianIraqiIrishIroquoisIsraeliItalianJamaicanJapaneseJordanianKenyanKoreanLaotianLatvianLebaneseLiberianLithuanianLumbeeLuxembourgerMacedonianMalaysianMalteseMarshalleseMexicanMexican American IndianMongolianMoroccanNative HawaiianNavajoNepaleseNew ZealanderNicaraguanNigerianNorthern EuropeanNorwegianOkinawanOsagePaiutePakistaniPalestinianPanamanianParaguayanPennsylvania GermanPeruvianPimaPolishPortuguesePotawatomiPuebloPuerto RicanPuget Sound SalishRomanianRussianSalvadoranSamoanScandinavianScotch-IrishScottishSeminoleSenegaleseSerbianShoshoneSierra LeoneanSiouxSlavicSlovakSloveneSomaliSouth AfricanSouth AmericanSouth American IndianSoviet UnionSpaniardSpanishSpanish AmericanSpanish American IndianSri LankanSubsaharan AfricanSwedishSwissSyrianThaiTlingit-HaidaTonganTrinidadian and TobagonianTsimshianTurkishUgandanUkrainianUruguayanUteVenezuelanVietnameseWelshWest IndianYakamaYaquiYugoslavianYup'ik
Immigrant Origin (Total)
AfghanistanAfricaArgentinaArmeniaAsiaAustraliaAustriaBahamasBangladeshBarbadosBelarusBelgiumBelizeBosnia and HerzegovinaBrazilBulgariaBurma / MyanmarCambodiaCameroonCanadaCaribbeanCentral AmericaChileChinaColombiaCongoCosta RicaCroatiaCubaCzechoslovakiaDenmarkDominican RepublicEastern AfricaEastern AsiaEastern EuropeEcuadorEgyptEl SalvadorEnglandEritreaEthiopiaEuropeFijiFranceGermanyGhanaGreeceGuatemalaHaitiHondurasHong KongHungaryIndiaIndonesiaIranIraqIrelandIsraelItalyJamaicaJapanJordanKazakhstanKenyaKoreaKuwaitLaosLatin AmericaLatviaLebanonLiberiaLithuaniaMalaysiaMexicoMicronesiaMiddle AfricaMoldovaMoroccoNepalNetherlandsNicaraguaNigeriaNorth MacedoniaNorthern AfricaNorthern EuropeNorwayOceaniaPakistanPanamaPeruPhilippinesPolandPortugalRomaniaRussiaSaudi ArabiaScotlandSerbiaSingaporeSomaliaSouth AfricaSouth AmericaSouth Central AsiaSouth Eastern AsiaSouthern EuropeSpainSri LankaSudanSwedenSwitzerlandSyriaTaiwanThailandTrinidad and TobagoTurkeyUgandaUkraineUruguayUzbekistanVenezuelaVietnamWestern AfricaWestern AsiaWestern EuropeYemen
Immigrant Origin (Percentage)
AfghanistanAfricaArgentinaArmeniaAsiaAustraliaAustriaBahamasBangladeshBarbadosBelarusBelgiumBelizeBosnia and HerzegovinaBrazilBulgariaBurma / MyanmarCambodiaCameroonCanadaCaribbeanCentral AmericaChileChinaColombiaCongoCosta RicaCroatiaCubaCzechoslovakiaDenmarkDominican RepublicEastern AfricaEastern AsiaEastern EuropeEcuadorEgyptEl SalvadorEnglandEritreaEthiopiaEuropeFijiFranceGermanyGhanaGreeceGuatemalaHaitiHondurasHong KongHungaryIndiaIndonesiaIranIraqIrelandIsraelItalyJamaicaJapanJordanKazakhstanKenyaKoreaKuwaitLaosLatin AmericaLatviaLebanonLiberiaLithuaniaMalaysiaMexicoMicronesiaMiddle AfricaMoldovaMoroccoNepalNetherlandsNicaraguaNigeriaNorth MacedoniaNorthern AfricaNorthern EuropeNorwayOceaniaPakistanPanamaPeruPhilippinesPolandPortugalRomaniaRussiaSaudi ArabiaScotlandSerbiaSingaporeSomaliaSouth AfricaSouth AmericaSouth Central AsiaSouth Eastern AsiaSouthern EuropeSpainSri LankaSudanSwedenSwitzerlandSyriaTaiwanThailandTrinidad and TobagoTurkeyUgandaUkraineUruguayUzbekistanVenezuelaVietnamWestern AfricaWestern AsiaWestern EuropeYemen
Income
Income (Families)
Income (Households)
Poverty
Poverty (Families)
Unemployment
Employment Occupations
Employment Industries
Employer Class
Commute Time
Commute Means
School Enrollment
Education by Degree Field
Occupancy
Finances
Physical Characteristics
Portland
Compare Zip Codes
Comparison Subject

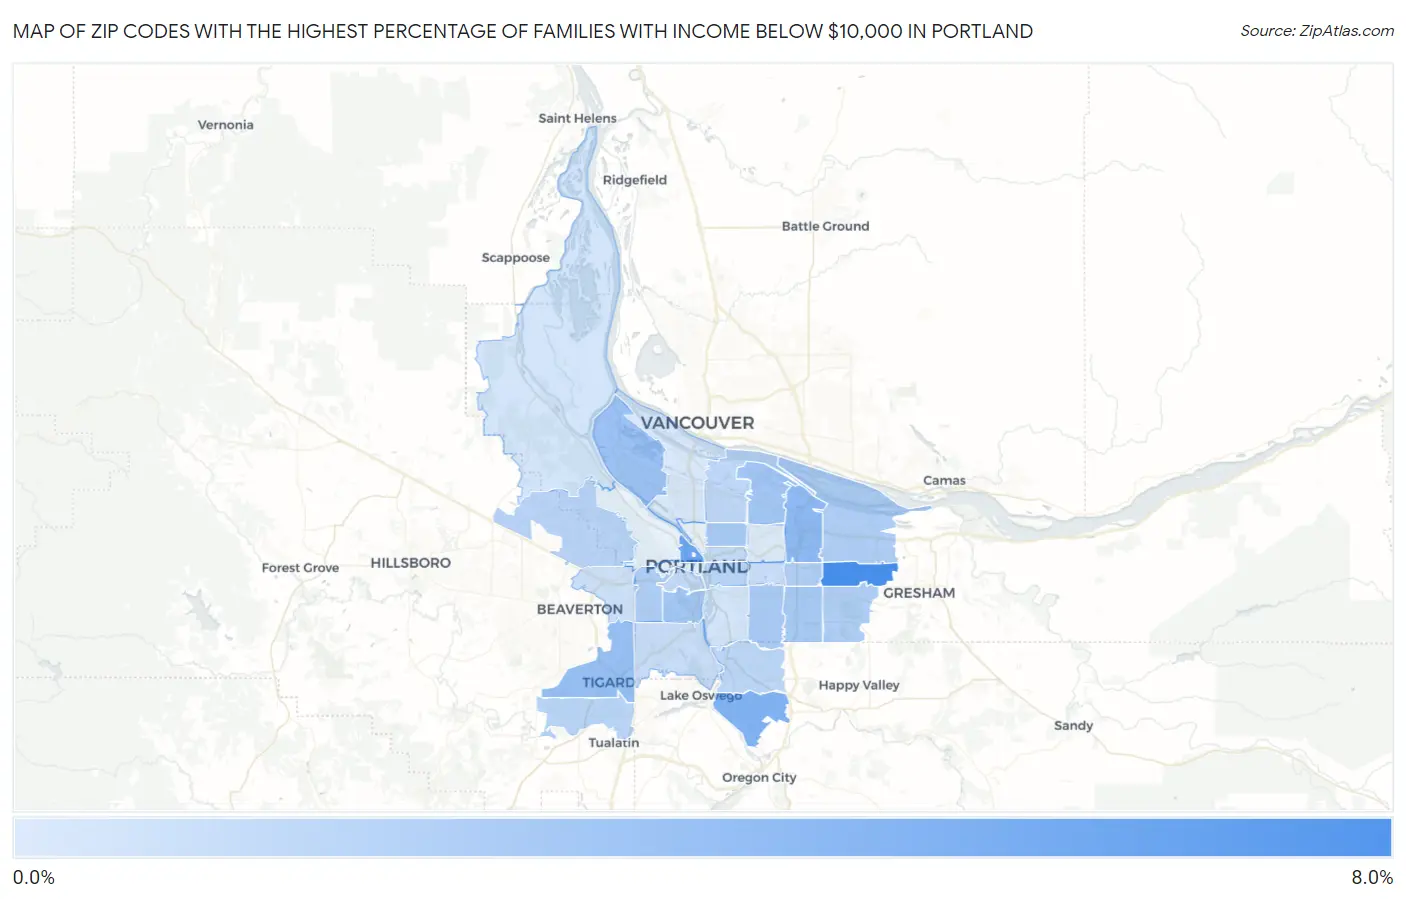
Map of Zip Codes with the Highest Percentage of Families with Income Below $10,000 in Portland

0.0%
8.0%
Zip Codes with the Highest Percentage of Families with Income Below $10,000 in Portland Map

Zip Codes with the Highest Percentage of Families with Income Below $10,000 in Portland, OR

Zip Code Families with Income < $10k vs State vs National
1.972337.3%2.7%(+4.60)#283.1%(+4.20)#3,395
2.972095.5%2.7%(+2.80)#433.1%(+2.40)#5,328
3.972674.7%2.7%(+2.00)#563.1%(+1.60)#6,627
4.972204.0%2.7%(+1.30)#753.1%(+0.900)#8,161
5.972233.6%2.7%(+0.900)#933.1%(+0.500)#9,215
6.972033.4%2.7%(+0.700)#1053.1%(+0.300)#9,800
7.972393.1%2.7%(+0.400)#1243.1%(=0.000)#10,845
8.972183.1%2.7%(+0.400)#1253.1%(=0.000)#10,865
9.972662.9%2.7%(+0.200)#1333.1%(-0.200)#11,469
10.972122.9%2.7%(+0.200)#1343.1%(-0.200)#11,498
11.972062.8%2.7%(+0.100)#1383.1%(-0.300)#11,819
12.972302.6%2.7%(-0.100)#1493.1%(-0.500)#12,621
13.972162.6%2.7%(-0.100)#1503.1%(-0.500)#12,734
14.972212.6%2.7%(-0.100)#1523.1%(-0.500)#12,766
15.972362.5%2.7%(-0.200)#1563.1%(-0.600)#13,061
16.972292.2%2.7%(-0.500)#1693.1%(-0.900)#14,302
17.972242.1%2.7%(-0.600)#1723.1%(-1.000)#14,820
18.972142.1%2.7%(-0.600)#1733.1%(-1.000)#14,857
19.972222.0%2.7%(-0.700)#1823.1%(-1.10)#15,293
20.972111.9%2.7%(-0.800)#1873.1%(-1.20)#15,784
21.972011.8%2.7%(-0.900)#1973.1%(-1.30)#16,366
22.972321.7%2.7%(-1.00)#2073.1%(-1.40)#16,850
23.972191.5%2.7%(-1.20)#2163.1%(-1.60)#17,679
24.972151.4%2.7%(-1.30)#2273.1%(-1.70)#18,314
25.972251.2%2.7%(-1.50)#2363.1%(-1.90)#19,291
26.972021.0%2.7%(-1.70)#2463.1%(-2.10)#20,208
27.972311.0%2.7%(-1.70)#2513.1%(-2.10)#20,492
28.972170.80%2.7%(-1.90)#2583.1%(-2.30)#21,219
29.972130.60%2.7%(-2.10)#2673.1%(-2.50)#22,174

Common Questions

What are the Top 10 Zip Codes with the Highest Percentage of Families with Income Below $10,000 in Portland, OR?
Top 10 Zip Codes with the Highest Percentage of Families with Income Below $10,000 in Portland, OR are:
#1
7.3%
#2
5.5%
#3
4.7%
#4
4.0%
#5
3.6%
#6
3.4%
#7
3.1%
#8
3.1%
#9
2.9%
#10
2.9%
What zip code has the Highest Percentage of Families with Income Below $10,000 in Portland, OR?
97233 has the Highest Percentage of Families with Income Below $10,000 in Portland, OR with 7.3%.
What is the Percentage of Families with Income Below $10,000 in Portland, OR?
Percentage of Families with Income Below $10,000 in Portland is 2.4%.
What is the Percentage of Families with Income Below $10,000 in Oregon?
Percentage of Families with Income Below $10,000 in Oregon is 2.7%.
What is the Percentage of Families with Income Below $10,000 in the United States?
Percentage of Families with Income Below $10,000 in the United States is 3.1%.