Zip Codes with the Highest Percentage of Population Employed in Health Diagnosing & Treating in Portland, OR
RELATED REPORTS & OPTIONS
Health Diagnosing & Treating
Portland
Compare Zip Codes
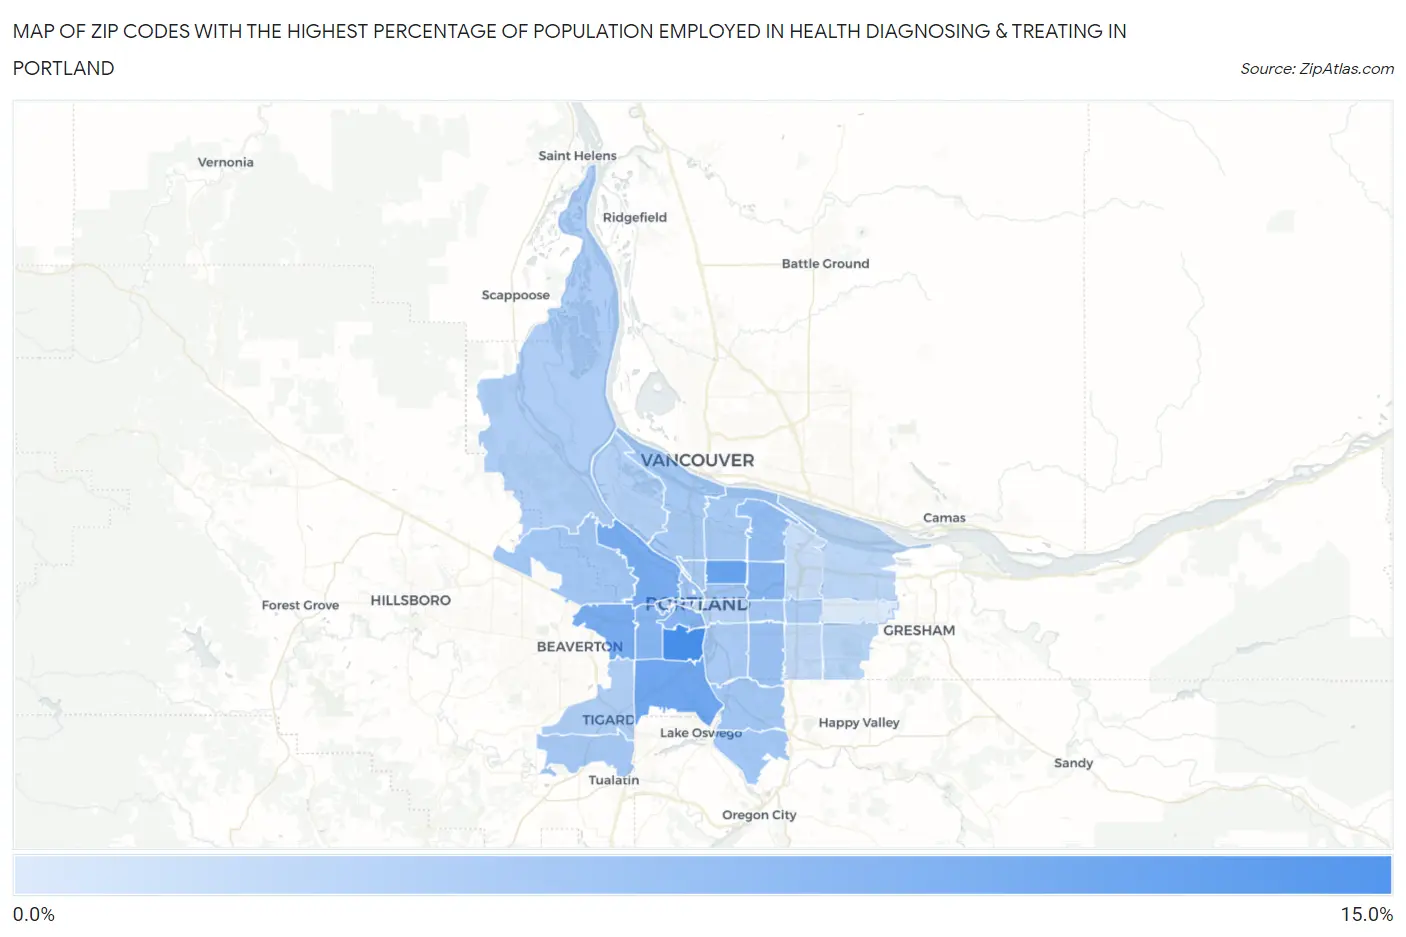
Map of Zip Codes with the Highest Percentage of Population Employed in Health Diagnosing & Treating in Portland
2.7%
14.3%
Zip Codes with the Highest Percentage of Population Employed in Health Diagnosing & Treating in Portland, OR
| Zip Code | % Employed | vs State | vs National | |
| 1. | 97239 | 14.3% | 6.1%(+8.23)#15 | 6.2%(+8.06)#1,315 |
| 2. | 97212 | 11.5% | 6.1%(+5.45)#20 | 6.2%(+5.27)#2,513 |
| 3. | 97219 | 11.0% | 6.1%(+4.91)#22 | 6.2%(+4.73)#2,902 |
| 4. | 97210 | 10.2% | 6.1%(+4.16)#31 | 6.2%(+3.98)#3,620 |
| 5. | 97225 | 10.2% | 6.1%(+4.15)#33 | 6.2%(+3.97)#3,633 |
| 6. | 97221 | 9.2% | 6.1%(+3.15)#43 | 6.2%(+2.98)#4,989 |
| 7. | 97201 | 9.1% | 6.1%(+3.03)#44 | 6.2%(+2.85)#5,183 |
| 8. | 97213 | 9.1% | 6.1%(+3.02)#45 | 6.2%(+2.85)#5,187 |
| 9. | 97218 | 8.1% | 6.1%(+2.00)#63 | 6.2%(+1.83)#7,325 |
| 10. | 97206 | 7.6% | 6.1%(+1.50)#69 | 6.2%(+1.32)#8,598 |
| 11. | 97209 | 7.4% | 6.1%(+1.35)#74 | 6.2%(+1.18)#9,049 |
| 12. | 97232 | 7.4% | 6.1%(+1.30)#76 | 6.2%(+1.12)#9,208 |
| 13. | 97229 | 7.1% | 6.1%(+1.05)#82 | 6.2%(+0.871)#9,980 |
| 14. | 97222 | 7.1% | 6.1%(+1.04)#83 | 6.2%(+0.863)#10,009 |
| 15. | 97267 | 7.1% | 6.1%(+1.00)#85 | 6.2%(+0.825)#10,139 |
| 16. | 97224 | 6.9% | 6.1%(+0.787)#93 | 6.2%(+0.611)#10,822 |
| 17. | 97215 | 6.8% | 6.1%(+0.711)#96 | 6.2%(+0.535)#11,057 |
| 18. | 97211 | 6.6% | 6.1%(+0.539)#101 | 6.2%(+0.363)#11,628 |
| 19. | 97217 | 6.6% | 6.1%(+0.535)#102 | 6.2%(+0.360)#11,639 |
| 20. | 97202 | 6.6% | 6.1%(+0.493)#104 | 6.2%(+0.317)#11,815 |
| 21. | 97227 | 6.5% | 6.1%(+0.452)#105 | 6.2%(+0.276)#11,956 |
| 22. | 97205 | 6.3% | 6.1%(+0.211)#111 | 6.2%(+0.035)#12,837 |
| 23. | 97231 | 6.1% | 6.1%(+0.062)#113 | 6.2%(-0.114)#13,402 |
| 24. | 97223 | 6.1% | 6.1%(+0.048)#115 | 6.2%(-0.128)#13,473 |
| 25. | 97216 | 6.1% | 6.1%(+0.034)#116 | 6.2%(-0.141)#13,517 |
| 26. | 97203 | 5.9% | 6.1%(-0.197)#126 | 6.2%(-0.373)#14,336 |
| 27. | 97214 | 5.4% | 6.1%(-0.629)#149 | 6.2%(-0.805)#16,013 |
| 28. | 97236 | 5.3% | 6.1%(-0.760)#159 | 6.2%(-0.936)#16,523 |
| 29. | 97230 | 5.1% | 6.1%(-0.958)#171 | 6.2%(-1.13)#17,287 |
| 30. | 97204 | 4.9% | 6.1%(-1.16)#183 | 6.2%(-1.34)#18,079 |
| 31. | 97266 | 4.9% | 6.1%(-1.21)#185 | 6.2%(-1.39)#18,273 |
| 32. | 97220 | 4.3% | 6.1%(-1.79)#209 | 6.2%(-1.97)#20,416 |
| 33. | 97233 | 2.7% | 6.1%(-3.34)#281 | 6.2%(-3.52)#24,976 |
1
Common Questions
What are the Top 10 Zip Codes with the Highest Percentage of Population Employed in Health Diagnosing & Treating in Portland, OR?
Top 10 Zip Codes with the Highest Percentage of Population Employed in Health Diagnosing & Treating in Portland, OR are:
What zip code has the Highest Percentage of Population Employed in Health Diagnosing & Treating in Portland, OR?
97239 has the Highest Percentage of Population Employed in Health Diagnosing & Treating in Portland, OR with 14.3%.
What is the Percentage of Population Employed in Health Diagnosing & Treating in Portland, OR?
Percentage of Population Employed in Health Diagnosing & Treating in Portland is 7.3%.
What is the Percentage of Population Employed in Health Diagnosing & Treating in Oregon?
Percentage of Population Employed in Health Diagnosing & Treating in Oregon is 6.1%.
What is the Percentage of Population Employed in Health Diagnosing & Treating in the United States?
Percentage of Population Employed in Health Diagnosing & Treating in the United States is 6.2%.