Zip Codes with the Highest Percentage of Population Employed in Computer, Engineering & Science in Portland, OR

RELATED REPORTS & OPTIONS

Computer, Engineering & Science
Population
Families and Households
Female Fertility
Female Fertility (Unmarried)
Race (Community Size)
Race (Percentage)
Ancestry (Community Size)
AfghanAfricanAlaska NativeAlaskan AthabascanAlbanianAleutAlsatianAmericanApacheArabArgentineanArmenianAustralianAustrianBahamianBangladeshiBasqueBelgianBelizeanBhutaneseBlackfeetBolivianBrazilianBritishBritish West IndianBulgarianBurmeseCajunCambodianCanadianCelticCentral AmericanCentral American IndianCherokeeCheyenneChickasawChileanChineseChippewaChoctawColombianColvilleCosta RicanCreeCreekCroatianCubanCzechCzechoslovakianDanishDelawareDominicanDutchEastern EuropeanEcuadorianEgyptianEnglishEstonianEthiopianEuropeanFijianFilipinoFinnishFrenchFrench American IndianFrench CanadianGermanGerman RussianGhanaianGreekGuamanian / ChamorroGuatemalanGuyaneseHaitianHonduranHopiHungarianIcelanderIndian (Asian)IndonesianInupiatIranianIraqiIrishIroquoisIsraeliItalianJamaicanJapaneseJordanianKenyanKoreanLaotianLatvianLebaneseLiberianLithuanianLumbeeLuxembourgerMacedonianMalaysianMalteseMarshalleseMexicanMexican American IndianMongolianMoroccanNative HawaiianNavajoNepaleseNew ZealanderNicaraguanNigerianNorthern EuropeanNorwegianOkinawanOsagePaiutePakistaniPalestinianPanamanianParaguayanPennsylvania GermanPeruvianPimaPolishPortuguesePotawatomiPuebloPuerto RicanPuget Sound SalishRomanianRussianSalvadoranSamoanScandinavianScotch-IrishScottishSeminoleSenegaleseSerbianShoshoneSierra LeoneanSiouxSlavicSlovakSloveneSomaliSouth AfricanSouth AmericanSouth American IndianSoviet UnionSpaniardSpanishSpanish AmericanSpanish American IndianSri LankanSubsaharan AfricanSwedishSwissSyrianThaiTlingit-HaidaTonganTrinidadian and TobagonianTsimshianTurkishUgandanUkrainianUruguayanUteVenezuelanVietnameseWelshWest IndianYakamaYaquiYugoslavianYup'ik
Ancestry (Percentage)
AfghanAfricanAlaska NativeAlaskan AthabascanAlbanianAleutAlsatianAmericanApacheArabArgentineanArmenianAustralianAustrianBahamianBangladeshiBasqueBelgianBelizeanBhutaneseBlackfeetBolivianBrazilianBritishBritish West IndianBulgarianBurmeseCajunCambodianCanadianCelticCentral AmericanCentral American IndianCherokeeCheyenneChickasawChileanChineseChippewaChoctawColombianColvilleCosta RicanCreeCreekCroatianCubanCzechCzechoslovakianDanishDelawareDominicanDutchEastern EuropeanEcuadorianEgyptianEnglishEstonianEthiopianEuropeanFijianFilipinoFinnishFrenchFrench American IndianFrench CanadianGermanGerman RussianGhanaianGreekGuamanian / ChamorroGuatemalanGuyaneseHaitianHonduranHopiHungarianIcelanderIndian (Asian)IndonesianInupiatIranianIraqiIrishIroquoisIsraeliItalianJamaicanJapaneseJordanianKenyanKoreanLaotianLatvianLebaneseLiberianLithuanianLumbeeLuxembourgerMacedonianMalaysianMalteseMarshalleseMexicanMexican American IndianMongolianMoroccanNative HawaiianNavajoNepaleseNew ZealanderNicaraguanNigerianNorthern EuropeanNorwegianOkinawanOsagePaiutePakistaniPalestinianPanamanianParaguayanPennsylvania GermanPeruvianPimaPolishPortuguesePotawatomiPuebloPuerto RicanPuget Sound SalishRomanianRussianSalvadoranSamoanScandinavianScotch-IrishScottishSeminoleSenegaleseSerbianShoshoneSierra LeoneanSiouxSlavicSlovakSloveneSomaliSouth AfricanSouth AmericanSouth American IndianSoviet UnionSpaniardSpanishSpanish AmericanSpanish American IndianSri LankanSubsaharan AfricanSwedishSwissSyrianThaiTlingit-HaidaTonganTrinidadian and TobagonianTsimshianTurkishUgandanUkrainianUruguayanUteVenezuelanVietnameseWelshWest IndianYakamaYaquiYugoslavianYup'ik
Immigrant Origin (Total)
AfghanistanAfricaArgentinaArmeniaAsiaAustraliaAustriaBahamasBangladeshBarbadosBelarusBelgiumBelizeBosnia and HerzegovinaBrazilBulgariaBurma / MyanmarCambodiaCameroonCanadaCaribbeanCentral AmericaChileChinaColombiaCongoCosta RicaCroatiaCubaCzechoslovakiaDenmarkDominican RepublicEastern AfricaEastern AsiaEastern EuropeEcuadorEgyptEl SalvadorEnglandEritreaEthiopiaEuropeFijiFranceGermanyGhanaGreeceGuatemalaHaitiHondurasHong KongHungaryIndiaIndonesiaIranIraqIrelandIsraelItalyJamaicaJapanJordanKazakhstanKenyaKoreaKuwaitLaosLatin AmericaLatviaLebanonLiberiaLithuaniaMalaysiaMexicoMicronesiaMiddle AfricaMoldovaMoroccoNepalNetherlandsNicaraguaNigeriaNorth MacedoniaNorthern AfricaNorthern EuropeNorwayOceaniaPakistanPanamaPeruPhilippinesPolandPortugalRomaniaRussiaSaudi ArabiaScotlandSerbiaSingaporeSomaliaSouth AfricaSouth AmericaSouth Central AsiaSouth Eastern AsiaSouthern EuropeSpainSri LankaSudanSwedenSwitzerlandSyriaTaiwanThailandTrinidad and TobagoTurkeyUgandaUkraineUruguayUzbekistanVenezuelaVietnamWestern AfricaWestern AsiaWestern EuropeYemen
Immigrant Origin (Percentage)
AfghanistanAfricaArgentinaArmeniaAsiaAustraliaAustriaBahamasBangladeshBarbadosBelarusBelgiumBelizeBosnia and HerzegovinaBrazilBulgariaBurma / MyanmarCambodiaCameroonCanadaCaribbeanCentral AmericaChileChinaColombiaCongoCosta RicaCroatiaCubaCzechoslovakiaDenmarkDominican RepublicEastern AfricaEastern AsiaEastern EuropeEcuadorEgyptEl SalvadorEnglandEritreaEthiopiaEuropeFijiFranceGermanyGhanaGreeceGuatemalaHaitiHondurasHong KongHungaryIndiaIndonesiaIranIraqIrelandIsraelItalyJamaicaJapanJordanKazakhstanKenyaKoreaKuwaitLaosLatin AmericaLatviaLebanonLiberiaLithuaniaMalaysiaMexicoMicronesiaMiddle AfricaMoldovaMoroccoNepalNetherlandsNicaraguaNigeriaNorth MacedoniaNorthern AfricaNorthern EuropeNorwayOceaniaPakistanPanamaPeruPhilippinesPolandPortugalRomaniaRussiaSaudi ArabiaScotlandSerbiaSingaporeSomaliaSouth AfricaSouth AmericaSouth Central AsiaSouth Eastern AsiaSouthern EuropeSpainSri LankaSudanSwedenSwitzerlandSyriaTaiwanThailandTrinidad and TobagoTurkeyUgandaUkraineUruguayUzbekistanVenezuelaVietnamWestern AfricaWestern AsiaWestern EuropeYemen
Income
Income (Families)
Income (Households)
Poverty
Poverty (Families)
Unemployment
Employment Occupations
Employment Industries
Employer Class
Commute Time
Commute Means
School Enrollment
Education by Degree Field
Occupancy
Finances
Physical Characteristics
Portland
Compare Zip Codes
Comparison Subject

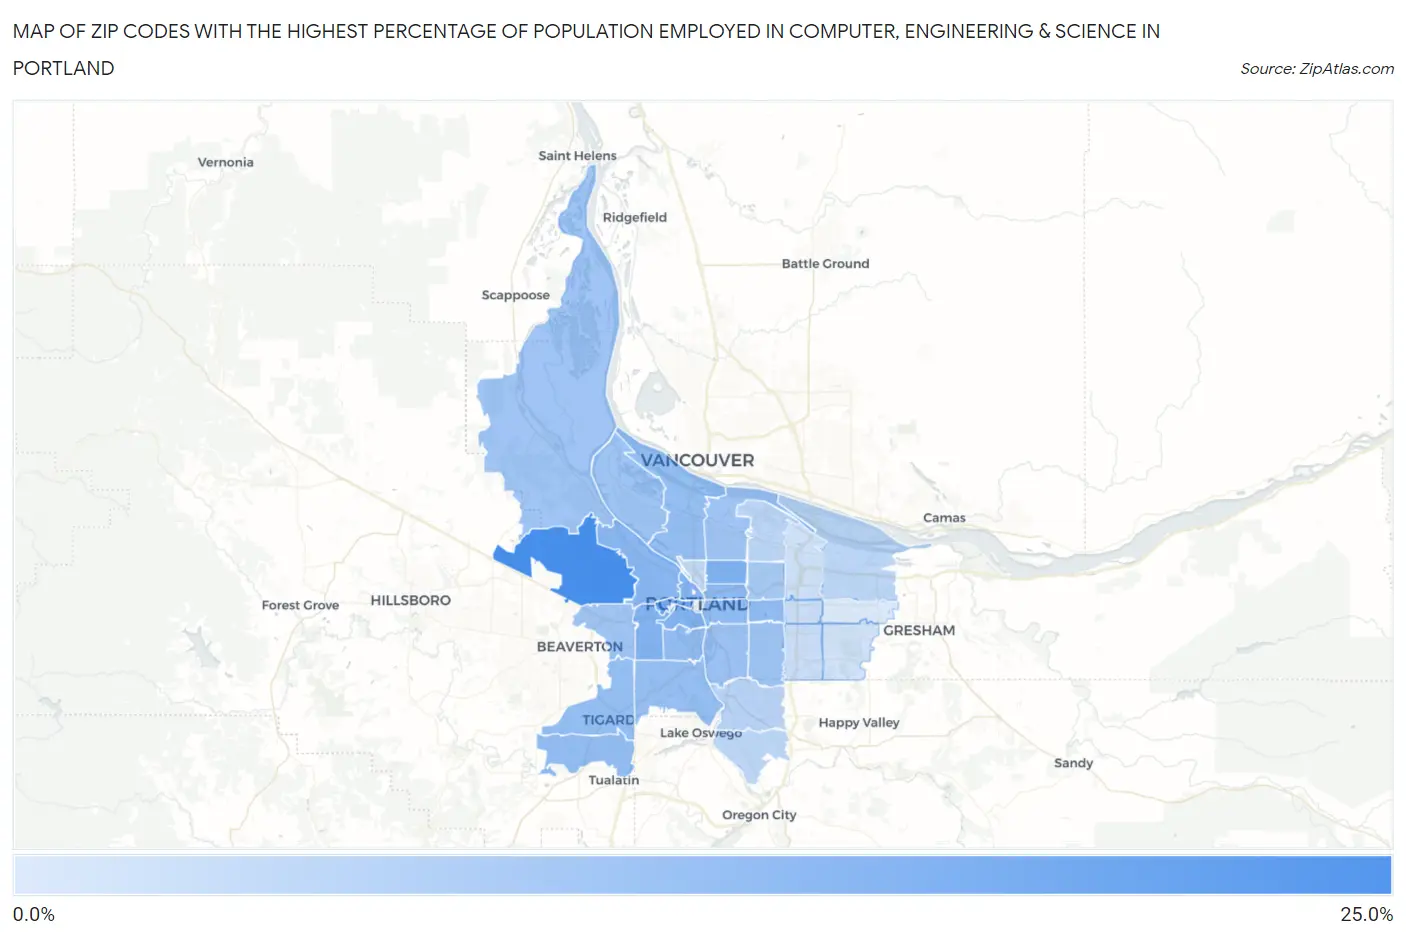
Map of Zip Codes with the Highest Percentage of Population Employed in Computer, Engineering & Science in Portland

0.0%
25.0%
Zip Codes with the Highest Percentage of Population Employed in Computer, Engineering & Science in Portland Map

Zip Codes with the Highest Percentage of Population Employed in Computer, Engineering & Science in Portland, OR

Zip Code % Employed vs State vs National
1.9722922.1%7.5%(+14.5)#76.8%(+15.3)#386
2.9720516.6%7.5%(+9.07)#146.8%(+9.85)#869
3.9721214.5%7.5%(+6.98)#206.8%(+7.76)#1,215
4.9720114.2%7.5%(+6.62)#216.8%(+7.40)#1,297
5.9722114.1%7.5%(+6.54)#226.8%(+7.32)#1,312
6.9720913.7%7.5%(+6.16)#236.8%(+6.94)#1,431
7.9721013.4%7.5%(+5.82)#256.8%(+6.60)#1,515
8.9723212.6%7.5%(+5.05)#336.8%(+5.83)#1,792
9.9721412.4%7.5%(+4.87)#346.8%(+5.65)#1,860
10.9721512.3%7.5%(+4.77)#356.8%(+5.55)#1,887
11.9722412.1%7.5%(+4.54)#386.8%(+5.32)#1,998
12.9723911.9%7.5%(+4.39)#416.8%(+5.17)#2,064
13.9722311.8%7.5%(+4.24)#436.8%(+5.02)#2,138
14.9721711.7%7.5%(+4.18)#446.8%(+4.96)#2,162
15.9721911.4%7.5%(+3.87)#466.8%(+4.65)#2,350
16.9720211.0%7.5%(+3.43)#486.8%(+4.21)#2,584
17.9720310.7%7.5%(+3.12)#506.8%(+3.90)#2,747
18.9720610.5%7.5%(+2.95)#526.8%(+3.73)#2,871
19.9723110.3%7.5%(+2.76)#556.8%(+3.54)#2,988
20.9721110.3%7.5%(+2.76)#566.8%(+3.54)#2,991
21.9722510.2%7.5%(+2.70)#576.8%(+3.48)#3,034
22.972139.6%7.5%(+2.05)#656.8%(+2.83)#3,529
23.972227.6%7.5%(+0.075)#886.8%(+0.855)#5,804
24.972307.0%7.5%(-0.594)#1026.8%(+0.187)#6,883
25.972186.9%7.5%(-0.641)#1056.8%(+0.139)#6,964
26.972676.9%7.5%(-0.692)#1066.8%(+0.088)#7,057
27.972276.4%7.5%(-1.17)#1146.8%(-0.393)#7,978
28.972165.4%7.5%(-2.15)#1436.8%(-1.37)#10,335
29.972665.2%7.5%(-2.30)#1516.8%(-1.52)#10,702
30.972204.8%7.5%(-2.72)#1656.8%(-1.94)#11,885
31.972364.6%7.5%(-2.99)#1776.8%(-2.20)#12,624
32.972333.1%7.5%(-4.40)#2406.8%(-3.62)#17,594

Common Questions

What are the Top 10 Zip Codes with the Highest Percentage of Population Employed in Computer, Engineering & Science in Portland, OR?
Top 10 Zip Codes with the Highest Percentage of Population Employed in Computer, Engineering & Science in Portland, OR are:
#1
22.1%
#2
16.6%
#3
14.5%
#4
14.2%
#5
14.1%
#6
13.7%
#7
13.4%
#8
12.6%
#9
12.4%
#10
12.3%
What zip code has the Highest Percentage of Population Employed in Computer, Engineering & Science in Portland, OR?
97229 has the Highest Percentage of Population Employed in Computer, Engineering & Science in Portland, OR with 22.1%.
What is the Percentage of Population Employed in Computer, Engineering & Science in Portland, OR?
Percentage of Population Employed in Computer, Engineering & Science in Portland is 10.1%.
What is the Percentage of Population Employed in Computer, Engineering & Science in Oregon?
Percentage of Population Employed in Computer, Engineering & Science in Oregon is 7.5%.
What is the Percentage of Population Employed in Computer, Engineering & Science in the United States?
Percentage of Population Employed in Computer, Engineering & Science in the United States is 6.8%.