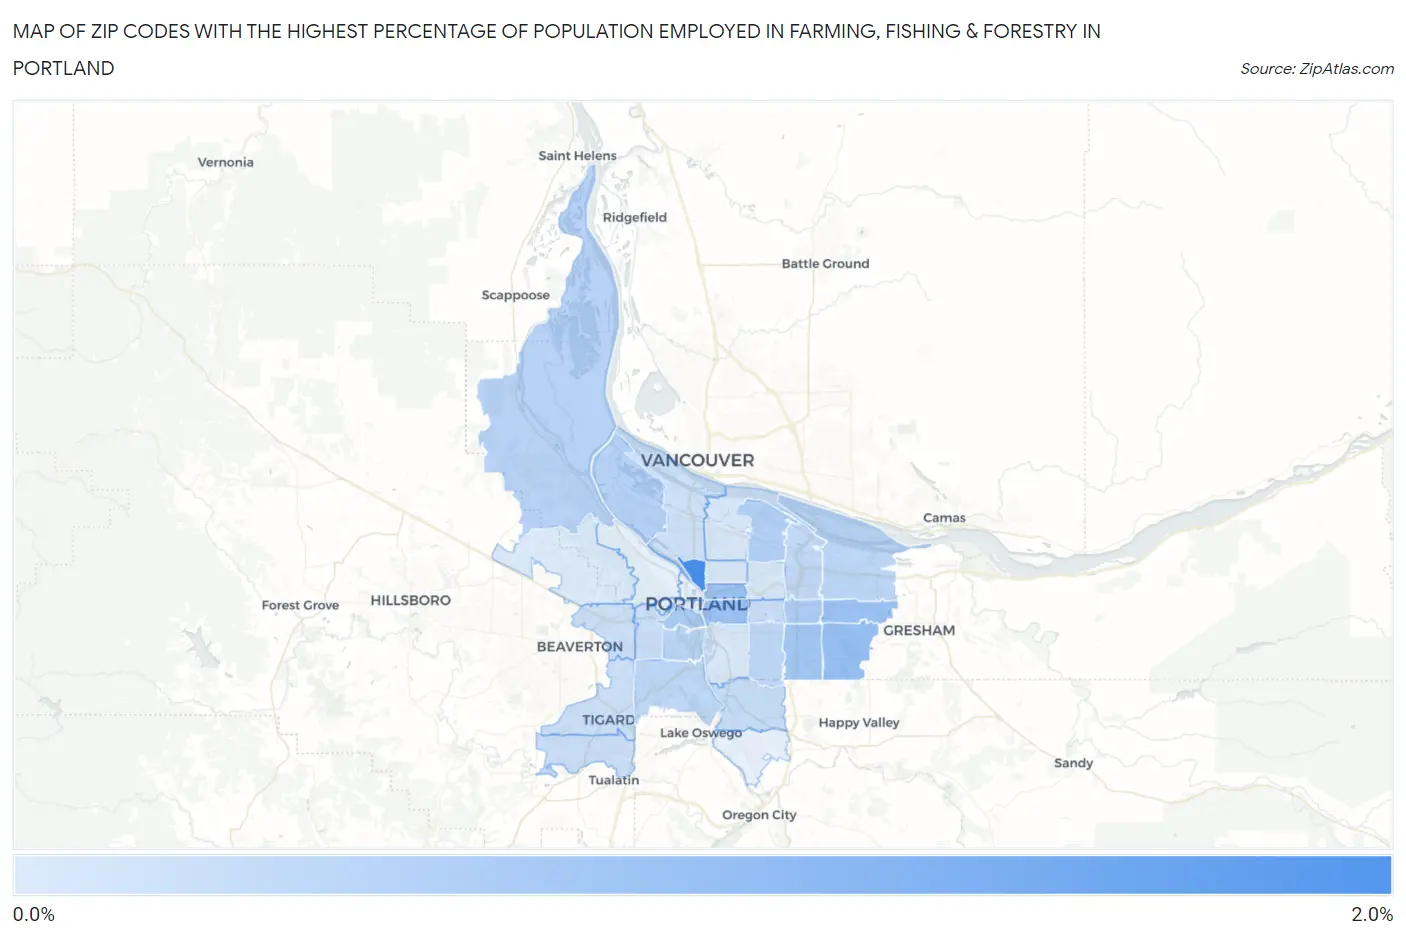
Zip Codes with the Highest Percentage of Population Employed in Farming, Fishing & Forestry in Portland, OR
RELATED REPORTS & OPTIONS
Farming, Fishing & Forestry
Portland
Compare Zip Codes
Map of Zip Codes with the Highest Percentage of Population Employed in Farming, Fishing & Forestry in Portland
0.0026%
1.5%
Zip Codes with the Highest Percentage of Population Employed in Farming, Fishing & Forestry in Portland, OR
| Zip Code | % Employed | vs State | vs National | |
| 1. | 97227 | 1.5% | 1.4%(+0.101)#195 | 0.61%(+0.903)#7,856 |
| 2. | 97236 | 0.69% | 1.4%(-0.715)#242 | 0.61%(+0.086)#11,427 |
| 3. | 97232 | 0.68% | 1.4%(-0.731)#246 | 0.61%(+0.071)#11,542 |
| 4. | 97214 | 0.67% | 1.4%(-0.742)#247 | 0.61%(+0.060)#11,613 |
| 5. | 97233 | 0.66% | 1.4%(-0.748)#251 | 0.61%(+0.054)#11,645 |
| 6. | 97266 | 0.57% | 1.4%(-0.834)#256 | 0.61%(-0.032)#12,260 |
| 7. | 97201 | 0.52% | 1.4%(-0.888)#266 | 0.61%(-0.086)#12,683 |
| 8. | 97216 | 0.48% | 1.4%(-0.925)#269 | 0.61%(-0.123)#13,002 |
| 9. | 97218 | 0.41% | 1.4%(-0.995)#278 | 0.61%(-0.193)#13,654 |
| 10. | 97203 | 0.39% | 1.4%(-1.02)#282 | 0.61%(-0.214)#13,832 |
| 11. | 97231 | 0.37% | 1.4%(-1.04)#285 | 0.61%(-0.236)#14,047 |
| 12. | 97239 | 0.36% | 1.4%(-1.05)#286 | 0.61%(-0.249)#14,187 |
| 13. | 97230 | 0.34% | 1.4%(-1.07)#288 | 0.61%(-0.270)#14,421 |
| 14. | 97219 | 0.30% | 1.4%(-1.11)#293 | 0.61%(-0.307)#14,858 |
| 15. | 97206 | 0.29% | 1.4%(-1.11)#294 | 0.61%(-0.311)#14,901 |
| 16. | 97220 | 0.28% | 1.4%(-1.13)#295 | 0.61%(-0.323)#15,041 |
| 17. | 97222 | 0.24% | 1.4%(-1.17)#299 | 0.61%(-0.367)#15,565 |
| 18. | 97215 | 0.18% | 1.4%(-1.22)#303 | 0.61%(-0.421)#16,363 |
| 19. | 97224 | 0.18% | 1.4%(-1.23)#304 | 0.61%(-0.426)#16,424 |
| 20. | 97221 | 0.18% | 1.4%(-1.23)#305 | 0.61%(-0.427)#16,444 |
| 21. | 97223 | 0.17% | 1.4%(-1.24)#306 | 0.61%(-0.435)#16,565 |
| 22. | 97225 | 0.17% | 1.4%(-1.24)#307 | 0.61%(-0.436)#16,581 |
| 23. | 97217 | 0.14% | 1.4%(-1.26)#311 | 0.61%(-0.462)#17,026 |
| 24. | 97213 | 0.058% | 1.4%(-1.35)#317 | 0.61%(-0.548)#18,524 |
| 25. | 97202 | 0.052% | 1.4%(-1.36)#318 | 0.61%(-0.554)#18,629 |
| 26. | 97212 | 0.045% | 1.4%(-1.36)#320 | 0.61%(-0.560)#18,731 |
| 27. | 97211 | 0.039% | 1.4%(-1.37)#321 | 0.61%(-0.567)#18,825 |
| 28. | 97229 | 0.0026% | 1.4%(-1.40)#324 | 0.61%(-0.603)#19,216 |
1
Common Questions
What are the Top 10 Zip Codes with the Highest Percentage of Population Employed in Farming, Fishing & Forestry in Portland, OR?
Top 10 Zip Codes with the Highest Percentage of Population Employed in Farming, Fishing & Forestry in Portland, OR are:
What zip code has the Highest Percentage of Population Employed in Farming, Fishing & Forestry in Portland, OR?
97227 has the Highest Percentage of Population Employed in Farming, Fishing & Forestry in Portland, OR with 1.5%.
What is the Percentage of Population Employed in Farming, Fishing & Forestry in Portland, OR?
Percentage of Population Employed in Farming, Fishing & Forestry in Portland is 0.28%.
What is the Percentage of Population Employed in Farming, Fishing & Forestry in Oregon?
Percentage of Population Employed in Farming, Fishing & Forestry in Oregon is 1.4%.
What is the Percentage of Population Employed in Farming, Fishing & Forestry in the United States?
Percentage of Population Employed in Farming, Fishing & Forestry in the United States is 0.61%.