Zip Codes with the Highest Percentage of Population Employed in Education Instruction & Library in Portland, OR

RELATED REPORTS & OPTIONS

Education Instruction & Library
Population
Families and Households
Female Fertility
Female Fertility (Unmarried)
Race (Community Size)
Race (Percentage)
Ancestry (Community Size)
AfghanAfricanAlaska NativeAlaskan AthabascanAlbanianAleutAlsatianAmericanApacheArabArgentineanArmenianAustralianAustrianBahamianBangladeshiBasqueBelgianBelizeanBhutaneseBlackfeetBolivianBrazilianBritishBritish West IndianBulgarianBurmeseCajunCambodianCanadianCelticCentral AmericanCentral American IndianCherokeeCheyenneChickasawChileanChineseChippewaChoctawColombianColvilleCosta RicanCreeCreekCroatianCubanCzechCzechoslovakianDanishDelawareDominicanDutchEastern EuropeanEcuadorianEgyptianEnglishEstonianEthiopianEuropeanFijianFilipinoFinnishFrenchFrench American IndianFrench CanadianGermanGerman RussianGhanaianGreekGuamanian / ChamorroGuatemalanGuyaneseHaitianHonduranHopiHungarianIcelanderIndian (Asian)IndonesianInupiatIranianIraqiIrishIroquoisIsraeliItalianJamaicanJapaneseJordanianKenyanKoreanLaotianLatvianLebaneseLiberianLithuanianLumbeeLuxembourgerMacedonianMalaysianMalteseMarshalleseMexicanMexican American IndianMongolianMoroccanNative HawaiianNavajoNepaleseNew ZealanderNicaraguanNigerianNorthern EuropeanNorwegianOkinawanOsagePaiutePakistaniPalestinianPanamanianParaguayanPennsylvania GermanPeruvianPimaPolishPortuguesePotawatomiPuebloPuerto RicanPuget Sound SalishRomanianRussianSalvadoranSamoanScandinavianScotch-IrishScottishSeminoleSenegaleseSerbianShoshoneSierra LeoneanSiouxSlavicSlovakSloveneSomaliSouth AfricanSouth AmericanSouth American IndianSoviet UnionSpaniardSpanishSpanish AmericanSpanish American IndianSri LankanSubsaharan AfricanSwedishSwissSyrianThaiTlingit-HaidaTonganTrinidadian and TobagonianTsimshianTurkishUgandanUkrainianUruguayanUteVenezuelanVietnameseWelshWest IndianYakamaYaquiYugoslavianYup'ik
Ancestry (Percentage)
AfghanAfricanAlaska NativeAlaskan AthabascanAlbanianAleutAlsatianAmericanApacheArabArgentineanArmenianAustralianAustrianBahamianBangladeshiBasqueBelgianBelizeanBhutaneseBlackfeetBolivianBrazilianBritishBritish West IndianBulgarianBurmeseCajunCambodianCanadianCelticCentral AmericanCentral American IndianCherokeeCheyenneChickasawChileanChineseChippewaChoctawColombianColvilleCosta RicanCreeCreekCroatianCubanCzechCzechoslovakianDanishDelawareDominicanDutchEastern EuropeanEcuadorianEgyptianEnglishEstonianEthiopianEuropeanFijianFilipinoFinnishFrenchFrench American IndianFrench CanadianGermanGerman RussianGhanaianGreekGuamanian / ChamorroGuatemalanGuyaneseHaitianHonduranHopiHungarianIcelanderIndian (Asian)IndonesianInupiatIranianIraqiIrishIroquoisIsraeliItalianJamaicanJapaneseJordanianKenyanKoreanLaotianLatvianLebaneseLiberianLithuanianLumbeeLuxembourgerMacedonianMalaysianMalteseMarshalleseMexicanMexican American IndianMongolianMoroccanNative HawaiianNavajoNepaleseNew ZealanderNicaraguanNigerianNorthern EuropeanNorwegianOkinawanOsagePaiutePakistaniPalestinianPanamanianParaguayanPennsylvania GermanPeruvianPimaPolishPortuguesePotawatomiPuebloPuerto RicanPuget Sound SalishRomanianRussianSalvadoranSamoanScandinavianScotch-IrishScottishSeminoleSenegaleseSerbianShoshoneSierra LeoneanSiouxSlavicSlovakSloveneSomaliSouth AfricanSouth AmericanSouth American IndianSoviet UnionSpaniardSpanishSpanish AmericanSpanish American IndianSri LankanSubsaharan AfricanSwedishSwissSyrianThaiTlingit-HaidaTonganTrinidadian and TobagonianTsimshianTurkishUgandanUkrainianUruguayanUteVenezuelanVietnameseWelshWest IndianYakamaYaquiYugoslavianYup'ik
Immigrant Origin (Total)
AfghanistanAfricaArgentinaArmeniaAsiaAustraliaAustriaBahamasBangladeshBarbadosBelarusBelgiumBelizeBosnia and HerzegovinaBrazilBulgariaBurma / MyanmarCambodiaCameroonCanadaCaribbeanCentral AmericaChileChinaColombiaCongoCosta RicaCroatiaCubaCzechoslovakiaDenmarkDominican RepublicEastern AfricaEastern AsiaEastern EuropeEcuadorEgyptEl SalvadorEnglandEritreaEthiopiaEuropeFijiFranceGermanyGhanaGreeceGuatemalaHaitiHondurasHong KongHungaryIndiaIndonesiaIranIraqIrelandIsraelItalyJamaicaJapanJordanKazakhstanKenyaKoreaKuwaitLaosLatin AmericaLatviaLebanonLiberiaLithuaniaMalaysiaMexicoMicronesiaMiddle AfricaMoldovaMoroccoNepalNetherlandsNicaraguaNigeriaNorth MacedoniaNorthern AfricaNorthern EuropeNorwayOceaniaPakistanPanamaPeruPhilippinesPolandPortugalRomaniaRussiaSaudi ArabiaScotlandSerbiaSingaporeSomaliaSouth AfricaSouth AmericaSouth Central AsiaSouth Eastern AsiaSouthern EuropeSpainSri LankaSudanSwedenSwitzerlandSyriaTaiwanThailandTrinidad and TobagoTurkeyUgandaUkraineUruguayUzbekistanVenezuelaVietnamWestern AfricaWestern AsiaWestern EuropeYemen
Immigrant Origin (Percentage)
AfghanistanAfricaArgentinaArmeniaAsiaAustraliaAustriaBahamasBangladeshBarbadosBelarusBelgiumBelizeBosnia and HerzegovinaBrazilBulgariaBurma / MyanmarCambodiaCameroonCanadaCaribbeanCentral AmericaChileChinaColombiaCongoCosta RicaCroatiaCubaCzechoslovakiaDenmarkDominican RepublicEastern AfricaEastern AsiaEastern EuropeEcuadorEgyptEl SalvadorEnglandEritreaEthiopiaEuropeFijiFranceGermanyGhanaGreeceGuatemalaHaitiHondurasHong KongHungaryIndiaIndonesiaIranIraqIrelandIsraelItalyJamaicaJapanJordanKazakhstanKenyaKoreaKuwaitLaosLatin AmericaLatviaLebanonLiberiaLithuaniaMalaysiaMexicoMicronesiaMiddle AfricaMoldovaMoroccoNepalNetherlandsNicaraguaNigeriaNorth MacedoniaNorthern AfricaNorthern EuropeNorwayOceaniaPakistanPanamaPeruPhilippinesPolandPortugalRomaniaRussiaSaudi ArabiaScotlandSerbiaSingaporeSomaliaSouth AfricaSouth AmericaSouth Central AsiaSouth Eastern AsiaSouthern EuropeSpainSri LankaSudanSwedenSwitzerlandSyriaTaiwanThailandTrinidad and TobagoTurkeyUgandaUkraineUruguayUzbekistanVenezuelaVietnamWestern AfricaWestern AsiaWestern EuropeYemen
Income
Income (Families)
Income (Households)
Poverty
Poverty (Families)
Unemployment
Employment Occupations
Employment Industries
Employer Class
Commute Time
Commute Means
School Enrollment
Education by Degree Field
Occupancy
Finances
Physical Characteristics
Portland
Compare Zip Codes
Comparison Subject

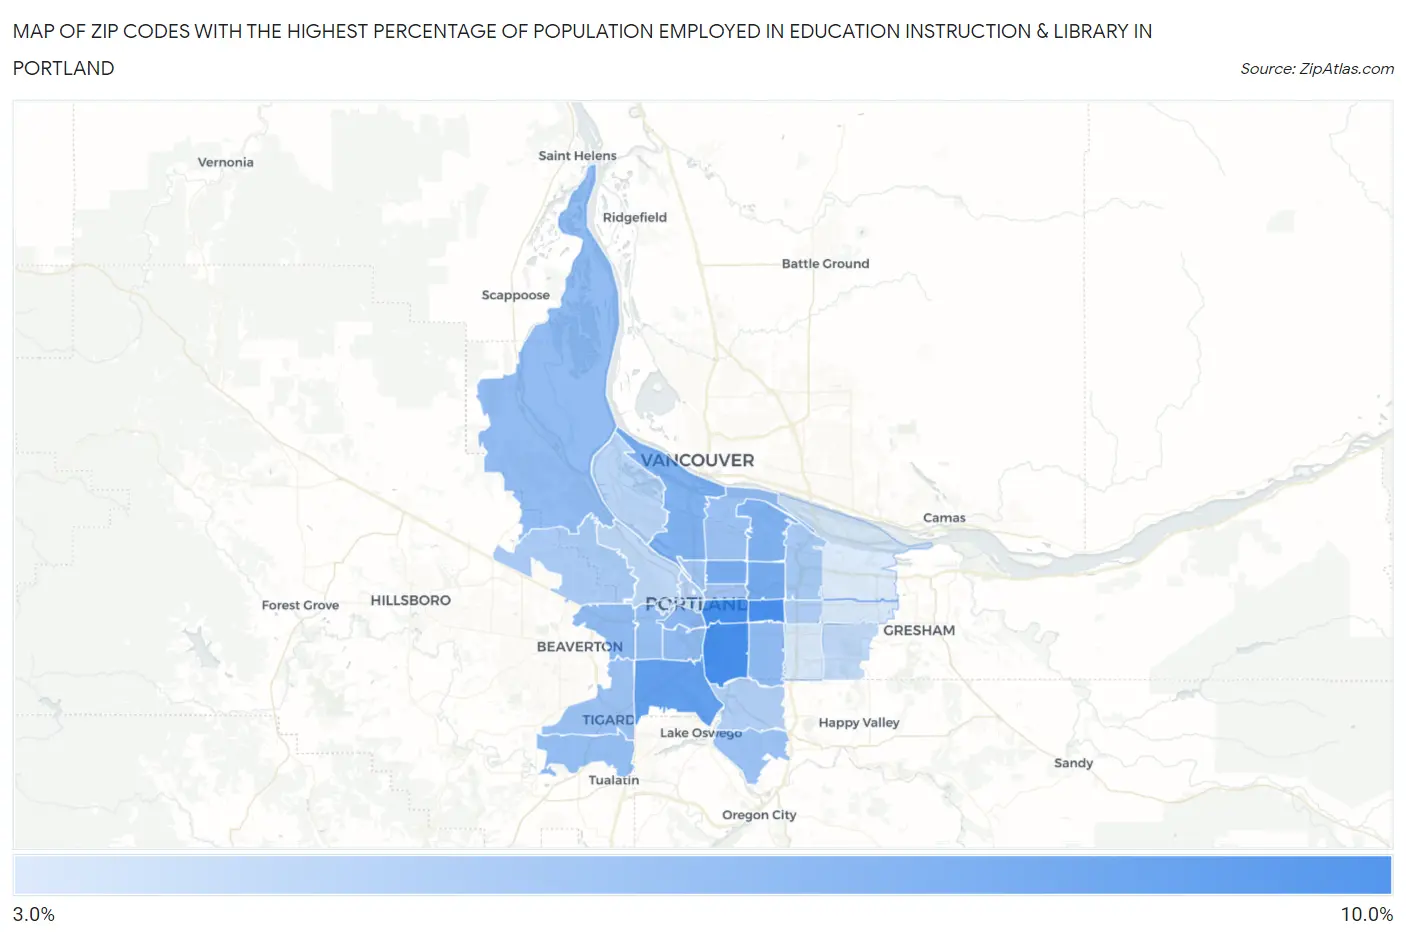
Map of Zip Codes with the Highest Percentage of Population Employed in Education Instruction & Library in Portland

0.0%
10.0%
Zip Codes with the Highest Percentage of Population Employed in Education Instruction & Library in Portland Map

Zip Codes with the Highest Percentage of Population Employed in Education Instruction & Library in Portland, OR

Zip Code % Employed vs State vs National
1.972028.7%5.6%(+3.05)#606.2%(+2.50)#5,762
2.972148.7%5.6%(+3.02)#626.2%(+2.48)#5,807
3.972158.6%5.6%(+2.98)#656.2%(+2.43)#5,895
4.972197.7%5.6%(+2.07)#836.2%(+1.52)#7,881
5.972137.0%5.6%(+1.33)#1076.2%(+0.780)#10,043
6.972126.9%5.6%(+1.23)#1096.2%(+0.679)#10,336
7.972176.6%5.6%(+0.958)#1186.2%(+0.412)#11,272
8.972186.6%5.6%(+0.935)#1196.2%(+0.389)#11,356
9.972016.2%5.6%(+0.571)#1316.2%(+0.025)#12,730
10.972256.1%5.6%(+0.423)#1336.2%(-0.124)#13,279
11.972066.0%5.6%(+0.407)#1346.2%(-0.139)#13,324
12.972396.0%5.6%(+0.388)#1366.2%(-0.158)#13,390
13.972316.0%5.6%(+0.335)#1406.2%(-0.211)#13,609
14.972245.9%5.6%(+0.240)#1446.2%(-0.306)#13,991
15.972215.8%5.6%(+0.163)#1476.2%(-0.383)#14,308
16.972675.7%5.6%(+0.033)#1576.2%(-0.513)#14,875
17.972235.6%5.6%(+0.004)#1596.2%(-0.542)#14,991
18.972115.6%5.6%(-0.003)#1616.2%(-0.549)#15,016
19.972325.5%5.6%(-0.163)#1706.2%(-0.709)#15,652
20.972275.4%5.6%(-0.200)#1726.2%(-0.746)#15,819
21.972205.2%5.6%(-0.433)#1846.2%(-0.980)#16,768
22.972295.2%5.6%(-0.487)#1866.2%(-1.03)#16,978
23.972165.0%5.6%(-0.684)#1966.2%(-1.23)#17,852
24.972224.9%5.6%(-0.773)#1996.2%(-1.32)#18,220
25.972094.8%5.6%(-0.814)#2006.2%(-1.36)#18,393
26.972034.6%5.6%(-1.08)#2156.2%(-1.62)#19,471
27.972104.4%5.6%(-1.26)#2306.2%(-1.81)#20,229
28.972364.4%5.6%(-1.27)#2316.2%(-1.81)#20,254
29.972044.1%5.6%(-1.55)#2426.2%(-2.10)#21,344
30.972053.8%5.6%(-1.87)#2576.2%(-2.42)#22,500
31.972333.5%5.6%(-2.12)#2646.2%(-2.66)#23,303
32.972663.5%5.6%(-2.13)#2676.2%(-2.68)#23,351
33.972303.4%5.6%(-2.27)#2766.2%(-2.81)#23,762

Common Questions

What are the Top 10 Zip Codes with the Highest Percentage of Population Employed in Education Instruction & Library in Portland, OR?
Top 10 Zip Codes with the Highest Percentage of Population Employed in Education Instruction & Library in Portland, OR are:
#1
8.7%
#2
8.7%
#3
8.6%
#4
7.7%
#5
7.0%
#6
6.9%
#7
6.6%
#8
6.6%
#9
6.2%
#10
6.1%
What zip code has the Highest Percentage of Population Employed in Education Instruction & Library in Portland, OR?
97202 has the Highest Percentage of Population Employed in Education Instruction & Library in Portland, OR with 8.7%.
What is the Percentage of Population Employed in Education Instruction & Library in Portland, OR?
Percentage of Population Employed in Education Instruction & Library in Portland is 6.0%.
What is the Percentage of Population Employed in Education Instruction & Library in Oregon?
Percentage of Population Employed in Education Instruction & Library in Oregon is 5.6%.
What is the Percentage of Population Employed in Education Instruction & Library in the United States?
Percentage of Population Employed in Education Instruction & Library in the United States is 6.2%.