Zip Codes with the Highest Percentage of Households with Income Above $100,000 in Portland, OR

RELATED REPORTS & OPTIONS

Household Income | $100k+
Population
Families and Households
Female Fertility
Female Fertility (Unmarried)
Race (Community Size)
Race (Percentage)
Ancestry (Community Size)
AfghanAfricanAlaska NativeAlaskan AthabascanAlbanianAleutAlsatianAmericanApacheArabArgentineanArmenianAustralianAustrianBahamianBangladeshiBasqueBelgianBelizeanBhutaneseBlackfeetBolivianBrazilianBritishBritish West IndianBulgarianBurmeseCajunCambodianCanadianCelticCentral AmericanCentral American IndianCherokeeCheyenneChickasawChileanChineseChippewaChoctawColombianColvilleCosta RicanCreeCreekCroatianCubanCzechCzechoslovakianDanishDelawareDominicanDutchEastern EuropeanEcuadorianEgyptianEnglishEstonianEthiopianEuropeanFijianFilipinoFinnishFrenchFrench American IndianFrench CanadianGermanGerman RussianGhanaianGreekGuamanian / ChamorroGuatemalanGuyaneseHaitianHonduranHopiHungarianIcelanderIndian (Asian)IndonesianInupiatIranianIraqiIrishIroquoisIsraeliItalianJamaicanJapaneseJordanianKenyanKoreanLaotianLatvianLebaneseLiberianLithuanianLumbeeLuxembourgerMacedonianMalaysianMalteseMarshalleseMexicanMexican American IndianMongolianMoroccanNative HawaiianNavajoNepaleseNew ZealanderNicaraguanNigerianNorthern EuropeanNorwegianOkinawanOsagePaiutePakistaniPalestinianPanamanianParaguayanPennsylvania GermanPeruvianPimaPolishPortuguesePotawatomiPuebloPuerto RicanPuget Sound SalishRomanianRussianSalvadoranSamoanScandinavianScotch-IrishScottishSeminoleSenegaleseSerbianShoshoneSierra LeoneanSiouxSlavicSlovakSloveneSomaliSouth AfricanSouth AmericanSouth American IndianSoviet UnionSpaniardSpanishSpanish AmericanSpanish American IndianSri LankanSubsaharan AfricanSwedishSwissSyrianThaiTlingit-HaidaTonganTrinidadian and TobagonianTsimshianTurkishUgandanUkrainianUruguayanUteVenezuelanVietnameseWelshWest IndianYakamaYaquiYugoslavianYup'ik
Ancestry (Percentage)
AfghanAfricanAlaska NativeAlaskan AthabascanAlbanianAleutAlsatianAmericanApacheArabArgentineanArmenianAustralianAustrianBahamianBangladeshiBasqueBelgianBelizeanBhutaneseBlackfeetBolivianBrazilianBritishBritish West IndianBulgarianBurmeseCajunCambodianCanadianCelticCentral AmericanCentral American IndianCherokeeCheyenneChickasawChileanChineseChippewaChoctawColombianColvilleCosta RicanCreeCreekCroatianCubanCzechCzechoslovakianDanishDelawareDominicanDutchEastern EuropeanEcuadorianEgyptianEnglishEstonianEthiopianEuropeanFijianFilipinoFinnishFrenchFrench American IndianFrench CanadianGermanGerman RussianGhanaianGreekGuamanian / ChamorroGuatemalanGuyaneseHaitianHonduranHopiHungarianIcelanderIndian (Asian)IndonesianInupiatIranianIraqiIrishIroquoisIsraeliItalianJamaicanJapaneseJordanianKenyanKoreanLaotianLatvianLebaneseLiberianLithuanianLumbeeLuxembourgerMacedonianMalaysianMalteseMarshalleseMexicanMexican American IndianMongolianMoroccanNative HawaiianNavajoNepaleseNew ZealanderNicaraguanNigerianNorthern EuropeanNorwegianOkinawanOsagePaiutePakistaniPalestinianPanamanianParaguayanPennsylvania GermanPeruvianPimaPolishPortuguesePotawatomiPuebloPuerto RicanPuget Sound SalishRomanianRussianSalvadoranSamoanScandinavianScotch-IrishScottishSeminoleSenegaleseSerbianShoshoneSierra LeoneanSiouxSlavicSlovakSloveneSomaliSouth AfricanSouth AmericanSouth American IndianSoviet UnionSpaniardSpanishSpanish AmericanSpanish American IndianSri LankanSubsaharan AfricanSwedishSwissSyrianThaiTlingit-HaidaTonganTrinidadian and TobagonianTsimshianTurkishUgandanUkrainianUruguayanUteVenezuelanVietnameseWelshWest IndianYakamaYaquiYugoslavianYup'ik
Immigrant Origin (Total)
AfghanistanAfricaArgentinaArmeniaAsiaAustraliaAustriaBahamasBangladeshBarbadosBelarusBelgiumBelizeBosnia and HerzegovinaBrazilBulgariaBurma / MyanmarCambodiaCameroonCanadaCaribbeanCentral AmericaChileChinaColombiaCongoCosta RicaCroatiaCubaCzechoslovakiaDenmarkDominican RepublicEastern AfricaEastern AsiaEastern EuropeEcuadorEgyptEl SalvadorEnglandEritreaEthiopiaEuropeFijiFranceGermanyGhanaGreeceGuatemalaHaitiHondurasHong KongHungaryIndiaIndonesiaIranIraqIrelandIsraelItalyJamaicaJapanJordanKazakhstanKenyaKoreaKuwaitLaosLatin AmericaLatviaLebanonLiberiaLithuaniaMalaysiaMexicoMicronesiaMiddle AfricaMoldovaMoroccoNepalNetherlandsNicaraguaNigeriaNorth MacedoniaNorthern AfricaNorthern EuropeNorwayOceaniaPakistanPanamaPeruPhilippinesPolandPortugalRomaniaRussiaSaudi ArabiaScotlandSerbiaSingaporeSomaliaSouth AfricaSouth AmericaSouth Central AsiaSouth Eastern AsiaSouthern EuropeSpainSri LankaSudanSwedenSwitzerlandSyriaTaiwanThailandTrinidad and TobagoTurkeyUgandaUkraineUruguayUzbekistanVenezuelaVietnamWestern AfricaWestern AsiaWestern EuropeYemen
Immigrant Origin (Percentage)
AfghanistanAfricaArgentinaArmeniaAsiaAustraliaAustriaBahamasBangladeshBarbadosBelarusBelgiumBelizeBosnia and HerzegovinaBrazilBulgariaBurma / MyanmarCambodiaCameroonCanadaCaribbeanCentral AmericaChileChinaColombiaCongoCosta RicaCroatiaCubaCzechoslovakiaDenmarkDominican RepublicEastern AfricaEastern AsiaEastern EuropeEcuadorEgyptEl SalvadorEnglandEritreaEthiopiaEuropeFijiFranceGermanyGhanaGreeceGuatemalaHaitiHondurasHong KongHungaryIndiaIndonesiaIranIraqIrelandIsraelItalyJamaicaJapanJordanKazakhstanKenyaKoreaKuwaitLaosLatin AmericaLatviaLebanonLiberiaLithuaniaMalaysiaMexicoMicronesiaMiddle AfricaMoldovaMoroccoNepalNetherlandsNicaraguaNigeriaNorth MacedoniaNorthern AfricaNorthern EuropeNorwayOceaniaPakistanPanamaPeruPhilippinesPolandPortugalRomaniaRussiaSaudi ArabiaScotlandSerbiaSingaporeSomaliaSouth AfricaSouth AmericaSouth Central AsiaSouth Eastern AsiaSouthern EuropeSpainSri LankaSudanSwedenSwitzerlandSyriaTaiwanThailandTrinidad and TobagoTurkeyUgandaUkraineUruguayUzbekistanVenezuelaVietnamWestern AfricaWestern AsiaWestern EuropeYemen
Income
Income (Families)
Income (Households)
Poverty
Poverty (Families)
Unemployment
Employment Occupations
Employment Industries
Employer Class
Commute Time
Commute Means
School Enrollment
Education by Degree Field
Occupancy
Finances
Physical Characteristics
Portland
Compare Zip Codes
Comparison Subject

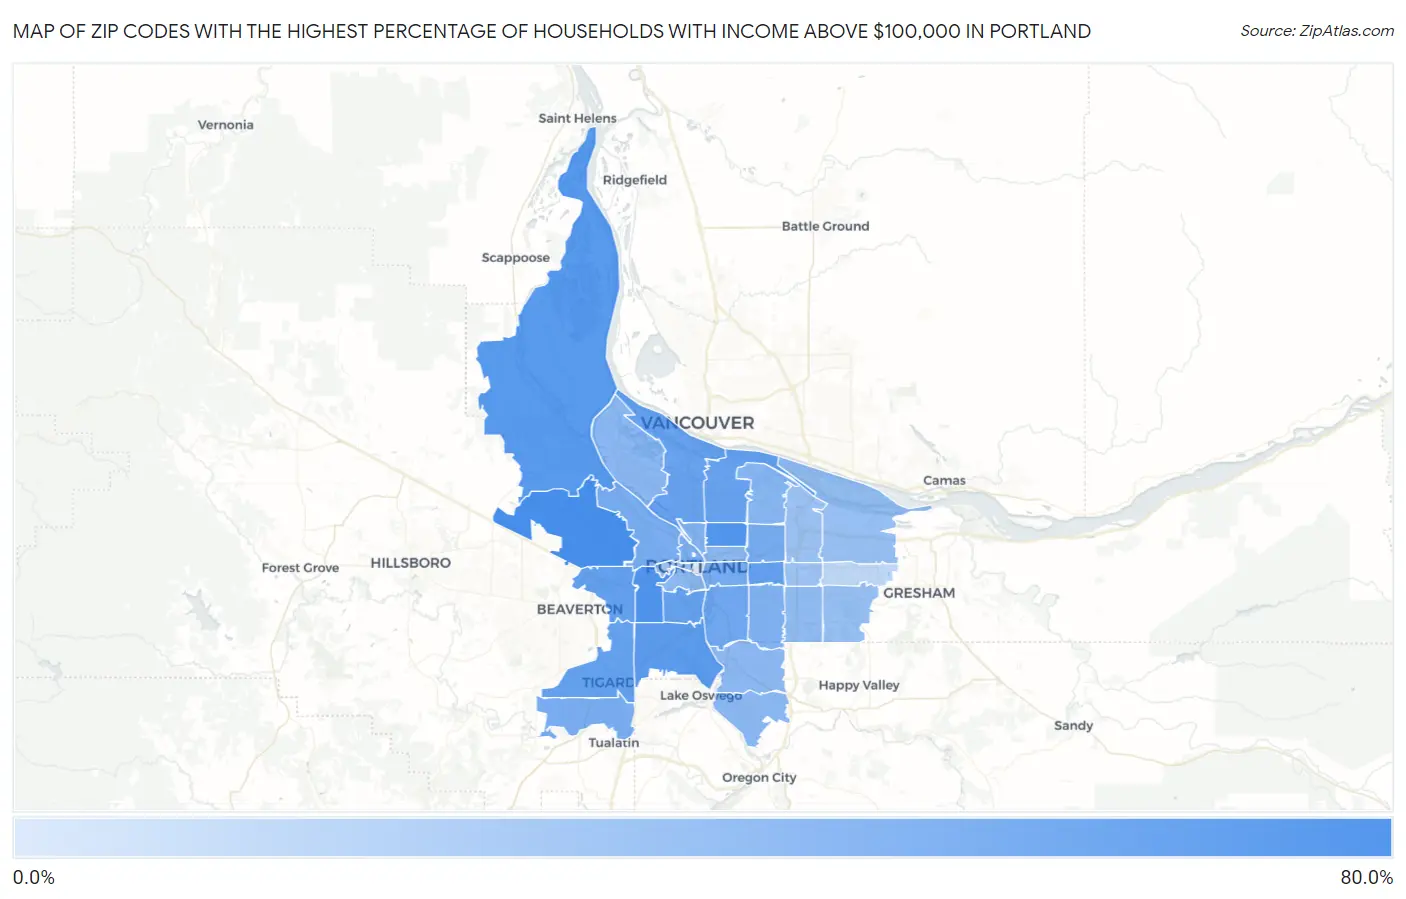
Map of Zip Codes with the Highest Percentage of Households with Income Above $100,000 in Portland

0.0%
80.0%
Zip Codes with the Highest Percentage of Households with Income Above $100,000 in Portland Map

Zip Codes with the Highest Percentage of Households with Income Above $100,000 in Portland, OR

Zip Code Households with Income > $100k vs State vs National
1.9722965.5%37.6%(+27.9)#637.3%(+28.2)#1,458
2.9722161.5%37.6%(+23.9)#1137.3%(+24.2)#2,087
3.9721260.8%37.6%(+23.2)#1337.3%(+23.5)#2,211
4.9723158.6%37.6%(+21.0)#1937.3%(+21.3)#2,647
5.9721957.1%37.6%(+19.5)#2237.3%(+19.8)#2,945
6.9722553.6%37.6%(+16.0)#3737.3%(+16.3)#3,804
7.9721553.2%37.6%(+15.6)#3937.3%(+15.9)#3,925
8.9722352.6%37.6%(+15.0)#4337.3%(+15.3)#4,080
9.9723952.4%37.6%(+14.8)#4537.3%(+15.1)#4,136
10.9721751.2%37.6%(+13.6)#5137.3%(+13.9)#4,473
11.9721151.2%37.6%(+13.6)#5237.3%(+13.9)#4,474
12.9720248.0%37.6%(+10.4)#6237.3%(+10.7)#5,488
13.9721445.2%37.6%(+7.60)#7737.3%(+7.90)#6,537
14.9721345.1%37.6%(+7.50)#7937.3%(+7.80)#6,571
15.9720944.0%37.6%(+6.40)#8437.3%(+6.70)#7,008
16.9721043.8%37.6%(+6.20)#8637.3%(+6.50)#7,084
17.9722443.7%37.6%(+6.10)#8737.3%(+6.40)#7,118
18.9722741.4%37.6%(+3.80)#10637.3%(+4.10)#8,172
19.9720641.2%37.6%(+3.60)#10737.3%(+3.90)#8,277
20.9721838.5%37.6%(+0.900)#13037.3%(+1.20)#9,695
21.9726738.2%37.6%(+0.600)#13437.3%(+0.900)#9,862
22.9720338.0%37.6%(+0.400)#13837.3%(+0.700)#9,979
23.9722237.4%37.6%(-0.200)#14037.3%(+0.100)#10,325
24.9723236.8%37.6%(-0.800)#14437.3%(-0.500)#10,687
25.9720136.6%37.6%(-1.00)#14737.3%(-0.700)#10,818
26.9726635.4%37.6%(-2.20)#15337.3%(-1.90)#11,527
27.9723632.9%37.6%(-4.70)#17937.3%(-4.40)#13,181
28.9723032.5%37.6%(-5.10)#18237.3%(-4.80)#13,447
29.9722032.3%37.6%(-5.30)#18637.3%(-5.00)#13,615
30.9720531.5%37.6%(-6.10)#20137.3%(-5.80)#14,251
31.9721629.9%37.6%(-7.70)#22137.3%(-7.40)#15,519
32.9723319.1%37.6%(-18.5)#33137.3%(-18.2)#24,744
33.972049.9%37.6%(-27.7)#38337.3%(-27.4)#29,871

Common Questions

What are the Top 10 Zip Codes with the Highest Percentage of Households with Income Above $100,000 in Portland, OR?
Top 10 Zip Codes with the Highest Percentage of Households with Income Above $100,000 in Portland, OR are:
#1
65.5%
#2
61.5%
#3
60.8%
#4
58.6%
#5
57.1%
#6
53.6%
#7
53.2%
#8
52.6%
#9
52.4%
#10
51.2%
What zip code has the Highest Percentage of Households with Income Above $100,000 in Portland, OR?
97229 has the Highest Percentage of Households with Income Above $100,000 in Portland, OR with 65.5%.
What is the Percentage of Households with Income Above $100,000 in Portland, OR?
Percentage of Households with Income Above $100,000 in Portland is 43.5%.
What is the Percentage of Households with Income Above $100,000 in Oregon?
Percentage of Households with Income Above $100,000 in Oregon is 37.6%.
What is the Percentage of Households with Income Above $100,000 in the United States?
Percentage of Households with Income Above $100,000 in the United States is 37.3%.