Zip Codes with the Highest Percentage of Population Employed in Security & Protection in Portland, OR
RELATED REPORTS & OPTIONS
Security & Protection
Portland
Compare Zip Codes
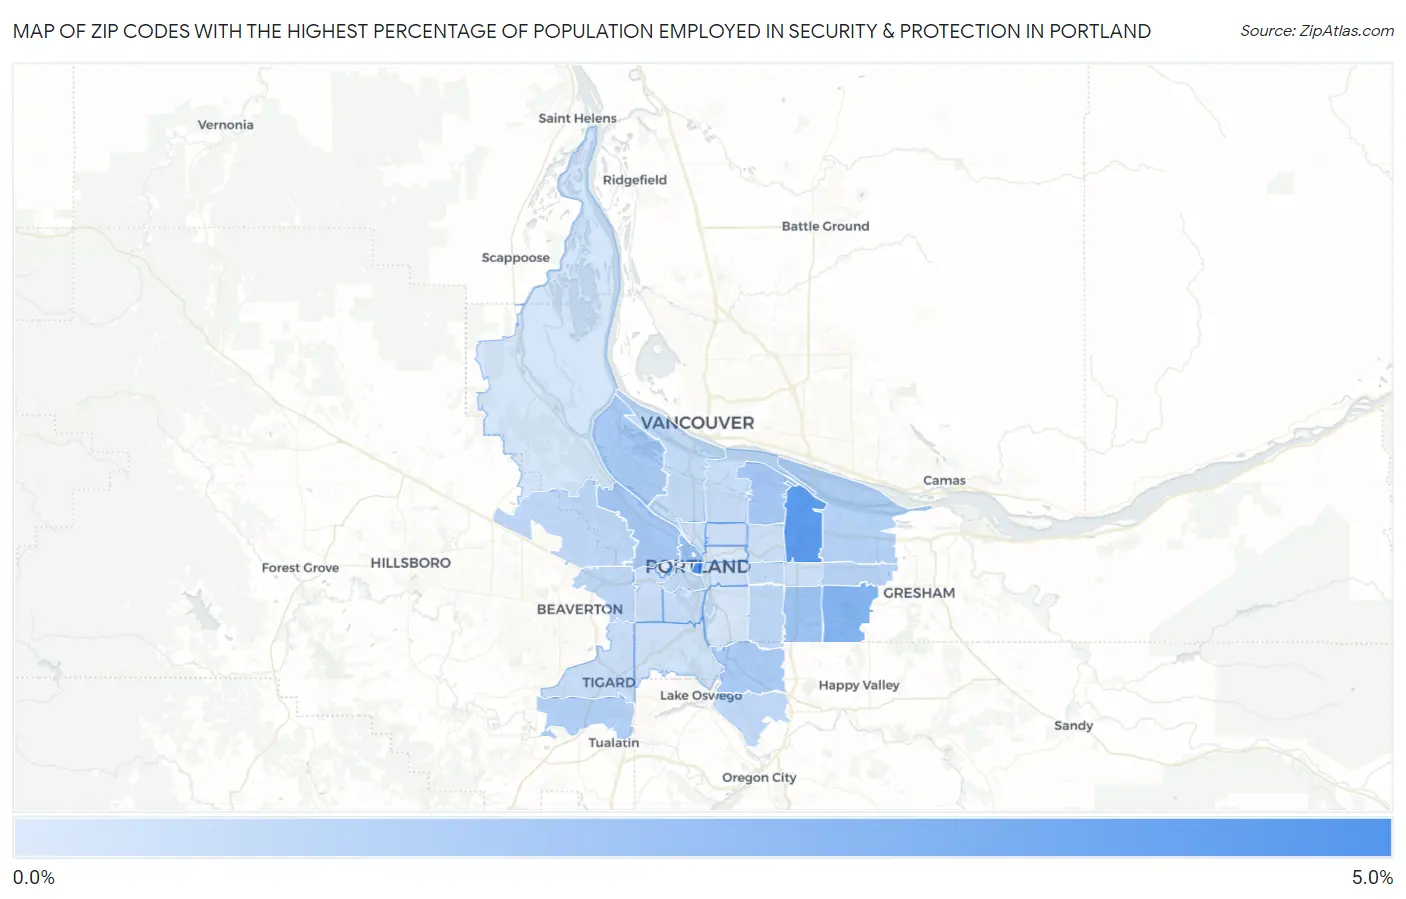
Map of Zip Codes with the Highest Percentage of Population Employed in Security & Protection in Portland
0.25%
4.1%
Zip Codes with the Highest Percentage of Population Employed in Security & Protection in Portland, OR
| Zip Code | % Employed | vs State | vs National | |
| 1. | 97204 | 4.1% | 1.7%(+2.43)#52 | 2.1%(+1.94)#4,328 |
| 2. | 97220 | 3.6% | 1.7%(+1.93)#61 | 2.1%(+1.43)#5,449 |
| 3. | 97236 | 2.5% | 1.7%(+0.820)#100 | 2.1%(+0.325)#9,654 |
| 4. | 97209 | 2.0% | 1.7%(+0.382)#131 | 2.1%(-0.112)#12,338 |
| 5. | 97266 | 1.9% | 1.7%(+0.199)#147 | 2.1%(-0.295)#13,528 |
| 6. | 97210 | 1.6% | 1.7%(-0.016)#171 | 2.1%(-0.510)#15,127 |
| 7. | 97218 | 1.6% | 1.7%(-0.028)#172 | 2.1%(-0.523)#15,216 |
| 8. | 97203 | 1.6% | 1.7%(-0.052)#177 | 2.1%(-0.546)#15,399 |
| 9. | 97222 | 1.5% | 1.7%(-0.117)#186 | 2.1%(-0.611)#15,899 |
| 10. | 97224 | 1.3% | 1.7%(-0.366)#208 | 2.1%(-0.861)#17,841 |
| 11. | 97230 | 1.2% | 1.7%(-0.441)#211 | 2.1%(-0.935)#18,401 |
| 12. | 97233 | 1.2% | 1.7%(-0.492)#214 | 2.1%(-0.986)#18,798 |
| 13. | 97229 | 1.0% | 1.7%(-0.624)#225 | 2.1%(-1.12)#19,807 |
| 14. | 97225 | 1.0% | 1.7%(-0.651)#229 | 2.1%(-1.15)#20,013 |
| 15. | 97206 | 0.99% | 1.7%(-0.665)#231 | 2.1%(-1.16)#20,137 |
| 16. | 97201 | 0.98% | 1.7%(-0.678)#233 | 2.1%(-1.17)#20,237 |
| 17. | 97267 | 0.94% | 1.7%(-0.715)#236 | 2.1%(-1.21)#20,507 |
| 18. | 97217 | 0.90% | 1.7%(-0.754)#239 | 2.1%(-1.25)#20,784 |
| 19. | 97215 | 0.87% | 1.7%(-0.781)#242 | 2.1%(-1.28)#20,949 |
| 20. | 97211 | 0.80% | 1.7%(-0.850)#247 | 2.1%(-1.34)#21,381 |
| 21. | 97239 | 0.80% | 1.7%(-0.852)#248 | 2.1%(-1.35)#21,391 |
| 22. | 97221 | 0.74% | 1.7%(-0.911)#254 | 2.1%(-1.40)#21,778 |
| 23. | 97223 | 0.74% | 1.7%(-0.917)#257 | 2.1%(-1.41)#21,822 |
| 24. | 97227 | 0.68% | 1.7%(-0.975)#260 | 2.1%(-1.47)#22,216 |
| 25. | 97212 | 0.61% | 1.7%(-1.04)#266 | 2.1%(-1.54)#22,598 |
| 26. | 97216 | 0.61% | 1.7%(-1.05)#269 | 2.1%(-1.54)#22,633 |
| 27. | 97213 | 0.58% | 1.7%(-1.07)#271 | 2.1%(-1.57)#22,781 |
| 28. | 97219 | 0.56% | 1.7%(-1.09)#274 | 2.1%(-1.59)#22,894 |
| 29. | 97214 | 0.52% | 1.7%(-1.14)#277 | 2.1%(-1.63)#23,147 |
| 30. | 97231 | 0.42% | 1.7%(-1.23)#281 | 2.1%(-1.73)#23,622 |
| 31. | 97202 | 0.41% | 1.7%(-1.24)#282 | 2.1%(-1.73)#23,659 |
| 32. | 97232 | 0.25% | 1.7%(-1.40)#285 | 2.1%(-1.89)#24,349 |
1
Common Questions
What are the Top 10 Zip Codes with the Highest Percentage of Population Employed in Security & Protection in Portland, OR?
Top 10 Zip Codes with the Highest Percentage of Population Employed in Security & Protection in Portland, OR are:
What zip code has the Highest Percentage of Population Employed in Security & Protection in Portland, OR?
97204 has the Highest Percentage of Population Employed in Security & Protection in Portland, OR with 4.1%.
What is the Percentage of Population Employed in Security & Protection in Portland, OR?
Percentage of Population Employed in Security & Protection in Portland is 1.1%.
What is the Percentage of Population Employed in Security & Protection in Oregon?
Percentage of Population Employed in Security & Protection in Oregon is 1.7%.
What is the Percentage of Population Employed in Security & Protection in the United States?
Percentage of Population Employed in Security & Protection in the United States is 2.1%.