Zip Codes with the Highest Percentage of Households Without a Vehicle in Portland, OR
RELATED REPORTS & OPTIONS
Households without a Cars
Portland
Compare Zip Codes
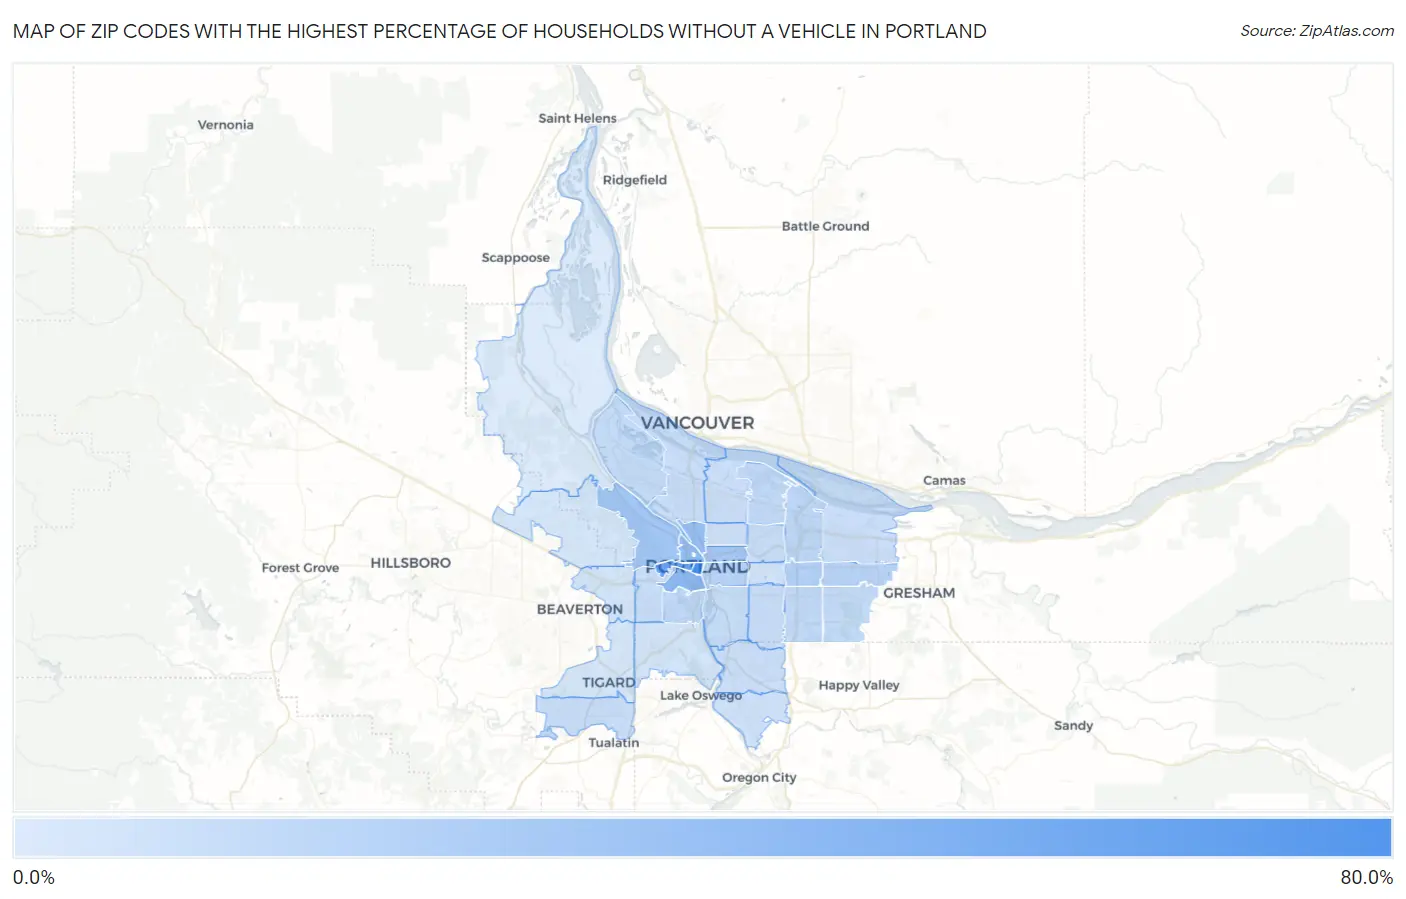
Map of Zip Codes with the Highest Percentage of Households Without a Vehicle in Portland
1.4%
70.0%
Zip Codes with the Highest Percentage of Households Without a Vehicle in Portland, OR
| Zip Code | Housholds Without a Car | vs State | vs National | |
| 1. | 97204 | 70.0% | 7.0%(+63.0)#1 | 8.3%(+61.7)#192 |
| 2. | 97205 | 52.1% | 7.0%(+45.1)#2 | 8.3%(+43.8)#330 |
| 3. | 97201 | 33.8% | 7.0%(+26.8)#6 | 8.3%(+25.5)#662 |
| 4. | 97209 | 30.5% | 7.0%(+23.5)#8 | 8.3%(+22.2)#779 |
| 5. | 97227 | 28.2% | 7.0%(+21.2)#10 | 8.3%(+19.9)#887 |
| 6. | 97210 | 23.3% | 7.0%(+16.3)#11 | 8.3%(+15.0)#1,188 |
| 7. | 97232 | 22.9% | 7.0%(+15.9)#12 | 8.3%(+14.6)#1,224 |
| 8. | 97216 | 17.3% | 7.0%(+10.3)#13 | 8.3%(+9.00)#1,898 |
| 9. | 97233 | 15.6% | 7.0%(+8.60)#18 | 8.3%(+7.30)#2,232 |
| 10. | 97214 | 15.5% | 7.0%(+8.50)#19 | 8.3%(+7.20)#2,253 |
| 11. | 97220 | 13.1% | 7.0%(+6.10)#24 | 8.3%(+4.80)#3,050 |
| 12. | 97239 | 12.4% | 7.0%(+5.40)#27 | 8.3%(+4.10)#3,367 |
| 13. | 97218 | 11.5% | 7.0%(+4.50)#33 | 8.3%(+3.20)#3,831 |
| 14. | 97266 | 11.2% | 7.0%(+4.20)#34 | 8.3%(+2.90)#4,006 |
| 15. | 97236 | 10.5% | 7.0%(+3.50)#42 | 8.3%(+2.20)#4,448 |
| 16. | 97203 | 10.5% | 7.0%(+3.50)#43 | 8.3%(+2.20)#4,456 |
| 17. | 97202 | 9.9% | 7.0%(+2.90)#46 | 8.3%(+1.60)#4,928 |
| 18. | 97217 | 9.1% | 7.0%(+2.10)#54 | 8.3%(+0.800)#5,620 |
| 19. | 97213 | 9.1% | 7.0%(+2.10)#55 | 8.3%(+0.800)#5,622 |
| 20. | 97206 | 8.6% | 7.0%(+1.60)#63 | 8.3%(+0.300)#6,162 |
| 21. | 97221 | 8.6% | 7.0%(+1.60)#64 | 8.3%(+0.300)#6,213 |
| 22. | 97224 | 8.5% | 7.0%(+1.50)#65 | 8.3%(+0.200)#6,309 |
| 23. | 97222 | 8.1% | 7.0%(+1.10)#70 | 8.3%(-0.200)#6,787 |
| 24. | 97211 | 8.0% | 7.0%(+1.000)#73 | 8.3%(-0.300)#6,912 |
| 25. | 97230 | 7.9% | 7.0%(+0.900)#74 | 8.3%(-0.400)#7,069 |
| 26. | 97212 | 7.2% | 7.0%(+0.200)#86 | 8.3%(-1.10)#8,206 |
| 27. | 97267 | 6.2% | 7.0%(-0.800)#113 | 8.3%(-2.10)#9,994 |
| 28. | 97215 | 5.9% | 7.0%(-1.10)#125 | 8.3%(-2.40)#10,718 |
| 29. | 97225 | 5.0% | 7.0%(-2.00)#152 | 8.3%(-3.30)#12,861 |
| 30. | 97219 | 4.5% | 7.0%(-2.50)#172 | 8.3%(-3.80)#14,178 |
| 31. | 97229 | 3.5% | 7.0%(-3.50)#208 | 8.3%(-4.80)#17,279 |
| 32. | 97223 | 3.5% | 7.0%(-3.50)#209 | 8.3%(-4.80)#17,295 |
| 33. | 97231 | 1.4% | 7.0%(-5.60)#289 | 8.3%(-6.90)#24,531 |
1
Common Questions
What are the Top 10 Zip Codes with the Highest Percentage of Households Without a Vehicle in Portland, OR?
Top 10 Zip Codes with the Highest Percentage of Households Without a Vehicle in Portland, OR are:
What zip code has the Highest Percentage of Households Without a Vehicle in Portland, OR?
97204 has the Highest Percentage of Households Without a Vehicle in Portland, OR with 70.0%.
What is the Percentage of Households Without a Vehicle in Portland, OR?
Percentage of Households Without a Vehicle in Portland is 13.5%.
What is the Percentage of Households Without a Vehicle in Oregon?
Percentage of Households Without a Vehicle in Oregon is 7.0%.
What is the Percentage of Households Without a Vehicle in the United States?
Percentage of Households Without a Vehicle in the United States is 8.3%.