Zip Codes with the Highest Percentage of Population Employed in Community & Social Service in Portland, OR

RELATED REPORTS & OPTIONS

Community & Social Service
Population
Families and Households
Female Fertility
Female Fertility (Unmarried)
Race (Community Size)
Race (Percentage)
Ancestry (Community Size)
AfghanAfricanAlaska NativeAlaskan AthabascanAlbanianAleutAlsatianAmericanApacheArabArgentineanArmenianAustralianAustrianBahamianBangladeshiBasqueBelgianBelizeanBhutaneseBlackfeetBolivianBrazilianBritishBritish West IndianBulgarianBurmeseCajunCambodianCanadianCelticCentral AmericanCentral American IndianCherokeeCheyenneChickasawChileanChineseChippewaChoctawColombianColvilleCosta RicanCreeCreekCroatianCubanCzechCzechoslovakianDanishDelawareDominicanDutchEastern EuropeanEcuadorianEgyptianEnglishEstonianEthiopianEuropeanFijianFilipinoFinnishFrenchFrench American IndianFrench CanadianGermanGerman RussianGhanaianGreekGuamanian / ChamorroGuatemalanGuyaneseHaitianHonduranHopiHungarianIcelanderIndian (Asian)IndonesianInupiatIranianIraqiIrishIroquoisIsraeliItalianJamaicanJapaneseJordanianKenyanKoreanLaotianLatvianLebaneseLiberianLithuanianLumbeeLuxembourgerMacedonianMalaysianMalteseMarshalleseMexicanMexican American IndianMongolianMoroccanNative HawaiianNavajoNepaleseNew ZealanderNicaraguanNigerianNorthern EuropeanNorwegianOkinawanOsagePaiutePakistaniPalestinianPanamanianParaguayanPennsylvania GermanPeruvianPimaPolishPortuguesePotawatomiPuebloPuerto RicanPuget Sound SalishRomanianRussianSalvadoranSamoanScandinavianScotch-IrishScottishSeminoleSenegaleseSerbianShoshoneSierra LeoneanSiouxSlavicSlovakSloveneSomaliSouth AfricanSouth AmericanSouth American IndianSoviet UnionSpaniardSpanishSpanish AmericanSpanish American IndianSri LankanSubsaharan AfricanSwedishSwissSyrianThaiTlingit-HaidaTonganTrinidadian and TobagonianTsimshianTurkishUgandanUkrainianUruguayanUteVenezuelanVietnameseWelshWest IndianYakamaYaquiYugoslavianYup'ik
Ancestry (Percentage)
AfghanAfricanAlaska NativeAlaskan AthabascanAlbanianAleutAlsatianAmericanApacheArabArgentineanArmenianAustralianAustrianBahamianBangladeshiBasqueBelgianBelizeanBhutaneseBlackfeetBolivianBrazilianBritishBritish West IndianBulgarianBurmeseCajunCambodianCanadianCelticCentral AmericanCentral American IndianCherokeeCheyenneChickasawChileanChineseChippewaChoctawColombianColvilleCosta RicanCreeCreekCroatianCubanCzechCzechoslovakianDanishDelawareDominicanDutchEastern EuropeanEcuadorianEgyptianEnglishEstonianEthiopianEuropeanFijianFilipinoFinnishFrenchFrench American IndianFrench CanadianGermanGerman RussianGhanaianGreekGuamanian / ChamorroGuatemalanGuyaneseHaitianHonduranHopiHungarianIcelanderIndian (Asian)IndonesianInupiatIranianIraqiIrishIroquoisIsraeliItalianJamaicanJapaneseJordanianKenyanKoreanLaotianLatvianLebaneseLiberianLithuanianLumbeeLuxembourgerMacedonianMalaysianMalteseMarshalleseMexicanMexican American IndianMongolianMoroccanNative HawaiianNavajoNepaleseNew ZealanderNicaraguanNigerianNorthern EuropeanNorwegianOkinawanOsagePaiutePakistaniPalestinianPanamanianParaguayanPennsylvania GermanPeruvianPimaPolishPortuguesePotawatomiPuebloPuerto RicanPuget Sound SalishRomanianRussianSalvadoranSamoanScandinavianScotch-IrishScottishSeminoleSenegaleseSerbianShoshoneSierra LeoneanSiouxSlavicSlovakSloveneSomaliSouth AfricanSouth AmericanSouth American IndianSoviet UnionSpaniardSpanishSpanish AmericanSpanish American IndianSri LankanSubsaharan AfricanSwedishSwissSyrianThaiTlingit-HaidaTonganTrinidadian and TobagonianTsimshianTurkishUgandanUkrainianUruguayanUteVenezuelanVietnameseWelshWest IndianYakamaYaquiYugoslavianYup'ik
Immigrant Origin (Total)
AfghanistanAfricaArgentinaArmeniaAsiaAustraliaAustriaBahamasBangladeshBarbadosBelarusBelgiumBelizeBosnia and HerzegovinaBrazilBulgariaBurma / MyanmarCambodiaCameroonCanadaCaribbeanCentral AmericaChileChinaColombiaCongoCosta RicaCroatiaCubaCzechoslovakiaDenmarkDominican RepublicEastern AfricaEastern AsiaEastern EuropeEcuadorEgyptEl SalvadorEnglandEritreaEthiopiaEuropeFijiFranceGermanyGhanaGreeceGuatemalaHaitiHondurasHong KongHungaryIndiaIndonesiaIranIraqIrelandIsraelItalyJamaicaJapanJordanKazakhstanKenyaKoreaKuwaitLaosLatin AmericaLatviaLebanonLiberiaLithuaniaMalaysiaMexicoMicronesiaMiddle AfricaMoldovaMoroccoNepalNetherlandsNicaraguaNigeriaNorth MacedoniaNorthern AfricaNorthern EuropeNorwayOceaniaPakistanPanamaPeruPhilippinesPolandPortugalRomaniaRussiaSaudi ArabiaScotlandSerbiaSingaporeSomaliaSouth AfricaSouth AmericaSouth Central AsiaSouth Eastern AsiaSouthern EuropeSpainSri LankaSudanSwedenSwitzerlandSyriaTaiwanThailandTrinidad and TobagoTurkeyUgandaUkraineUruguayUzbekistanVenezuelaVietnamWestern AfricaWestern AsiaWestern EuropeYemen
Immigrant Origin (Percentage)
AfghanistanAfricaArgentinaArmeniaAsiaAustraliaAustriaBahamasBangladeshBarbadosBelarusBelgiumBelizeBosnia and HerzegovinaBrazilBulgariaBurma / MyanmarCambodiaCameroonCanadaCaribbeanCentral AmericaChileChinaColombiaCongoCosta RicaCroatiaCubaCzechoslovakiaDenmarkDominican RepublicEastern AfricaEastern AsiaEastern EuropeEcuadorEgyptEl SalvadorEnglandEritreaEthiopiaEuropeFijiFranceGermanyGhanaGreeceGuatemalaHaitiHondurasHong KongHungaryIndiaIndonesiaIranIraqIrelandIsraelItalyJamaicaJapanJordanKazakhstanKenyaKoreaKuwaitLaosLatin AmericaLatviaLebanonLiberiaLithuaniaMalaysiaMexicoMicronesiaMiddle AfricaMoldovaMoroccoNepalNetherlandsNicaraguaNigeriaNorth MacedoniaNorthern AfricaNorthern EuropeNorwayOceaniaPakistanPanamaPeruPhilippinesPolandPortugalRomaniaRussiaSaudi ArabiaScotlandSerbiaSingaporeSomaliaSouth AfricaSouth AmericaSouth Central AsiaSouth Eastern AsiaSouthern EuropeSpainSri LankaSudanSwedenSwitzerlandSyriaTaiwanThailandTrinidad and TobagoTurkeyUgandaUkraineUruguayUzbekistanVenezuelaVietnamWestern AfricaWestern AsiaWestern EuropeYemen
Income
Income (Families)
Income (Households)
Poverty
Poverty (Families)
Unemployment
Employment Occupations
Employment Industries
Employer Class
Commute Time
Commute Means
School Enrollment
Education by Degree Field
Occupancy
Finances
Physical Characteristics
Portland
Compare Zip Codes
Comparison Subject

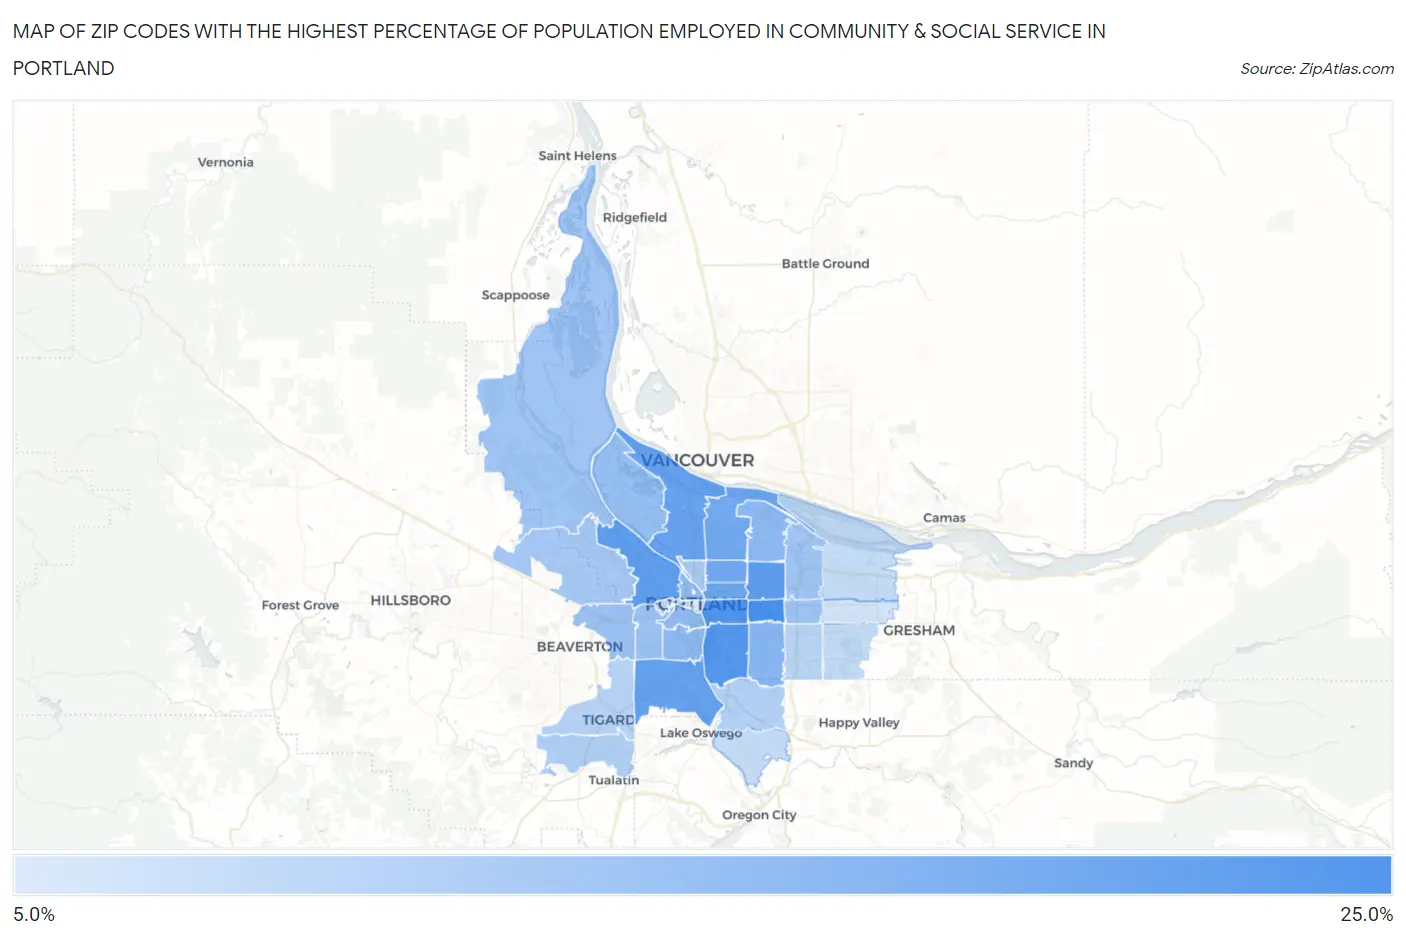
Map of Zip Codes with the Highest Percentage of Population Employed in Community & Social Service in Portland

0.0%
25.0%
Zip Codes with the Highest Percentage of Population Employed in Community & Social Service  in Portland Map

Zip Codes with the Highest Percentage of Population Employed in Community & Social Service in Portland, OR

Zip Code % Employed vs State vs National
1.9721521.8%11.4%(+10.4)#1911.2%(+10.6)#1,518
2.9721421.1%11.4%(+9.70)#2211.2%(+9.87)#1,693
3.9720220.5%11.4%(+9.07)#2611.2%(+9.24)#1,883
4.9721319.4%11.4%(+8.02)#3011.2%(+8.19)#2,233
5.9721019.2%11.4%(+7.83)#3211.2%(+7.99)#2,305
6.9721918.7%11.4%(+7.29)#3511.2%(+7.46)#2,519
7.9721718.5%11.4%(+7.16)#3611.2%(+7.33)#2,580
8.9723217.6%11.4%(+6.26)#3711.2%(+6.42)#3,006
9.9721217.5%11.4%(+6.14)#3911.2%(+6.31)#3,052
10.9721117.2%11.4%(+5.80)#4011.2%(+5.97)#3,261
11.9720615.3%11.4%(+3.90)#5011.2%(+4.06)#4,722
12.9721814.6%11.4%(+3.25)#5711.2%(+3.42)#5,328
13.9720914.6%11.4%(+3.21)#5811.2%(+3.38)#5,373
14.9723914.5%11.4%(+3.08)#5911.2%(+3.24)#5,517
15.9720114.3%11.4%(+2.91)#6211.2%(+3.08)#5,700
16.9720314.0%11.4%(+2.57)#6711.2%(+2.74)#6,152
17.9722113.2%11.4%(+1.80)#7911.2%(+1.96)#7,272
18.9722513.1%11.4%(+1.69)#8211.2%(+1.86)#7,439
19.9721612.9%11.4%(+1.53)#8611.2%(+1.70)#7,699
20.9722012.8%11.4%(+1.38)#8811.2%(+1.55)#7,963
21.9723112.6%11.4%(+1.25)#9311.2%(+1.42)#8,194
22.9722912.4%11.4%(+0.985)#9811.2%(+1.15)#8,659
23.9722712.1%11.4%(+0.704)#10611.2%(+0.872)#9,201
24.9722411.2%11.4%(-0.195)#13311.2%(-0.028)#11,167
25.9722210.9%11.4%(-0.509)#14411.2%(-0.341)#11,961
26.9722310.5%11.4%(-0.909)#15711.2%(-0.742)#12,935
27.9726610.3%11.4%(-1.13)#16211.2%(-0.963)#13,484
28.972059.9%11.4%(-1.47)#17311.2%(-1.30)#14,355
29.972369.5%11.4%(-1.93)#18711.2%(-1.76)#15,557
30.972679.2%11.4%(-2.16)#19211.2%(-2.00)#16,206
31.972309.2%11.4%(-2.18)#19311.2%(-2.01)#16,260
32.972338.0%11.4%(-3.41)#24311.2%(-3.24)#19,642
33.972047.1%11.4%(-4.30)#26711.2%(-4.13)#21,937

Common Questions

What are the Top 10 Zip Codes with the Highest Percentage of Population Employed in Community & Social Service in Portland, OR?
Top 10 Zip Codes with the Highest Percentage of Population Employed in Community & Social Service in Portland, OR are:
#1
21.8%
#2
21.1%
#3
20.5%
#4
19.4%
#5
19.2%
#6
18.7%
#7
18.5%
#8
17.6%
#9
17.5%
#10
17.2%
What zip code has the Highest Percentage of Population Employed in Community & Social Service in Portland, OR?
97215 has the Highest Percentage of Population Employed in Community & Social Service in Portland, OR with 21.8%.
What is the Percentage of Population Employed in Community & Social Service in Portland, OR?
Percentage of Population Employed in Community & Social Service in Portland is 15.7%.
What is the Percentage of Population Employed in Community & Social Service in Oregon?
Percentage of Population Employed in Community & Social Service in Oregon is 11.4%.
What is the Percentage of Population Employed in Community & Social Service in the United States?
Percentage of Population Employed in Community & Social Service in the United States is 11.2%.