Zip Codes with the Highest Percentage of Population Employed in Real Estate, Rental & Leasing in Portland, OR

RELATED REPORTS & OPTIONS

Real Estate, Rental & Leasing
Population
Families and Households
Female Fertility
Female Fertility (Unmarried)
Race (Community Size)
Race (Percentage)
Ancestry (Community Size)
AfghanAfricanAlaska NativeAlaskan AthabascanAlbanianAleutAlsatianAmericanApacheArabArgentineanArmenianAustralianAustrianBahamianBangladeshiBasqueBelgianBelizeanBhutaneseBlackfeetBolivianBrazilianBritishBritish West IndianBulgarianBurmeseCajunCambodianCanadianCelticCentral AmericanCentral American IndianCherokeeCheyenneChickasawChileanChineseChippewaChoctawColombianColvilleCosta RicanCreeCreekCroatianCubanCzechCzechoslovakianDanishDelawareDominicanDutchEastern EuropeanEcuadorianEgyptianEnglishEstonianEthiopianEuropeanFijianFilipinoFinnishFrenchFrench American IndianFrench CanadianGermanGerman RussianGhanaianGreekGuamanian / ChamorroGuatemalanGuyaneseHaitianHonduranHopiHungarianIcelanderIndian (Asian)IndonesianInupiatIranianIraqiIrishIroquoisIsraeliItalianJamaicanJapaneseJordanianKenyanKoreanLaotianLatvianLebaneseLiberianLithuanianLumbeeLuxembourgerMacedonianMalaysianMalteseMarshalleseMexicanMexican American IndianMongolianMoroccanNative HawaiianNavajoNepaleseNew ZealanderNicaraguanNigerianNorthern EuropeanNorwegianOkinawanOsagePaiutePakistaniPalestinianPanamanianParaguayanPennsylvania GermanPeruvianPimaPolishPortuguesePotawatomiPuebloPuerto RicanPuget Sound SalishRomanianRussianSalvadoranSamoanScandinavianScotch-IrishScottishSeminoleSenegaleseSerbianShoshoneSierra LeoneanSiouxSlavicSlovakSloveneSomaliSouth AfricanSouth AmericanSouth American IndianSoviet UnionSpaniardSpanishSpanish AmericanSpanish American IndianSri LankanSubsaharan AfricanSwedishSwissSyrianThaiTlingit-HaidaTonganTrinidadian and TobagonianTsimshianTurkishUgandanUkrainianUruguayanUteVenezuelanVietnameseWelshWest IndianYakamaYaquiYugoslavianYup'ik
Ancestry (Percentage)
AfghanAfricanAlaska NativeAlaskan AthabascanAlbanianAleutAlsatianAmericanApacheArabArgentineanArmenianAustralianAustrianBahamianBangladeshiBasqueBelgianBelizeanBhutaneseBlackfeetBolivianBrazilianBritishBritish West IndianBulgarianBurmeseCajunCambodianCanadianCelticCentral AmericanCentral American IndianCherokeeCheyenneChickasawChileanChineseChippewaChoctawColombianColvilleCosta RicanCreeCreekCroatianCubanCzechCzechoslovakianDanishDelawareDominicanDutchEastern EuropeanEcuadorianEgyptianEnglishEstonianEthiopianEuropeanFijianFilipinoFinnishFrenchFrench American IndianFrench CanadianGermanGerman RussianGhanaianGreekGuamanian / ChamorroGuatemalanGuyaneseHaitianHonduranHopiHungarianIcelanderIndian (Asian)IndonesianInupiatIranianIraqiIrishIroquoisIsraeliItalianJamaicanJapaneseJordanianKenyanKoreanLaotianLatvianLebaneseLiberianLithuanianLumbeeLuxembourgerMacedonianMalaysianMalteseMarshalleseMexicanMexican American IndianMongolianMoroccanNative HawaiianNavajoNepaleseNew ZealanderNicaraguanNigerianNorthern EuropeanNorwegianOkinawanOsagePaiutePakistaniPalestinianPanamanianParaguayanPennsylvania GermanPeruvianPimaPolishPortuguesePotawatomiPuebloPuerto RicanPuget Sound SalishRomanianRussianSalvadoranSamoanScandinavianScotch-IrishScottishSeminoleSenegaleseSerbianShoshoneSierra LeoneanSiouxSlavicSlovakSloveneSomaliSouth AfricanSouth AmericanSouth American IndianSoviet UnionSpaniardSpanishSpanish AmericanSpanish American IndianSri LankanSubsaharan AfricanSwedishSwissSyrianThaiTlingit-HaidaTonganTrinidadian and TobagonianTsimshianTurkishUgandanUkrainianUruguayanUteVenezuelanVietnameseWelshWest IndianYakamaYaquiYugoslavianYup'ik
Immigrant Origin (Total)
AfghanistanAfricaArgentinaArmeniaAsiaAustraliaAustriaBahamasBangladeshBarbadosBelarusBelgiumBelizeBosnia and HerzegovinaBrazilBulgariaBurma / MyanmarCambodiaCameroonCanadaCaribbeanCentral AmericaChileChinaColombiaCongoCosta RicaCroatiaCubaCzechoslovakiaDenmarkDominican RepublicEastern AfricaEastern AsiaEastern EuropeEcuadorEgyptEl SalvadorEnglandEritreaEthiopiaEuropeFijiFranceGermanyGhanaGreeceGuatemalaHaitiHondurasHong KongHungaryIndiaIndonesiaIranIraqIrelandIsraelItalyJamaicaJapanJordanKazakhstanKenyaKoreaKuwaitLaosLatin AmericaLatviaLebanonLiberiaLithuaniaMalaysiaMexicoMicronesiaMiddle AfricaMoldovaMoroccoNepalNetherlandsNicaraguaNigeriaNorth MacedoniaNorthern AfricaNorthern EuropeNorwayOceaniaPakistanPanamaPeruPhilippinesPolandPortugalRomaniaRussiaSaudi ArabiaScotlandSerbiaSingaporeSomaliaSouth AfricaSouth AmericaSouth Central AsiaSouth Eastern AsiaSouthern EuropeSpainSri LankaSudanSwedenSwitzerlandSyriaTaiwanThailandTrinidad and TobagoTurkeyUgandaUkraineUruguayUzbekistanVenezuelaVietnamWestern AfricaWestern AsiaWestern EuropeYemen
Immigrant Origin (Percentage)
AfghanistanAfricaArgentinaArmeniaAsiaAustraliaAustriaBahamasBangladeshBarbadosBelarusBelgiumBelizeBosnia and HerzegovinaBrazilBulgariaBurma / MyanmarCambodiaCameroonCanadaCaribbeanCentral AmericaChileChinaColombiaCongoCosta RicaCroatiaCubaCzechoslovakiaDenmarkDominican RepublicEastern AfricaEastern AsiaEastern EuropeEcuadorEgyptEl SalvadorEnglandEritreaEthiopiaEuropeFijiFranceGermanyGhanaGreeceGuatemalaHaitiHondurasHong KongHungaryIndiaIndonesiaIranIraqIrelandIsraelItalyJamaicaJapanJordanKazakhstanKenyaKoreaKuwaitLaosLatin AmericaLatviaLebanonLiberiaLithuaniaMalaysiaMexicoMicronesiaMiddle AfricaMoldovaMoroccoNepalNetherlandsNicaraguaNigeriaNorth MacedoniaNorthern AfricaNorthern EuropeNorwayOceaniaPakistanPanamaPeruPhilippinesPolandPortugalRomaniaRussiaSaudi ArabiaScotlandSerbiaSingaporeSomaliaSouth AfricaSouth AmericaSouth Central AsiaSouth Eastern AsiaSouthern EuropeSpainSri LankaSudanSwedenSwitzerlandSyriaTaiwanThailandTrinidad and TobagoTurkeyUgandaUkraineUruguayUzbekistanVenezuelaVietnamWestern AfricaWestern AsiaWestern EuropeYemen
Income
Income (Families)
Income (Households)
Poverty
Poverty (Families)
Unemployment
Employment Occupations
Employment Industries
Employer Class
Commute Time
Commute Means
School Enrollment
Education by Degree Field
Occupancy
Finances
Physical Characteristics
Portland
Compare Zip Codes
Comparison Subject

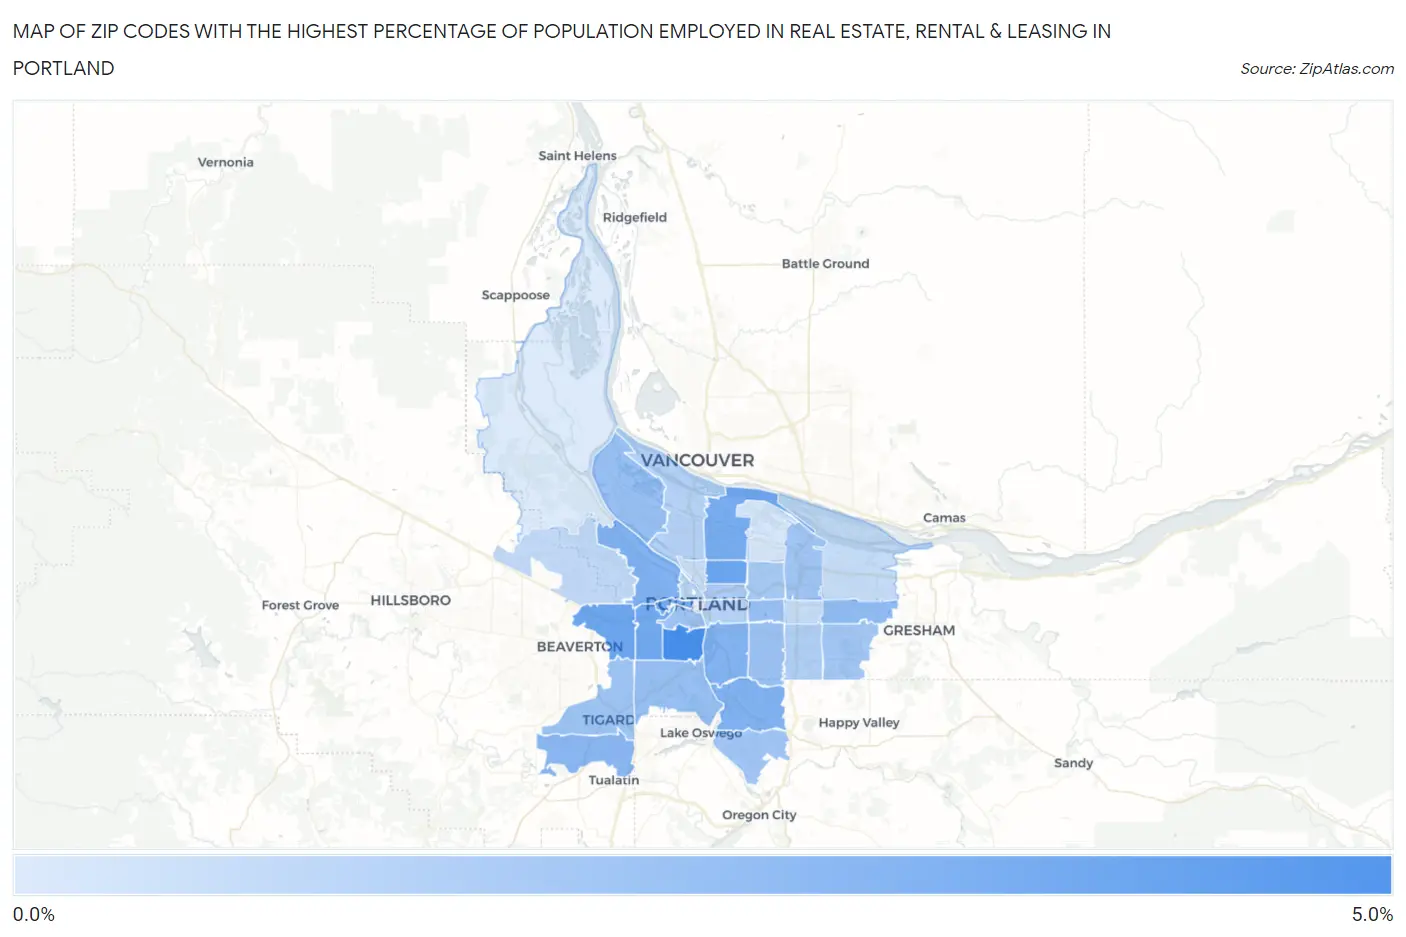
Map of Zip Codes with the Highest Percentage of Population Employed in Real Estate, Rental & Leasing in Portland

0.0%
5.0%
Zip Codes with the Highest Percentage of Population Employed in Real Estate, Rental & Leasing in Portland Map

Zip Codes with the Highest Percentage of Population Employed in Real Estate, Rental & Leasing in Portland, OR

Zip Code % Employed vs State vs National
1.972394.0%2.0%(+2.03)#451.9%(+2.11)#2,165
2.972123.2%2.0%(+1.18)#671.9%(+1.26)#3,511
3.972253.1%2.0%(+1.17)#681.9%(+1.25)#3,526
4.972213.1%2.0%(+1.09)#701.9%(+1.17)#3,720
5.972053.0%2.0%(+1.00)#731.9%(+1.08)#3,966
6.972112.9%2.0%(+0.953)#741.9%(+1.03)#4,094
7.972102.7%2.0%(+0.765)#781.9%(+0.847)#4,625
8.972222.7%2.0%(+0.752)#791.9%(+0.834)#4,666
9.972022.7%2.0%(+0.718)#821.9%(+0.799)#4,778
10.972242.5%2.0%(+0.563)#941.9%(+0.645)#5,345
11.972332.4%2.0%(+0.415)#1041.9%(+0.497)#5,949
12.972032.3%2.0%(+0.284)#1131.9%(+0.366)#6,525
13.972192.2%2.0%(+0.248)#1141.9%(+0.330)#6,709
14.972152.2%2.0%(+0.238)#1151.9%(+0.320)#6,755
15.972062.2%2.0%(+0.197)#1191.9%(+0.279)#6,956
16.972012.1%2.0%(+0.113)#1271.9%(+0.195)#7,391
17.972232.1%2.0%(+0.085)#1291.9%(+0.167)#7,546
18.972672.0%2.0%(+0.077)#1321.9%(+0.158)#7,588
19.972202.0%2.0%(+0.061)#1331.9%(+0.143)#7,664
20.972362.0%2.0%(+0.010)#1391.9%(+0.091)#7,933
21.972131.9%2.0%(-0.081)#1481.9%(+0.001)#8,519
22.972321.8%2.0%(-0.124)#1531.9%(-0.042)#8,791
23.972661.7%2.0%(-0.274)#1641.9%(-0.192)#9,755
24.972171.6%2.0%(-0.394)#1781.9%(-0.313)#10,584
25.972091.5%2.0%(-0.441)#1831.9%(-0.359)#10,917
26.972141.5%2.0%(-0.448)#1851.9%(-0.366)#10,967
27.972291.3%2.0%(-0.657)#2061.9%(-0.575)#12,605
28.972301.2%2.0%(-0.750)#2141.9%(-0.668)#13,302
29.972161.2%2.0%(-0.761)#2181.9%(-0.679)#13,392
30.972271.2%2.0%(-0.784)#2201.9%(-0.702)#13,566
31.972180.90%2.0%(-1.07)#2451.9%(-0.987)#15,923
32.972310.74%2.0%(-1.23)#2561.9%(-1.15)#17,161

Common Questions

What are the Top 10 Zip Codes with the Highest Percentage of Population Employed in Real Estate, Rental & Leasing in Portland, OR?
Top 10 Zip Codes with the Highest Percentage of Population Employed in Real Estate, Rental & Leasing in Portland, OR are:
#1
4.0%
#2
3.2%
#3
3.1%
#4
3.1%
#5
3.0%
#6
2.9%
#7
2.7%
#8
2.7%
#9
2.7%
#10
2.5%
What zip code has the Highest Percentage of Population Employed in Real Estate, Rental & Leasing in Portland, OR?
97239 has the Highest Percentage of Population Employed in Real Estate, Rental & Leasing in Portland, OR with 4.0%.
What is the Percentage of Population Employed in Real Estate, Rental & Leasing in Portland, OR?
Percentage of Population Employed in Real Estate, Rental & Leasing in Portland is 2.1%.
What is the Percentage of Population Employed in Real Estate, Rental & Leasing in Oregon?
Percentage of Population Employed in Real Estate, Rental & Leasing in Oregon is 2.0%.
What is the Percentage of Population Employed in Real Estate, Rental & Leasing in the United States?
Percentage of Population Employed in Real Estate, Rental & Leasing in the United States is 1.9%.