Zip Codes with the Highest Percentage of Population Employed in Food Preparation & Serving in Portland, OR
RELATED REPORTS & OPTIONS
Food Preparation & Serving
Portland
Compare Zip Codes
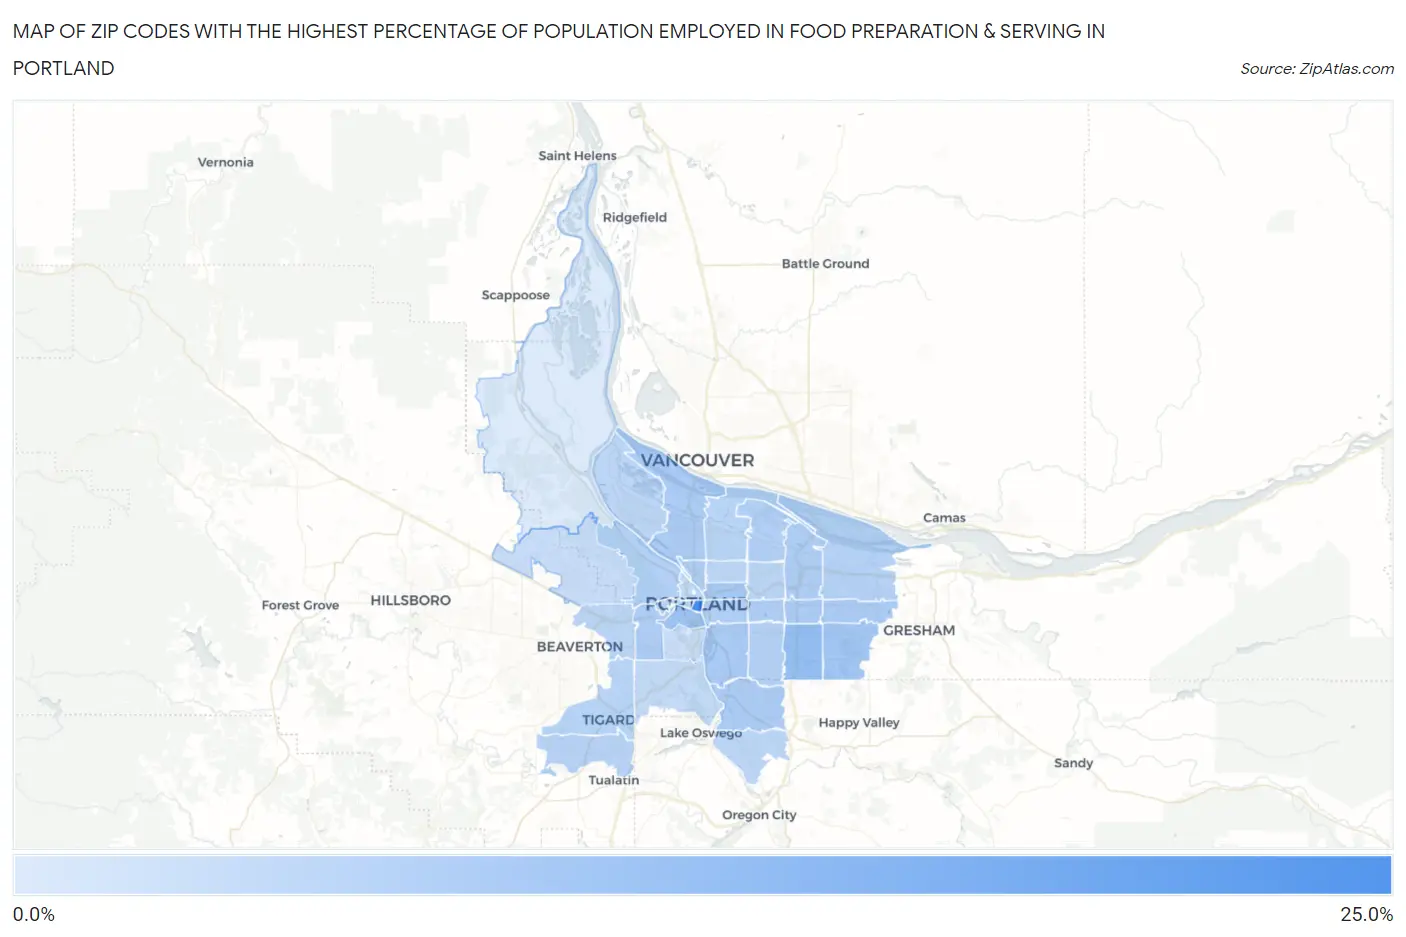
Map of Zip Codes with the Highest Percentage of Population Employed in Food Preparation & Serving in Portland
0.21%
21.8%
Zip Codes with the Highest Percentage of Population Employed in Food Preparation & Serving in Portland, OR
| Zip Code | % Employed | vs State | vs National | |
| 1. | 97204 | 21.8% | 5.9%(+15.9)#7 | 5.3%(+16.5)#427 |
| 2. | 97266 | 10.0% | 5.9%(+4.05)#45 | 5.3%(+4.69)#2,652 |
| 3. | 97201 | 8.7% | 5.9%(+2.77)#69 | 5.3%(+3.41)#3,845 |
| 4. | 97236 | 8.0% | 5.9%(+2.03)#90 | 5.3%(+2.67)#4,793 |
| 5. | 97232 | 7.5% | 5.9%(+1.59)#102 | 5.3%(+2.23)#5,536 |
| 6. | 97202 | 7.0% | 5.9%(+1.04)#115 | 5.3%(+1.68)#6,643 |
| 7. | 97216 | 6.8% | 5.9%(+0.916)#123 | 5.3%(+1.56)#6,954 |
| 8. | 97222 | 6.8% | 5.9%(+0.847)#126 | 5.3%(+1.49)#7,125 |
| 9. | 97233 | 6.6% | 5.9%(+0.672)#134 | 5.3%(+1.31)#7,602 |
| 10. | 97217 | 6.6% | 5.9%(+0.668)#135 | 5.3%(+1.31)#7,614 |
| 11. | 97215 | 6.6% | 5.9%(+0.630)#136 | 5.3%(+1.27)#7,709 |
| 12. | 97221 | 6.5% | 5.9%(+0.617)#137 | 5.3%(+1.26)#7,753 |
| 13. | 97227 | 6.5% | 5.9%(+0.530)#140 | 5.3%(+1.17)#7,981 |
| 14. | 97220 | 6.4% | 5.9%(+0.497)#143 | 5.3%(+1.14)#8,083 |
| 15. | 97218 | 5.9% | 5.9%(-0.031)#158 | 5.3%(+0.610)#9,699 |
| 16. | 97214 | 5.8% | 5.9%(-0.089)#162 | 5.3%(+0.552)#9,906 |
| 17. | 97210 | 5.8% | 5.9%(-0.155)#166 | 5.3%(+0.486)#10,117 |
| 18. | 97206 | 5.6% | 5.9%(-0.326)#171 | 5.3%(+0.315)#10,692 |
| 19. | 97230 | 5.6% | 5.9%(-0.327)#172 | 5.3%(+0.314)#10,700 |
| 20. | 97224 | 5.1% | 5.9%(-0.781)#192 | 5.3%(-0.140)#12,378 |
| 21. | 97223 | 5.0% | 5.9%(-0.972)#198 | 5.3%(-0.331)#13,127 |
| 22. | 97211 | 4.7% | 5.9%(-1.22)#203 | 5.3%(-0.582)#14,148 |
| 23. | 97203 | 4.6% | 5.9%(-1.29)#211 | 5.3%(-0.648)#14,419 |
| 24. | 97267 | 4.6% | 5.9%(-1.37)#217 | 5.3%(-0.726)#14,788 |
| 25. | 97225 | 4.5% | 5.9%(-1.39)#220 | 5.3%(-0.745)#14,855 |
| 26. | 97205 | 4.5% | 5.9%(-1.42)#221 | 5.3%(-0.784)#15,022 |
| 27. | 97213 | 4.4% | 5.9%(-1.56)#226 | 5.3%(-0.921)#15,574 |
| 28. | 97212 | 4.1% | 5.9%(-1.79)#233 | 5.3%(-1.15)#16,539 |
| 29. | 97209 | 3.7% | 5.9%(-2.18)#245 | 5.3%(-1.54)#18,136 |
| 30. | 97219 | 3.5% | 5.9%(-2.44)#253 | 5.3%(-1.80)#19,245 |
| 31. | 97229 | 2.8% | 5.9%(-3.10)#280 | 5.3%(-2.46)#21,973 |
| 32. | 97239 | 2.6% | 5.9%(-3.32)#287 | 5.3%(-2.68)#22,756 |
| 33. | 97231 | 0.21% | 5.9%(-5.72)#344 | 5.3%(-5.07)#27,893 |
1
Common Questions
What are the Top 10 Zip Codes with the Highest Percentage of Population Employed in Food Preparation & Serving in Portland, OR?
Top 10 Zip Codes with the Highest Percentage of Population Employed in Food Preparation & Serving in Portland, OR are:
What zip code has the Highest Percentage of Population Employed in Food Preparation & Serving in Portland, OR?
97204 has the Highest Percentage of Population Employed in Food Preparation & Serving in Portland, OR with 21.8%.
What is the Percentage of Population Employed in Food Preparation & Serving in Portland, OR?
Percentage of Population Employed in Food Preparation & Serving in Portland is 5.8%.
What is the Percentage of Population Employed in Food Preparation & Serving in Oregon?
Percentage of Population Employed in Food Preparation & Serving in Oregon is 5.9%.
What is the Percentage of Population Employed in Food Preparation & Serving in the United States?
Percentage of Population Employed in Food Preparation & Serving in the United States is 5.3%.